


Welcome to the Artificial Intelligence Outlook for Forex trading.
VIDEO TRANSCRIPT
Hello everyone and welcome back. My name is Greg Firman, and this is the Vantagepoint AI market outlook for the week of May the 17th, 2021.
U.S. Dollar Index
Now to get started this week, we’re going to begin where we always do with that very important US dollar index. Now, very hot CPI number, but not enough to push the dollar out of its current range. We did have a very nice bounce off the yearly opening price down around the 90 mark, just below the 90 mark. But again, we’re getting all tangled up in that VP T cross Long at the 90.90 level.
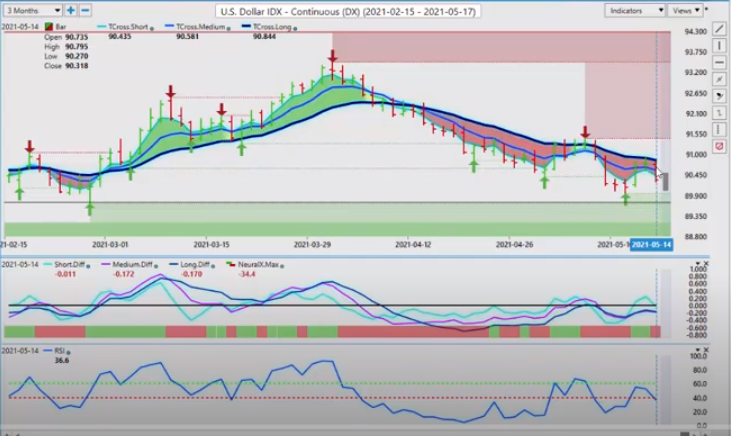
Now, again, when we look at this, we would expect dollar weakness in this previous week after the non-farm payroll number, but we also are unlikely to see a lot of heavy dollar buying until we get towards the end of the month. So at this current time, shorts on the dollar still appear to be the better play, even though we had a pretty sharp reversal on a number of the different Forex pairs on gold, on some of the other Bitcoin, which Bitcoin, we’re going to definitely have a discussion about that one this week with some of the things going on. But when we look at the levels that you want to watch in your trading, 90.84, we’ve come up and hit that on Thursday and on Friday, failing both times. This suggests that the dollar cycle still firmly in place, and we are unlikely to see a lot of dollar buying.
Now, the event risk coming this week is of course the Fed minutes. Now, I don’t think there’s going to be anything in that Fed minutes, but we are looking for dissenters in there, people that don’t agree with Powell’s position that are saying, “Look, we should be raising rates, or we should be backing off some of this a little.” That’s what I personally will be watching for. I’ll make sure to update everybody in next week’s outlook. But for now, that is a major event risk. If we click on our F8 in our Vantage Point software and we connect the dots here, 90.55, we have additional resistance at this particular level also. My concern here is that we did have these two bars in a row that were able to close above this. But again, that’s why we bring in the T cross long as an additional pivot area for confirmation that the dollar is still bearish here and nothing has changed.
The predicted RSI is breaking down below the 40 level, could suggest that momentum is also building to the downside. Now with that, gold really didn’t do anything this past week. It stayed right where it is, but it’s not bearish. Now, with the comments that I made from last week, just a reminder, the comments section is there to ask questions, but if there’s inappropriate comments, they’re just going to be deleted. What I said last week was entirely accurate and relevant, by saying that gold made its move in 2020, largely because of what happened with COVID. There’s the chart. We can assess the actual rate down to the particular day. I can actually pinpoint the day to you. This was common, or I assumed it was common knowledge. On March the 15th of 2020, COVID hit like a brick wall.
Gold
We can see that the average range in gold on a year over year basis is usually anywhere from 150 to approximately $300 an ounce over a year to year basis. This is an excessive move. Would this move have happened, if not for COVID? The answer is no. It more than likely would not have, just like in the financial crisis, the same thing happened. So when we look at March the 15th of 2020, it’s pretty simple to connect the dots here, that there was an emergency rate cuts. And again, markets in Europe, Asia plummeted after the central bank slashed rates. So again, I’m connecting the dots here to a global event. So in my respectful opinion, gold, in most cases, would have gone from about the 1450 mark to maybe say a maximum of somewhere between 1650 and maybe 1800, but it would not have gone to 2061. There wasn’t enough meat on the bone to push it there.
And for the main reason I brought that up, because it would be negligent if I didn’t, because after every one of these catastrophic events, this has been the outcome for gold. So again, each time we hear gold 3000, gold 5,000, we hear all of these things and it’s never come to fruition. So I’m simply advising new traders coming into the market that you need to understand that there was other events that took place that pushed gold excessively outside of its normal yearly ranges. That’s all that was said. But again, in the future with comments like that, they will just be deleted. Because again, it just a waste of both of our time here. It needs to be said, so people understand and can see that. I did not say, or even mentioned the word seasonality. Of course there’s seasonalities in gold, in oil in a number of the different markets. And with that seasonality gold probably would have gone up to the affirmation levels, maybe from 1450 to 1700 or so if the Fed was talking about cutting rates, right?
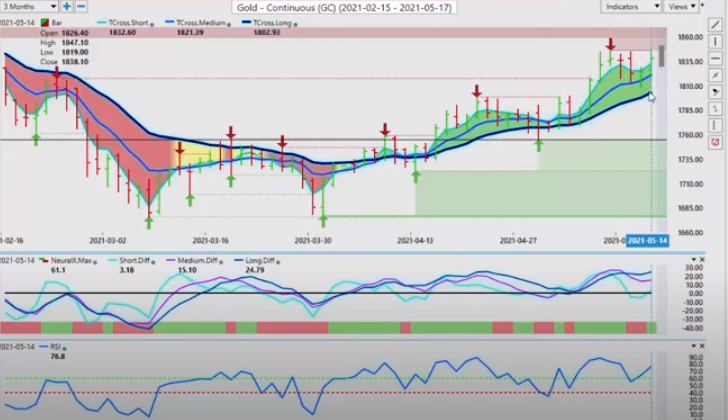
So when we look at this, gold got hammered lower, down this week on the CPI number, but then it immediately recovered. So once again, when we look at this, we’ve got key levels, 1802.93, that’s our T cross long. Gold is obviously bullish while above that particular level. What I further advised was I am not a buyer unless we can clear 1904. So again, when we look at this chart, this gold chart for this particular year, we can clearly identify a bottom down here. So I’ll do it for everybody on the live trading platform. You can see we’ve got a bottom, I would say we’ve got a bottom, at least in place at 1675. And then at the beginning of the calendar year again, I think we were just above. We started about 1904. We went slightly above that. And then it’s been down on the entire calendar year since.
So right now, if we’ve got a bottom on gold at 1675, and I did mention that multiple times on the AI weekly outlooks, and this was months ago, back in March, and then I said it right here again on April the first, that this was concerning to me that we were no longer making any new lows on gold. But at the same time, I had mentioned that, okay, we’re below the yearly opening price Vantage Point signal at that time was not overly bullish. And that’s why I have the position that I do. And the fact that I then in turn said that things are improving. So if California, Texas, Florida are all dumping the mask requirements, I would say that things are getting better, wouldn’t you? So again, nothing inappropriate with what I’ve stated, they’re just facts, right? And I’ve matched it up to again, the substantial rise in gold was because of COVID and then I’ve simply tagged it to the event that caused it. Easy peasy, right?
So when we look at gold going forward this year, this week, excuse me, our key pivot level to begin the week is 1826. We want to watch that, and the T cross long, very, very closely to see if we can hold above that. Now, one of the determining factors and the pairs that this has a high correlation to, that I’ve often stated this. And actually I said the exact same thing throughout this calendar year and the end of last year. The Euro simply rode the write-up with gold, the Euro went up with it and both have been struggling since. So again, if gold rises, that’s going to give a little bit of assistance to the Euro currency, right?
So if you’re looking at this right now, we’ll connect the dots. 1826 and the long predicted. Once again, if we flip over here quickly, I’ll go a little bit out of order, but you can see as gold retraced, so did the Euro currency to the exact VP level, and both of them extended higher from there. The Euro US pair, the yearly opening price is around the 1.2240 mark. If gold continues to advance and breaks above its yearly opening price, then the Euro will follow. Longs up here are very high risk, but at this time of the month, they are more than reasonable.
So again, if I click on the F8 in the Vantage Point software, we have cleared that pivot area 1.2107 to begin the week. That is where you want to watch. The same thing, if you’re trading the Euro US pair, stay very focused on those gold contracts. If there is a seasonality in the month of June and it pushes, well, even without a seasonality, the dollar is normally week around the middle of the month anyway. But you will also notice in this chart, when I brought up this chart, that gold is not actually always weak in January, and actually some of these Januarys it’s had a very good rally. And I’ve also discussed this at length in some of the seminars and in the Vantage Point live training room, that gold and the dollar actually can move up and down together. I’ve seen them do it for two or three months at a time in the past, when you’ve got a catastrophic global event. The three that come to mind, the financial crisis, the tsunami that hit Japan and of course, COVID-19. These are the three main ones that stand out in front, right?
S&P 500 Index
Now, when we look at our stocks going into next week, they took a beating on that CPI number. 4%, I think it was on the CPI. So that’s a very hot inflation number, but once again, you can see that there just seems to be nothing stopping the stock rally. It just bounces right back. So at the end of the week, it is a Friday, so we’ll see how we begin the week. But again, we’ve got our medium term crossing our longterm predicted difference with the neural index, a rising RSI that managed to sneak it’s way above 50. We’re at 52.6, but if the predicted RSI breaks the 60 level, then we’re going to have momentum. That’s what we’re looking for here, is momentum, okay?
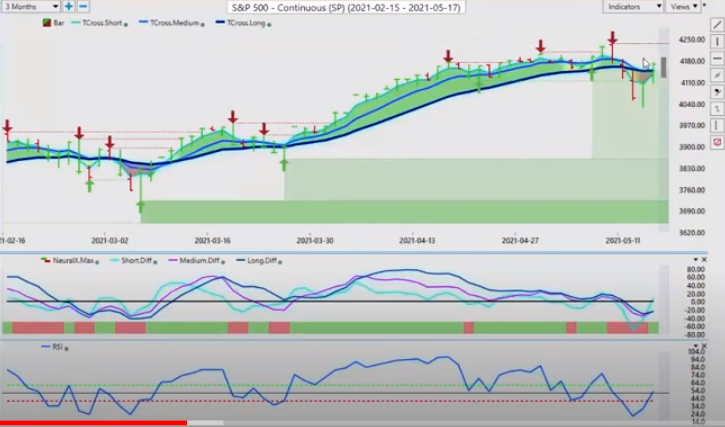
So, that key Vantage Point level is 4148. If we click on the F8, we can see that we also have support at 4143. So 4143, 4148’s, same level. To begin the week, that’s where you would look to potentially target a continuation of longs. Because again, the Fed is saying the CPI is transit. These are all transitory inflation numbers. Well, I’ll leave my personal opinions out of that. I don’t specifically agree with what he’s saying, looking at the housing market, construction costs, building costs, gasoline prices. To say that inflation here is transitory, well, we’ll see what the minutes say. But again, stocks are still at the forefront.
Crude Oil
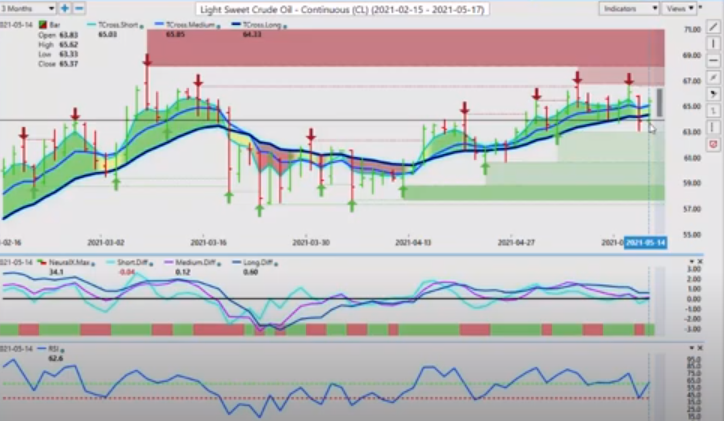
With oil next week, going into oil, oil is going to continue. There’s a lot going on in Israel with Palestine. You’ve got a gas shortage emergency, a shortage in Florida because the pipelines got hacked. So oil is staying firm. It looks like Canada is not doing great with COVID, but it looks like some of the other countries are, particularly the US, so if you guys get some kind of summer driving season, well, oil would normally start strengthening towards June, July and August anyway. So oil still remains firm while above 64.33.
Now, coming back in here to one of my favorites, we’re going to have a little bit of a conversation here with this Elon Musk fellow, because I’m a little confused as to what he’s doing here. So in February, and again, I’m just going to have a off the cuff conversation here, he buys $1.5 billion worth of Bitcoins. Then in March, he turns around and says, “Okay, we’re going to accept payments in our cars for Bitcoin.” Right? Then he goes on to Saturday Night Live this past week, and he turns around and plugs Dogecoin, which in turn caused it to crash. Then he comes out this week on Monday or Tuesday or Wednesday, whatever day it was, and he turns around and tells us that he is halting, not stopping, halting payment on Bitcoins, citing environmental concerns.
So here’s my issue guys, and I don’t profess to be an expert in Bitcoin. I probably have the same understanding of it as most people, but he’s saying now, with these environmental concerns, that’s why he’s doing it. But here’s the thing. It looks like more of a chess game that this guy’s playing with us, because what he said is actually not factual. When I look closer at it, there’s less fossil fuels being used to mine Bitcoin, and there’s been a considerable uptick in renewables using to get Bitcoin.
So I’m not really sure what this guy is doing, but I’m starting to get the sense that he’s pushing it down to prop it back up, help out Dogecoin because he crashed it on Saturday. I don’t know what he’s doing, but all I know is that renewables are starting to be used. So, I am not at this time going to say that my position on Bitcoin has changed and that it’s a very good investment. And that it’s incredibly bullish. It looks like more of a multipoint chess move to me, what he’s doing. So again, he could come out next week or next month and say, “Oh, the Bitcoin mining is now 80% renewables. We’re going to start accepting Bitcoin again.” Boom. It goes to the roof. Expect this to be volatile. It’s still in more of an infant stage as it starts to get more regulated. But again, we’ve got heavy verified support down here. That support is coming in at the low of 47,131. We are way above the yearly opening price down in the lower 30,000 range. So again, I would be looking for a retracement.
If I can piece this puzzle together, I’m sure that a lot of you can too, and you can start to question some of the things that this man is saying. I have a great deal of respect for Mr Musk, but I’m a little confused as to the comments he’s making. And I think we’ve all seen that with the board of directors of Tesla. I think at one time they muzzled him because of some of the things he was saying. But once again, we’ll watch the support level, the yearly opening price, and his comments will continue to drive this particular pair.
Euro versus U.S. Dollar
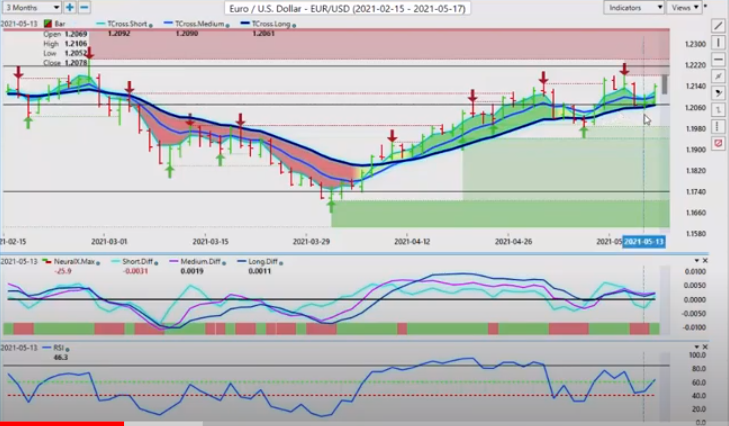
Now we have looked at Euro. The Euro is likely to have a decent week, this coming week. They’re still printing money, just like the US and Canada and everybody else. But again, in a period of dollar weakness, but if there is any news from that fed, that is even slightly hawkish, or if you have a number of dissenters in there, that could change things. So just know your key levels going into next week.
British Pound versus U.S. Dollar
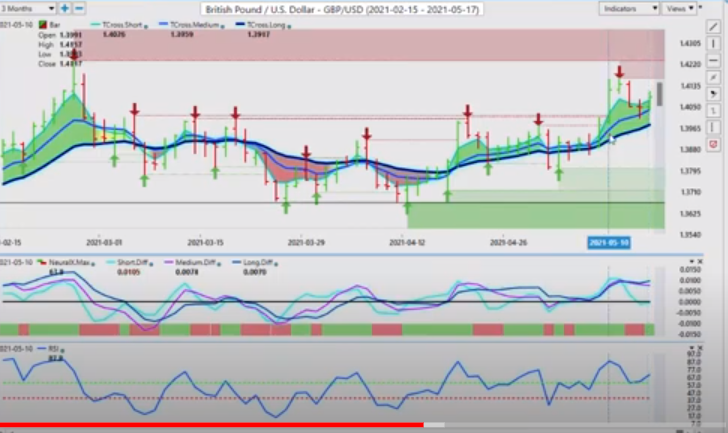
Now, as we look at the pound dollar for next week, the pound dollar, it made a considerable move right off the open on Monday, and did absolutely nothing. It’s done nothing since, but it is getting tangled up in these VP levels. We’re still firmly above 1.3978 and the yearly opening price. When we looked at the beginning of the week, we would watch this area very closely at 1.4061. When we use the Vantage Point predicted low, it’s coming in at 1.4056. This is how we connect the dots here. We use the blue line by itself as a pivot level, as an entry point, and then match it to the predicted low. That looks like a pretty decent spot to start buying. It’s just a question, if the market is skittish about the Fed minutes, and they’re not going to jump onto dollar shorts until they see those minutes. That is possible.
Now our medium term has crossed the long term predicted difference down, but very mixed on the neural index and the predicted RSI is still up. So again, if you’re going to take this trade or you’re looking to trade the pound dollar, this is the level you would watch very, very closely, right around the 1.4060 mark to see if that holds. I imagine with the close of 1.4090, we will absolutely come down and test that in early London trade.
U.S. Dollar versus Japanese Yen
Now with the dollar yen, the dollar yen, again, getting tangled up in is these Vantage Point verified zones, again. The zones high 109.96 and then we again have the high coming in at the 109.70 mark. Now, one of the reasons I designed these predicted moving average and verified zones in collaboration with Vantage Point is to let traders know that we’ve got resistance here. It’s color coded with a light pink, a darker colored pink, and then a hard red, which is real stiff resistance, just like the hard green on the downside is very, very strong support. So right now the dollar yen appears to be trapped, but just remember gold plays a factor here too.
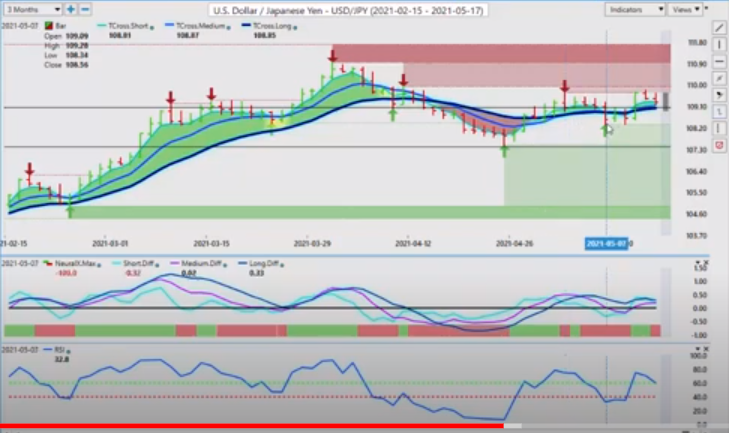
If gold advances that is likely going to push the dollar yen lower. The only thing that’s keeping the dollar yen propped up here is again, the recovery in the stock market. Stocks being as strong then if gold is a little bit weaker, but if gold is strong, the dollar yen does respond to the equity markets. So once again, if gold advances, the dollar yen is likely to move lower, that’s a very, very strong possibility at this particular time in the month, barring any news coming out of the Fed minutes that you’ve got dissenters. I’ll keep using that word dissenters, so everybody knows what I mean, because not a lot of times, but a number of times there’s been problems inside of that panel or that board, and they don’t agree with each other. And some of them have been quite vocal.
So we will watch this support level 109.03 long while above 109.03. But again, when we click on our F8 and we use the Vantage Point predicted moving average by itself, zero lag 109.25. If we break down below 109.25, and we break down below 109 I usually offer up a type of alternative trading strategy here that I use. I would suggest here that an alternate play would be to have a sell limit order sitting at about 108.85. So as soon as we break down below the two key Vantage Point levels, you have a sell order sitting there ready to go. And then of course, all stops would be above the verified zones.
U.S. Dollar versus Canadian Dollar
Now, when we look at US Canada, it took a hit too with the equity market started moving back up, but this is a pretty shallow pull back. We didn’t even get to 1.2253. The yearly opening price on US Canada is way up at the 1.27 mark, incredibly bearish this year with equities, with commodity prices up. So when we look at this, I don’t anticipate we’re going to get to 1.2253. But when we click on our F8, again, very important to use this, because you can see that the market is struggling with this blue line. I do like a two day rule for a complete trend reversal. And I like to see it break above the T cross long.

So really, I don’t have a lot of interest in longs on US Canada, unless we can get above 1.2240, stay above 1.2240, and then we have a shot maybe at moving back towards the 1.27 mark. But that appears unlikely, at least in this particular time. Maybe towards the fall, but right now, coming into a potential summer driving season in the US as the restrictions are lifted by June, likely, that’s going to boost oil prices and that will in turn correlate to the Canadian dollar.
So again, our indicators remain bearish, a potential entry point for shorts to begin the week. Between 1.2143 and 1.2234, those are the levels you would target. Now, if the US Canadian pair continues to advance lower than Aussie US and New Zealand US will likely recover and start moving back up. Now our key level there, 77.60, we want to hold above that. Our indicators here, we’ve got an RSI above 50, and it’s rising. Predicted differences are rather flat, but our neural index is positive when. We click on the F8 here, once again, we just got to clear this line.
So, once again, guys, it’s just an alternate strategy for you guys to apply. Whether you want to use it or not, totally up to you. You identify the long predicted here. The long predicted is 77.69. You can put your limit orders to buy at say 77.80, right? The alternative method to that is you can buy the Vantage Point predicted low at 77.50. The indicators here suggest that that’s a reasonable play. I tend to like to get above the predicted moving average before I will start going after it.
Australian Dollar versus U.S. Dollar
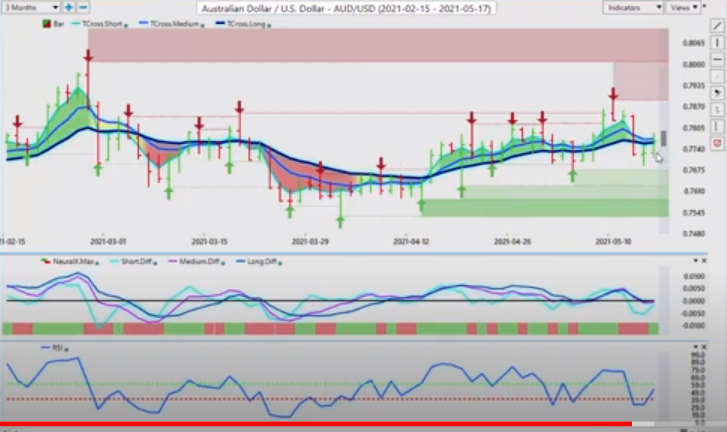
But during a period of dollar weakness, it’s more than reasonable to go long on the Aussie, but we would like to see those stocks continue to move higher. If they don’t, it’s going to affect the Canadian dollar. It’s going to affect the Aussie dollar, and of course the New Zealand dollar it will affect. So the New Zealand is actually making a bigger move here than even the Aussie.
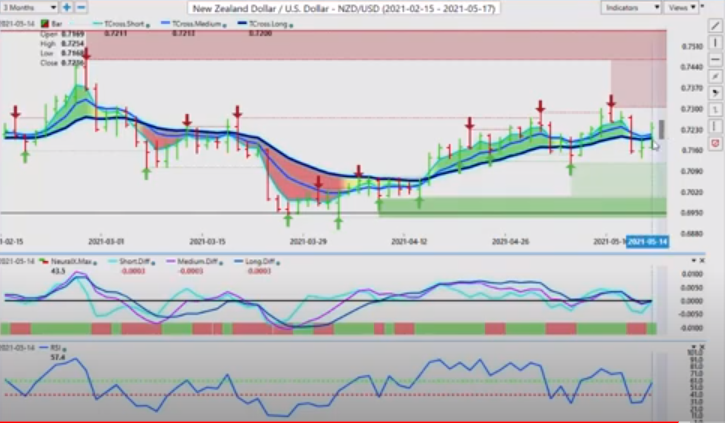
New Zealand Dollar versus U.S. Dollar
We’ve cleared the T cross long at 72. We click on our F8. Very quickly, we look at that pivot levels, 72.12. That’s where I would look for potential longs to begin the week. Just keep a very, very close eye here, guys, on the equity markets, more specifically the S and P 500. If the S and P 500 can continue to advance, the US CAD will go lower. Aussie US will go higher. New Zealand US will go higher. The dollar yen and US Swiss franc, we have to watch those two very closely.
Now I didn’t do the US Swiss frank. Maybe I should. I’ll do it very quickly here, but again, it still remains in a bearish formation. This indirectly, along with the dollar yen, not so much the dollar yen, I would argue this pair, is supportive of a potential break higher in gold, and a further breakdown in the US dollar. So this is the way we want to make sure we’re looking at things, not just indicators, but understanding the inner market correlations that drive said indicators.
So with that said, this is the Vantage Point AI Market Outlook for the week of May the 17th, 2021