


Welcome to the Artificial Intelligence Outlook for Forex trading.
VIDEO TRANSCRIPT
Hello everyone and welcome back. My name is Greg Firman, and this is the VantagePoint AI Market Outlook for the week of August the 22nd, 2022.
U.S. Dollar Index ($DXY)
Now to begin this week, we’ll begin where we always do with the US dollar index. Now, as we were talking about in last week’s outlook, I anticipated what I actually coined as a phrase of a delayed fuse, that the market basically talked itself into with, of course, the help of your local media of that the Fed is not going to hike. He’s going to change his mind. As I suspected, three Fed members have come out and shot that theory down saying they are on track to hike and they’ve misinterpreted the Fed minutes or the Fed meeting.
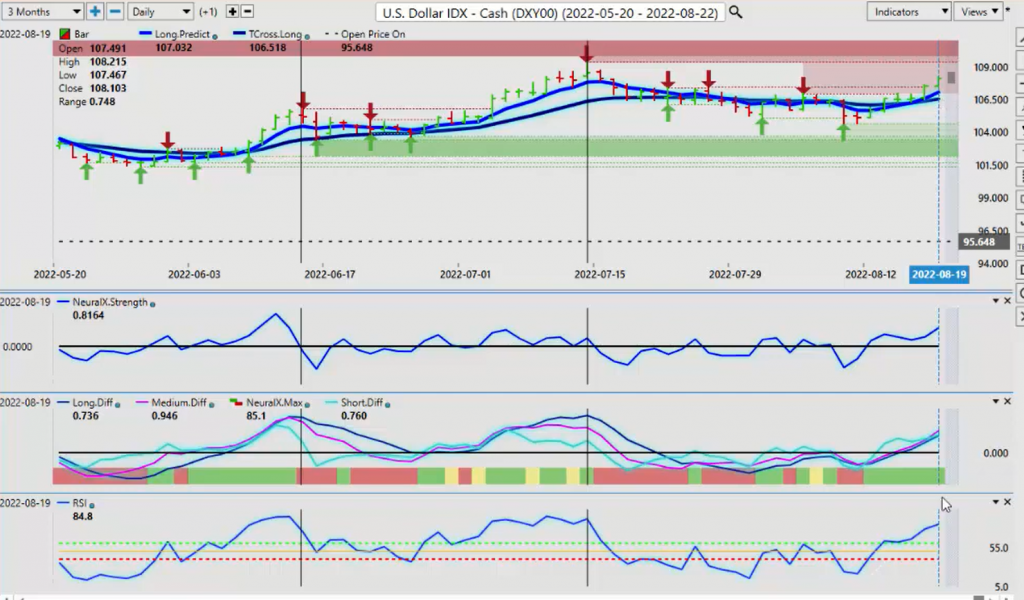
They’ve come back and the dollar has come back. Now, the key thing that we’ll look at here is the predictability of this happening, the neural index strength, which is one of my favorite indicators, and the neural index, of course too, but combining it with the predicted moving averages. We’ve crossed over here on the 15th. Basically by Tuesday of last week, we were already starting to turn. But on Wednesday, the intermarkets all came on board. We looked and discussed this in the VantagePoint live training room this past week, and I had stated then that it’s very, very… They even took some little side bets, equities versus the dollar index.
Of course, I took the dollar index side of that bet. The reason I did is because the S&P 500 could not break through that very important level that I discussed last week of 4307. We moved above it briefly, but we did not close above it two days in a row. Soon as the S&P 500 stalled, the dollar started to ramp up and then we moved higher. Again, this direct inverse correlation between the equity markets and the dollar itself is still fully intact. Now, our predicted differences have moved above the zero line. Predicted RSI breaking the 40 level showing that momentum was building. Again, this was already in progress on Wednesday.
We got a two day jump on a major breakout on the dollar, but the dollar is likely to find some resistance up at this 109.29 area, but that it would be our immediate target for this coming week providing we hold above T cross long at 106.51. We don’t get involved with overbought, oversold, any of this stuff. We stick with the markets. What I can tell you here is the correlated markets came on board on Wednesday and they still support further dollar longs, at least up until probably midweek providing there isn’t anything else coming out of the Fed.
Gold
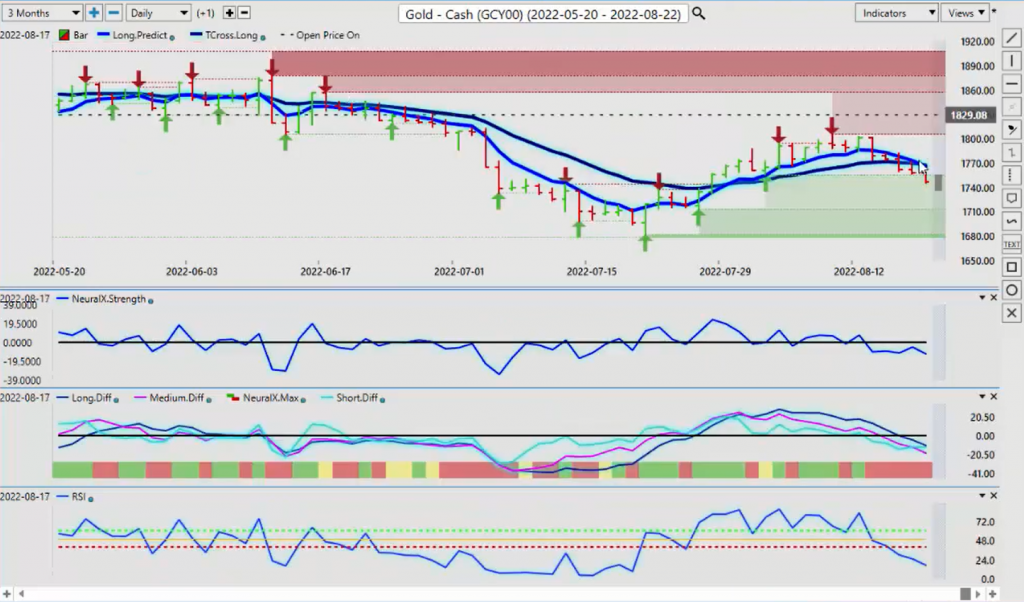
Now, this move, as you can see, the intermarkets also came on board on Wednesday with gold, which I’m still…
If I have my long-term bias between buying gold and buying the dollar, I will always be buying gold versus the dollar personally. But again, that’s just my opinion. If I look at the 20 year history of gold and the 20 year history of the dollar, I think that chart pretty much answers itself and the seasonal patterns, but gold is coming out of that seasonal pattern that usually dries up around September or so. But again, if the US goes into globally, we go into a recession, 70 to 80% of the time gold goes higher. This move is likely corrective in nature. But again, the intermarket started rolling over on Tuesday.
On Wednesday, we closed below the T cross long and the long predicted, and that triggered gold’s bigger move to the downside on gold on Thursday and Friday. Now, for this week, all indicators point lower. Our critical resistance that we must stay below, 1,767, 1,766. All of that is right at that particular area. We have a small gap between the predicted high, but I would always use the predicted moving averages as a pivot area or an entry point. Again, all of that resistance is at 1,766, 1,767. As long as the market stays below that level, then again, we would be looking at continued shorts, at least for now. But once again, you can see the neural index strength played a big part in this move.
Then the predicted differences, the neural index move lower, but using the predicted RSI with a 60/40 split actually tells us when momentum is starting to build. It can also act as support and resistance. But the main thing is, as we broke down under the key levels that triggered additional shorts, or probably I would imagine some of your traders that were heavily long gold likely started paring back some of those positions. Now, when we scroll down here, we’re going to hit the S&P before I go to Bitcoin here, because essentially I will continue to make that argument, it’s the same trade.
S&P 500 Index
The media, the pundit, they can go on and on about intrinsic values and no stored values and all this other nonsense.
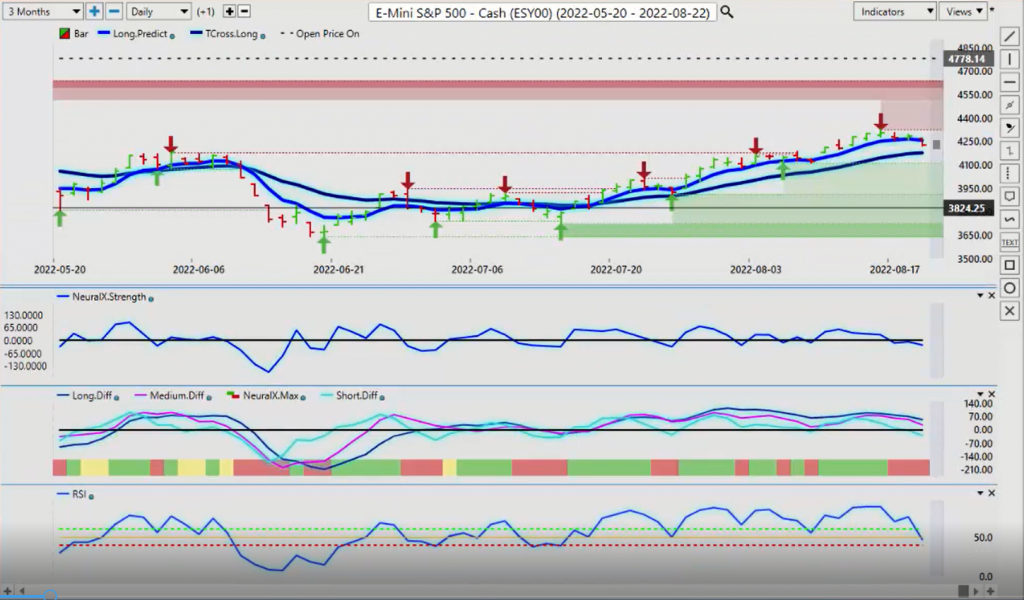
Let them do that, guys. The fact of the matter is there’s about a 90 to 95% correlation between Bitcoin and the S&P 500, the NASDAQ, and the Dow, all those global indexes. Right now I believe the S&P is lagging behind somewhat. I’ll show you this in a minute, is that right now the S&P has certainly made a valiant effort to hold these gains, but the T cross long at the very minimum is likely to be tested early next week, 4,173. Now, another way we can play this is we can straddle this. If you’re a strong equity buyer, then this is the level you would target. But I would also suggest that you stop a sell order sitting just below 4,173, and then cut your longs at that particular time.
The indicators are pointing lower in stocks. Our neural index strength, predicted differences, neural index predicted RSI falling. But now when we come back, we’ve identified that critical level, or if you’re simply a seller and you want confirmation that the S&P is going lower, then you would set up your shorts below 41. I would argue we lose 4,173, we close below it, then we are very, very likely to come down to test this 3,910 area. Now, there’s no guarantees in trading, but we can identify a very powerful level in the VantagePoint software at 4,173. Sell orders potentially around 4,169, 4,168. That’s another way you can play it. If you don’t want to hold the long trade, you can straddle that area and be prepared to go short.
Bitcoin
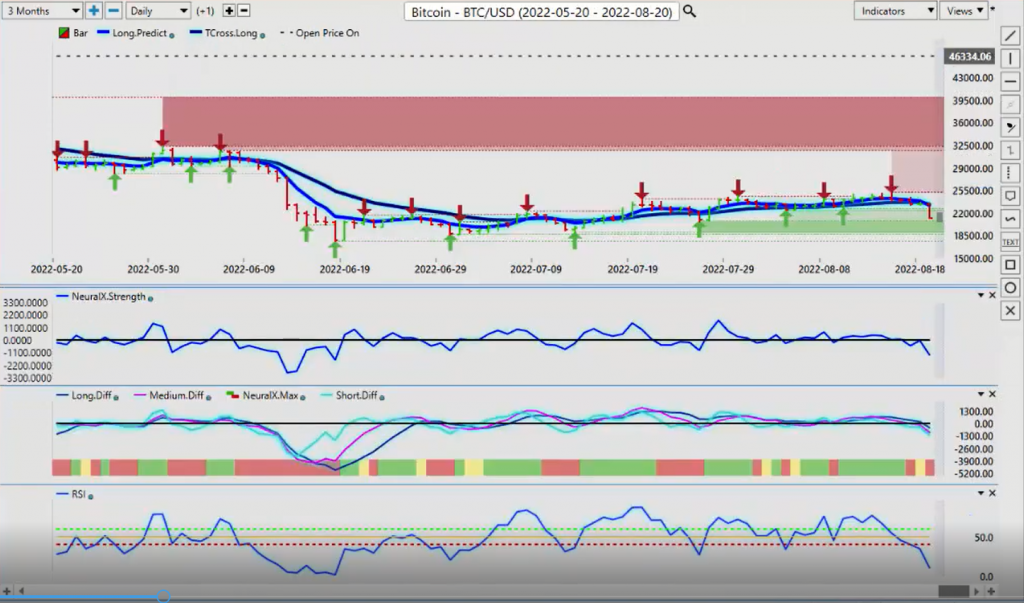
But looking at the direct intermarket correlation and leveraging, instead of criticizing like these media pundits continue to do, despite they ignore the annualized returns on Bitcoin, we leverage Bitcoin from an intermarket analysis standpoint and say, okay, I know that there’s been a 95% correlation between Bitcoin and the S&P 500, the NASDAQ, et cetera. Bitcoin’s made a move on Friday. That would tell me that the S&P 500 is likely to make a similar move early at the beginning of the week. As long as Bitcoin is holding below 23,455, then that’s warning us that the S&P 500 is likely going to follow very, very soon. But you’ve got some stubborn traders, hedge funds, et cetera, that are trying to keep those equity markets up, but they’re losing ground.
Again, if this is a leading indicator based on the intermarkets, this is telling me that Bitcoin is going lower in the short term. Like I’ve already talked about or discussed, there’s a very strong, seasonal pattern that begins mid-September. We’re a month away from that, guys. There’s plenty of room for Bitcoin to fall a bit further before we start looking closer at longs. But just remember, there’s a strong possibility that the stock market is going to follow next week.
Crude Oil
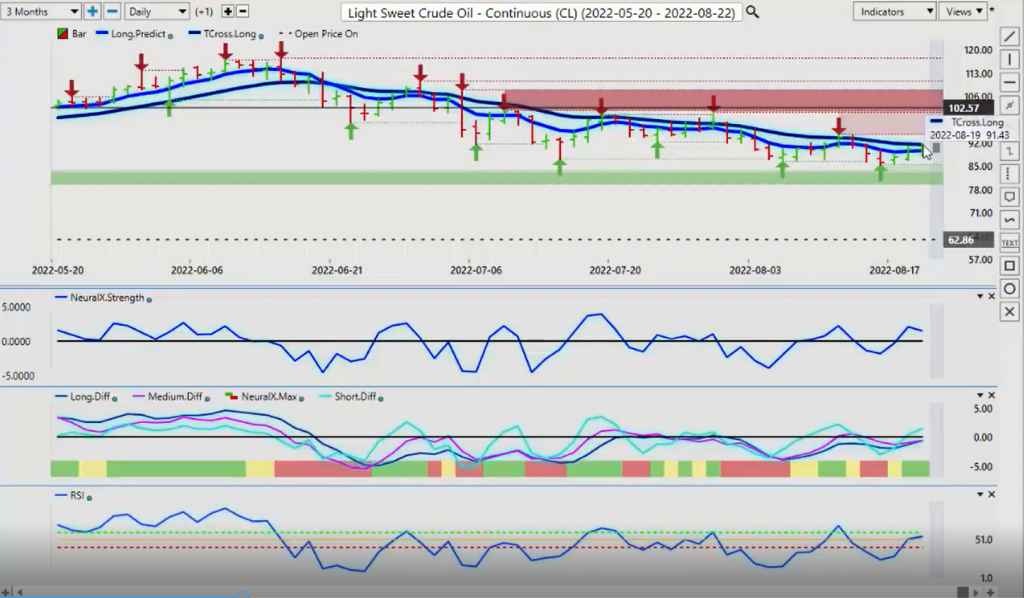
That would also spell more trouble for oil, light sweet crude oil. We remain firmly below the VantagePoint T cross long 91.43. Our neural index is a little bit mixed here, though. You can see that we’ve crossed over.
The neural index is up, and we were getting a bit of a relief rally. But this is what would be called a corrective bounce because we’re moving back towards the T cross long, but we’re not clearing it. You can see multiple other times that this has happened, many, many times this has happened, and it’s doing it again. But price continues to fall, right? As I talked about last week, some of the politicians are starting to job on this a little bit more, and that should technically lead to further losses in oil and hopefully it gives us all some relief at the pumps. But the neural index and the predicted differences, they’re in an interesting place. But again, the best thing we want to do here is just identify that pivot level of 91.43.
Again, if you disagree or you want to go long on oil, you could do the same thing, putting a buy order just above the 91.50 area. And if it breaks above it, you’re probably going to catch a pretty quick rally up to about the 94.49 area. But I’m not anticipating at that time we’re going to break through that particular level.
Euro versus U.S. Dollar
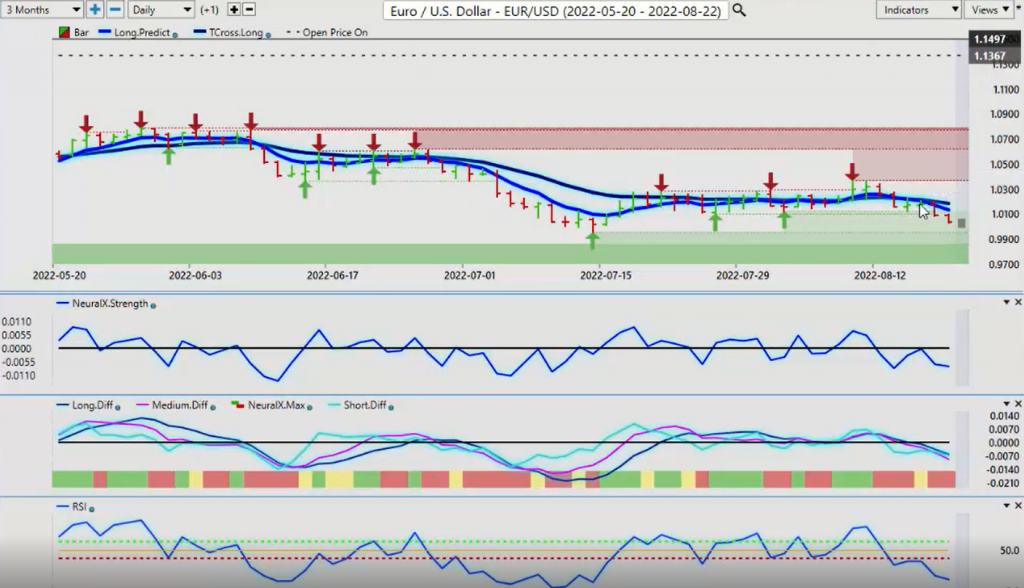
Now, as we go into some of the main Forex pairs here, once again, the intermarkets completely rolled over. We’ll be looking much closer, taking a much deeper dive into this in the VantagePoint live training room this coming week, and I’ll be showing what exact intermarkets rolled over that triggered this, but they rolled over on the dollar index and they rolled over short on the euro-US pair at the exact same time.
It started on end of day Tuesday. But by end of day on Wednesday, that was it. And then we had a massive move to the downside on the euro. Right now, I think we can all see this level of 99.52. I believe that that level could be breached this week and we may hit a little bit lower than that, maybe 98.70, 98.50. But long term period below parity on euro-US, I’m not convinced of that just yet. I believe that the euro will have a bit more of a relief rally before we really take a plunge. But again, right now, the main thing we do is identify our upside pivot areas, T cross long 1.0182, 1.0130 in the long predicted short while below those particular levels.
We need to take out this support level at 99.52. That would require, in my respectful opinion, it would require the dollar index to make a clean break of 1.09, and I’m not convinced of that either at this particular time. But I think 99.50 will at least get hit next week. This is not at the end of a rally here, guys. There appears to be some money behind this particular move.
U.S. Dollar versus Swiss Franc
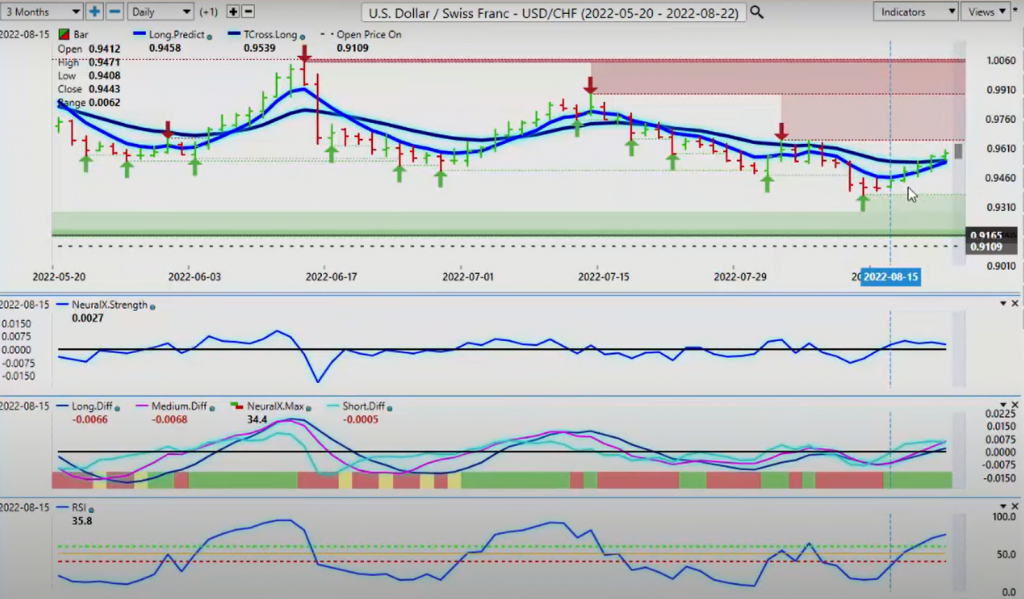
Now, the US-Swiss Franc, once again, that delayed fuse reaction that I discussed in last week’s weekly outlook, I could see this one coming a mile away. Soon as we didn’t break down below .9371, you can see there on Monday, we started to turn positive, didn’t get the Tuesday reversal that I talked about, and then we continue to extend.
Now, the intermarkets have not completely rolled over on this particular pair. We’re still dealing with this verified resistance high at .9651. I think that the market could take that level out next week and potentially target back towards the 98 level, the additional verified zone. We’ve got two days in a row we have closed above the T cross long. That is usually one of the conditions I look for for a reversal. Again, those conditions are met. We had a bit of a delayed fuse reaction as I’ve talked about. Again, we would be looking for if the dollar index can hold its gains. This is potentially a place of value to buy dollars.
British Pound versus U.S. Dollar
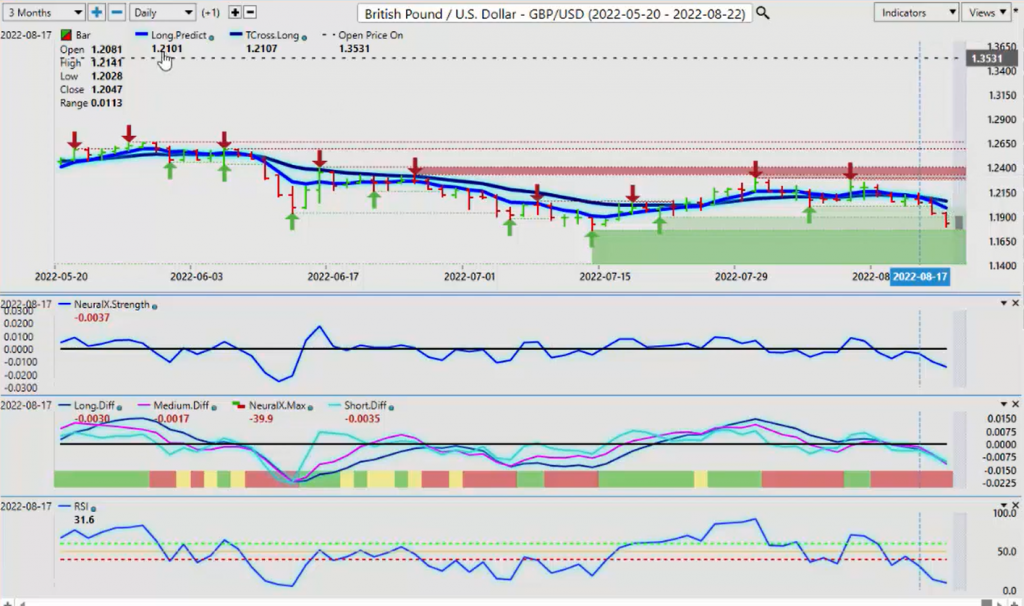
Now, with the pound-dollar, once again, illustrating that this is more than just a moving average crossover.
I’ve modified this to the long predicted and the T cross long for these presentations to focus on the key predicted moving averages and remove the black lines to remove any kind of confusion. These are pivot areas, and they’re both lining up at the… Pretty much they’re going to be at a similar 1.1989, 1 2061. All your stops on shorts would be above 1.2061. My gut tells me we’ve got a shot at the 1.17 level here on this pair. Things not looking great in the UK, recession, all those wonderful things, but we do have a verified support low, and that’s 1.1760. That’s the area I think we are going to immediately target. If we lose that level, then we really have to go back.
We really have to… I would argue we’d probably have to go back into the Brexit years to find a verified support, low down there. You can see I’m really… Okay, there we go. That’s down at the low of 1.1447. If we lose 1.17, make a clean break of it, then our next target is likely going to be down right potentially, I can’t believe I’m saying it, but potentially back down around that pre-post Brexit, around the 1.1440 area. Now, that’s a very tall order. I don’t think I’m willing to go down that particular path yet, but I will point out that this is a pretty big level here, 1.1760. And if we lose it, then you should be prepared for 1.1440. And that’s just a warning for anybody who’s trying to play the counter trend long. Be cautious is what I’m saying.
We are still in a channel here from July, if that channel holds. And also, a fair warning would be careful of a bit of potential bear trap down here. But I don’t necessarily think that there’s a bear trap in this particular case, because the technicals, the intermarkets, the fundamentals, they’re starting to add up to dollar longs here, or more specifically, they’re adding up to pound and euro shorts, and that’s where we’ve got to be careful. Keep an eye on that area, but the indicators are definitely bearish. Now, this past week midweek, I started to see a pretty nasty turnaround on the dollar-yen.
U.S. Dollar versus Japanese Yen
We found that support down here, that low at 131.73, then we started turning back up.
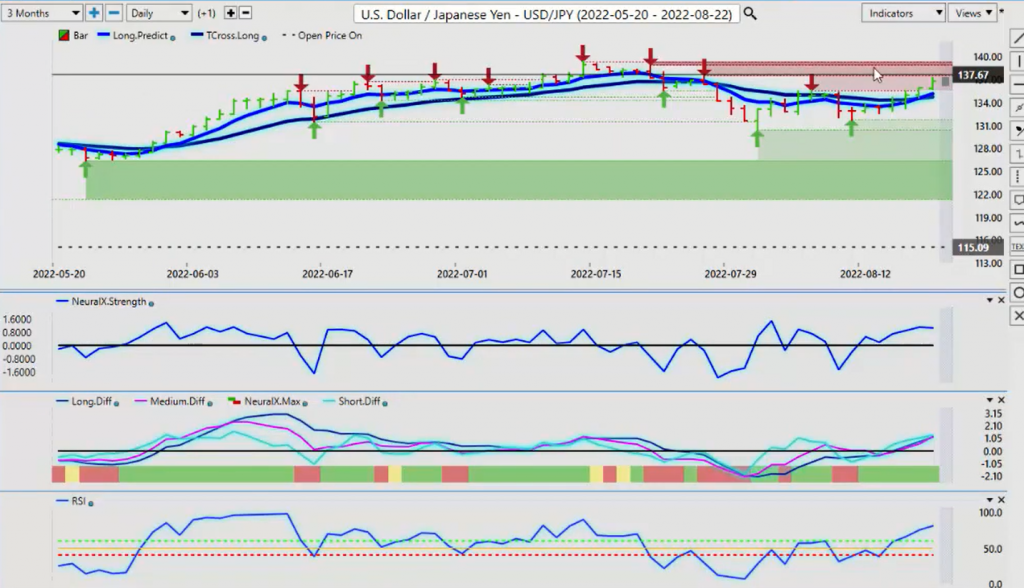
Once again, we’ve got our two day rule, closing above the T cross long and the long predicted. The reason I created these two predicted moving averages, which is the long term crossover minus the black line and the T cross long, which is part of the triple AMA cross that uses just the one longer term predicted moving average, so I can kind of line my ducks up in order here. This allows me to get a good visual. I’ve closed above both of them right here. And then you can see that led to a pretty sharp move. I still can’t get my head around these levels on this dollar-yen, but it would appear at first glance we are going back to the 139 area, maybe even a little higher.
But be on the watch for a potential short here also. If we can’t get above that 139.39, I will be looking for the VantagePoint indicators to roll over to the short side. I think it would be one heck of a short if we can get it. But once again, the neural index strength is a leading indicator. When it breaks above the zero line and it holds above that, you can see this little retest right there, and then we start moving up. But this is the money maker I’m looking for, my two day close, and then, boom. There’s no lag on this particular setup because it’s where the market closes in relationship to the predicted moving averages. It closes above it, we’re long.
Closes below it, we’re short. The two days rule just allows me to weed out some of the false signals or market, the Fed, the media, all these different things. But right now the dollar-yen appears poised to springboard higher as long as we’re holding above 135.18 and 134.78.
U.S. Dollar versus Canadian Dollar
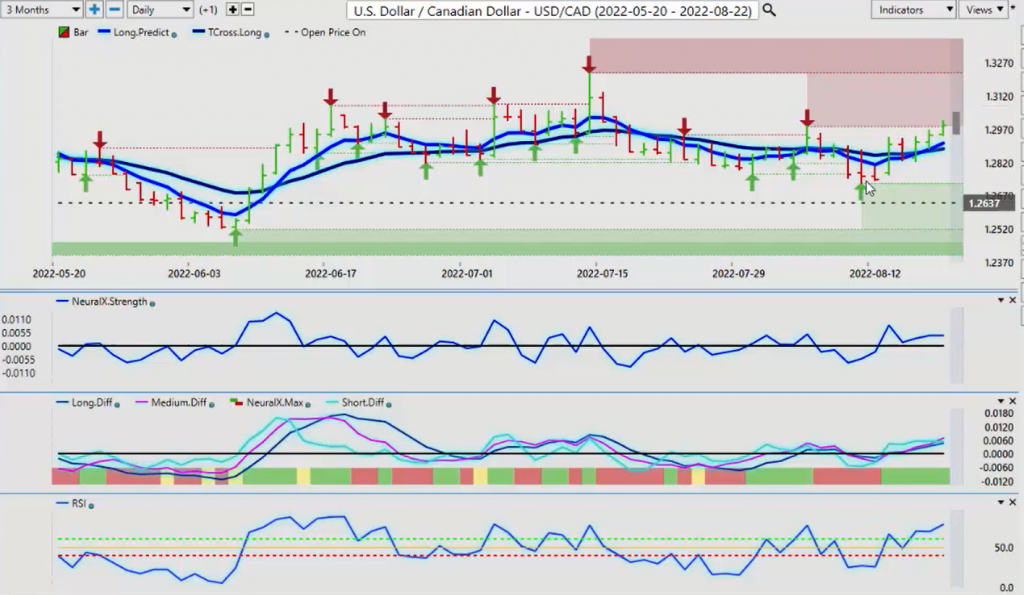
Now, as we come into one of my favorite pairs, one of the most frustrating pairs for traders to trade, is the US-Canadian, because the Canadian dollar is just a feeder fish off of the US economy. If the US is doing pretty good, usually the CAD’s doing pretty good too. But it really didn’t make a whole lot of sense why the Canadian dollar would be stronger than the US dollar at this time.
Our support low is holding. You can see this line down here, this dash line, that is the yearly opening price, a very, very important level for me. In theory, the theory is that while above the yearly opening price, it’s bullish, while below, its bearish. Now, we’re springboarding off of that. We’re extending higher. Little bit of a concern with this verified high rate here, 1.2984. I’ll be looking for that level to hold or to close above it and make that the new support level. But US-Canada is notorious for making a false move on Monday and reverse on Tuesday. And then on Wednesday, it goes back to the real trend. Be cautious with this pair.
But what we would be looking for is a snap move lower on Monday. We pick it up. And then on Tuesday, it reverses and goes back higher. That would be the ideal situation. But to break it down in layman’s terms were long while above 1.2882. And I would argue we’re long while above 1.2637. That’s your main yearly opening price. And as you can see, we have been above it for quite some time now, going all the way back into early June, we’ve been above this yearly opening price. If equities tank, that’s going to hurt the Canadian dollar. All things are pointing to the S&P selling off next week or going lower even. That is what will push US-Canada higher.
If we have oil prices that are failing, they’re starting to move lower, that will push US-Canada higher. The only thing that can save the Canadian dollar is a reversal to the upside on oil and on the S&P 500. Anything else will send this pair higher. Now, with the Aussie and the New Zealand, they’re very, very much US-CAD trades, just inverse. US-Canada goes up, Aussie-US, New Zealand-US, they go down. Once again, on Wednesday, we’re starting to get a confirmation from the correlated markets and the inversely correlated markets, then we get further confirmation on Thursday and we’re, boom, down we go. But what we can assess here, the neural index strength is a very, very powerful indicator because we can see it in a line based form with a zero line.
When it crosses over the zero line and it stays below it, and when we have our MA diff cross, our medium term trend weakening against our long term trend, that is signaling to a degree of at least 85%. The market is getting ready to move in that direction. Potentially at a faster pace, that’s exactly what it’s doing. Only point of concern is this low, .6870. But I would assume if we get that sell off in the S&P, then we would be looking at targeting .6746. Excuse me, .6681. You can see the low there. That goes back to August the 14th. Basically we’re just coming back to where we were, but you can see how they can kind of try and fake you out here by moving higher.
Australian Dollar versus U.S. Dollar
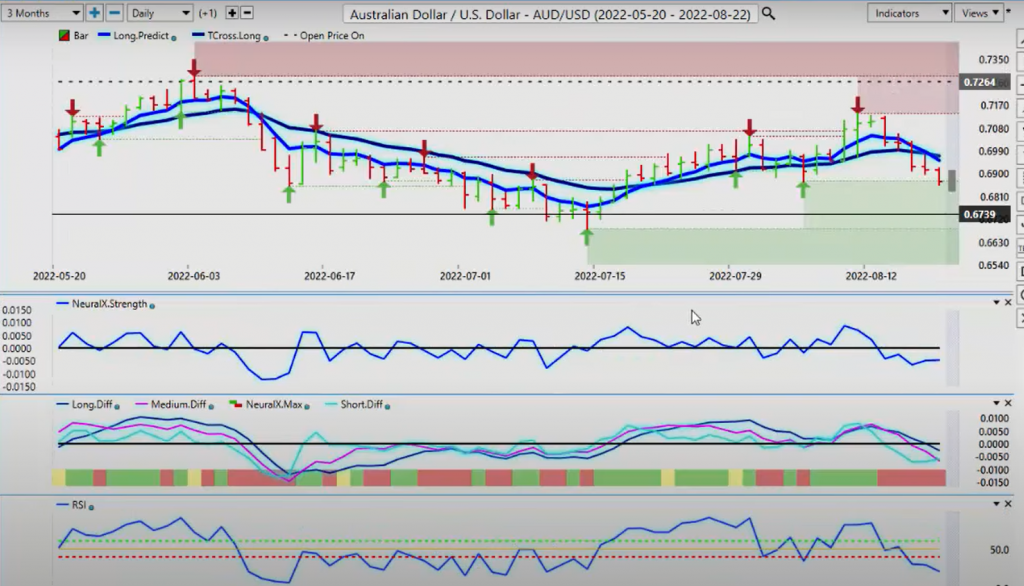
As soon as Aussie-US moved near that yearly opening price of .7264, that’s just basically repellent. It lingered there for two or three days, and then immediately turned back down. Obviously big money is sitting up there waiting.
New Zealand versus U.S. Dollar
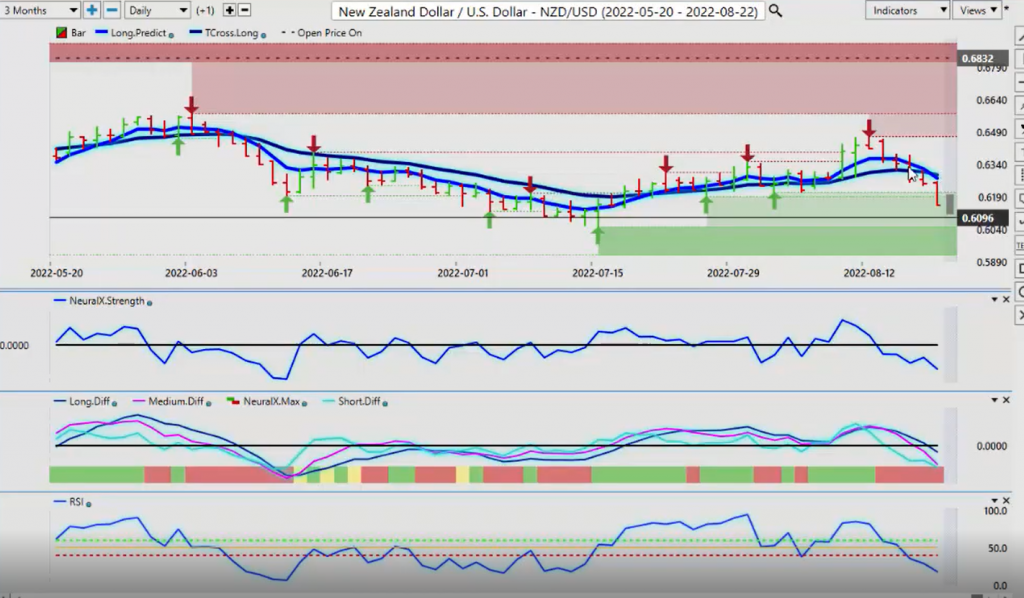
I would argue they’re doing the exact same thing with New Zealand, but you can see that the yearly opening on New Zealand is much higher, .6832. But once again, you’ve got that neural index strength where we get an internal view of the neural index and we can see it breaking down. The medium term crossing the long term predicted difference with the neural index going red, predicted RSI falling, but the intermarkets coming on board back on Tuesday and Wednesday.
That was what I was watching, the direct positive and inverse correlated markets. Soon as they came on board, down we went hard. I don’t think that this is done yet here, guys. I don’t think the downside on the S&P 500 is down, because the Fed is getting quite vocal. Quite frankly, I don’t blame them because the media keeps spinning things. In the VantagePoint blog, I’ve discussed it in the room. I don’t know who the person was that wrote the VP article, but they’re saying the media now is actually trying to redefine what the definition of a recession is. It’s an excellent article. Always make sure you’re looking at the VantagePoint blog. There are some fantastic articles being written in there.
I think the last several articles were spot on. I couldn’t agree more. With that said, this is the VantagePoint AI Market Outlook for the week of August, the 22nd, 2022.