


Welcome to the Artificial Intelligence Outlook for Forex trading.
VIDEO TRANSCRIPT
Hello, everyone. Welcome back. My name is Greg Firman, and this is the VantagePoint AI Market Outlook for the week of June the 7th, 2021. Now, to get started this week, we’re going to begin again with that very important U.S. dollar index. Now, just a quick note here, this is a weekly outlook. It’s a condensed version from what we do in the VantagePoint Live Training Room. Of course, in this particular weekly outlook, we look at commodities such as oil, Bitcoin, gold, and a correlation they have to many different currencies and other markets, and we do this on a weekly basis. I will take that one step further this week.
U.S. Dollar Index
Now, when we look at the dollar index, as I had stated about two weeks ago that the dollar would strengthen around the May the 28th. That has come to fruition. We can see that the dollar has moved higher based around these institutional cycles. Now, these institutional cycles that I’ve talked about in the Forex market currently, about $6 trillion a day is what the volume the Forex market is and it’s dominated by large institutional funds, not impulse buying impulse, selling waves, this kind of stuff, but real institutional liquidity needs to buy dollars between, basically what I had stated, May the 28th up until about the 10th of the month. And then mysteriously, very often, by Tuesday or Wednesday after the non-farm payroll number, the dollar again mysteriously sells off and it catches most people off guard.
Now, that signal is there. 75% to 80% of the time, there is no institutional cycle in the months of July and August. That’s usually when we see that seasonality of gold start to surface. When they’re not buying dollars, they tend to be buying gold. Now with gold, there’s a number of currencies that are attached to that. If gold is strengthening, the Japanese yen is strengthening, so is the Swiss franc, but more specifically the euro currency.
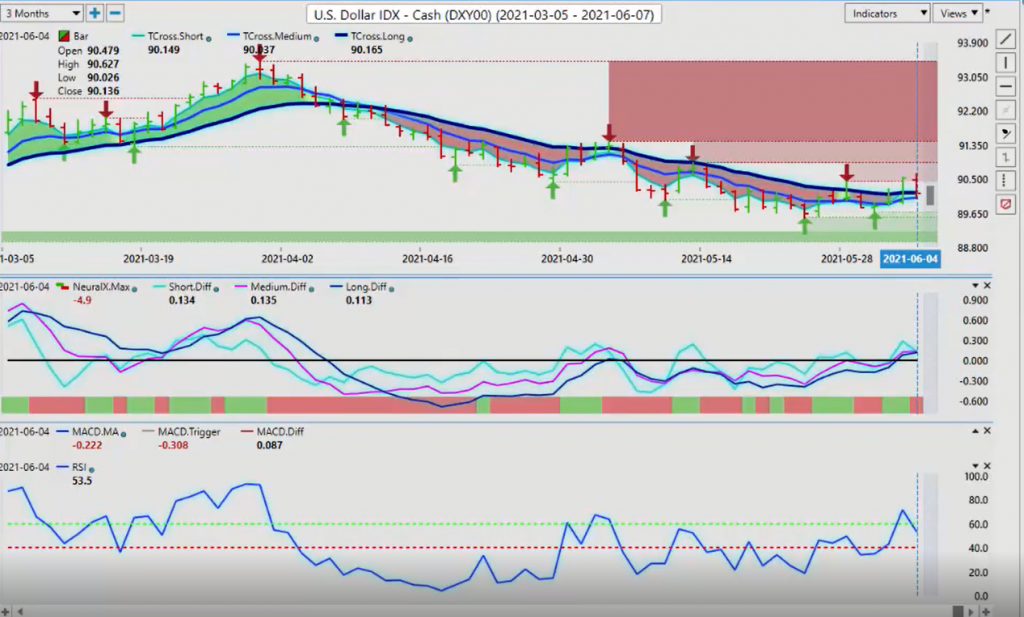
So when we look at the dollar right now, we have approximately four main levels of verified resistance that goes all the way up to the high of 93.43. We then come down to an additional verified high at 91.43. Then, we have this one here, very important, high at 90.90. But this is the one we want to keep our eye on, right here at the 90.44 level. Now, if we cannot break above this level and hold above this level, the dollar will come back under pressure yet again. This is, again, has come to fruition 75% of the time the week after the non-farm payroll, and that’s regardless whether the number is good or whether it’s bad. That’s simply something that I’ve noticed.
I’ve pointed out there’s been several significant articles written on this by Goldman Sachs and several other large firms that monitor institutional liquidity at this time of the month. We want to base our trades on science, not on something from the 19th century or 16th century. We want current. We want inner market correlation. So when we look at this right now, the key VantagePoint level is 90.16. We need to hold above that. The predicted differences measuring two separate trends at the same time, they’re above the zero line, but again, we have a reverse check mark on the predicted RSI and it’s starting to push back lower.
So when we look at the dollar index through the eyes of science, we look at inner market correlations. This is what the dollar looks like inside of a neural network. We have the dollar index, very high correlations or inverse correlations. In red, the Japanese yen, the Swiss franc, gold, light sweet crude oil, New Zealand, S&P 500 mini, British pound. Again, trading on a strategy, you must apply some type of science because, again, this will lead to many other possible trades.
When we look at on the U.S. stock side, these are, again, markets that are correlated or inversely correlated to the dollar index. On the ETFs side, we can identify. And more specifically, the Future’s contracts are the ones we really want to watch. So if we look at commodities that are tied to currency, obviously gold is at the top of that list, light sweet crude oil, and then some of your risk-off currencies like the yen and the Swiss franc.
If we go further with this, and again, if we ask the neural networks a very specific question, how big are these correlations, we can narrow it down on the monthly timeframe. We can see on a month-to-month basis, these are the markets that have the highest positive correlation and the highest inverse correlation. If we look at it on the quarterly, we can see it again here a Swiss franc, we’ve got Gold Miner Bear 3X, U.S./Canada, U.S./Brazilian real. There’s a number of different markets on the inverse correlated side. Again, if it points to additional trades, this is the benefit and the power of inner market technical analysis.
Now, again, we still need to hold above this key levels on a very mixed signal. But again, if the dollar can clear and stay above this high of 90.44 and continue to push above 90.90, then the dollar can maybe turn around. But the probability of that in the next few weeks is very unlikely unless we get a hot. We do have the U.S. CPI number. The U.S. non-farm payroll number was a decent number, but in my respectful opinion, not enough for the Fed to move on tapering or anything else. I think they’re going to stand put. We’ve got a very vindictive Fed this time, in my opinion.
And Powell, he doesn’t like it when people question his methods or his work. And I think he’s going to dig his heels in here and say, “Nope, that labor report is exactly consistent with our forecast and we are not even looking at raising rates or tapering, which should overall, by midweek, weaken the dollar.” Now, what you would watch in your Forex trading and commodities tradings alike when you come into the market on Monday, if the dollar is a big rally on Monday, that’s pretty much to tell that it’s going to sell rate off on Tuesday and Wednesday and probably the rest of the week. But if it comes out very bearish, then the market could actually be buying dollars. But the thing is, there’s always that reversal from Monday to Tuesday.
The key thing is to know your levels, and these two levels right here, you can see after we got the ADP report, that news pushed the market up above that key verified zone, only to turn around and drop back down on Friday and close below that key level. So again, if we follow institutional money, not impulse buying impulse, selling, we don’t want to follow retail traders here, guys. We want to follow the institutions. In the Forex market, it’s very different. In the currency future’s market, it’s very different than stocks where these orders… It’s a decentralized exchange. These big orders come in. We always want to follow smart money, not impulse money.
Gold
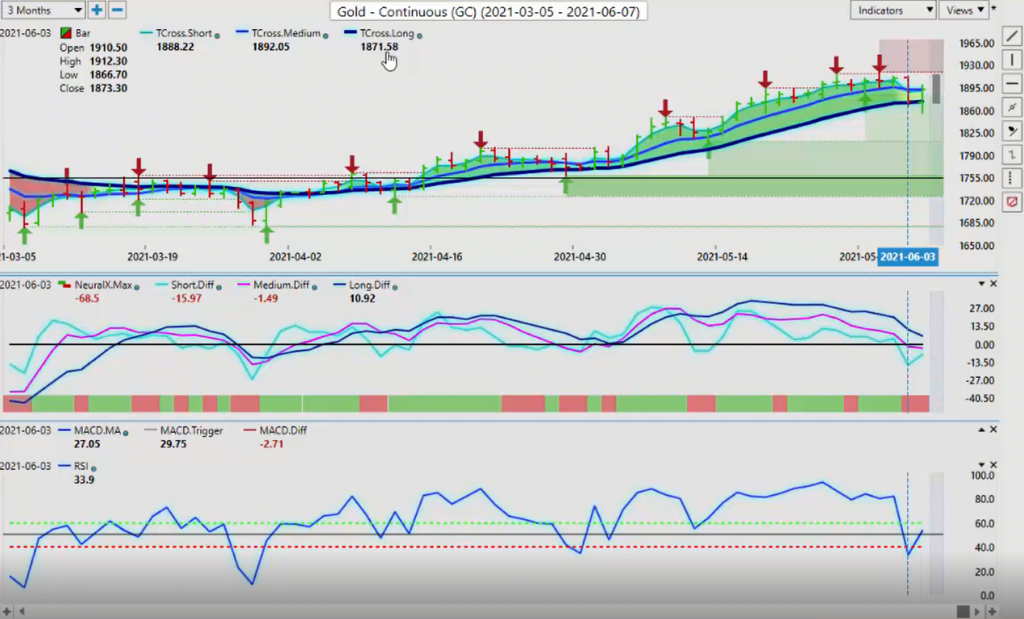
Now, when we look at this, do a comparative analysis between the dollar index and gold, we can see that gold actually sold off on that ADP report. But in my respectful opinion, it’s not a coincidence that it stopped exactly on the TCross Long, this critical VantagePoint predicted moving average, that level coming in at 1871. And then, we’ve rebounded off that on Friday.
So once again, when we look closer under the hood of how a neural networks look at these markets, we can say, “Okay, well, there’s gold. And we can see that there’s that positive correlation to the Japanese yen. We’ve got silver, light sweet crude oil.” And again, when I’m looking at gold… This is a condensed weekly outlook, only running about 15 to 25 minutes each week. It’s just a condensed version from the Live Training Room. And again, we are looking at commodities in comparison to currencies. We always have. Maybe a few of you have missed that, but gold is a big player in the currency market as to which currencies will move when gold does. So some of those that will move will be, again, the Japanese yen, the euro. You can see the euro directly connected inside the neural networks to the euro contracts, gold and the euro.
I would argue at this particular time, what I’m saying is I’m seeing a positive correlation between the dollar index in Bitcoin and a very strong correlation between the euro and gold. So in short, you’ve got a battle going on in two different camps here, the dollar in Bitcoin in one camp, euro and gold in the other. So again, as we move into summer trade in July, in most cases, the dollar does not fare very well at all. I think some 20-some odd years, gold has bottomed out in the month of June. So there’s a very high probability that, again, gold will extend higher and the dollar will not.
But again, when we look at these correlations and we break them down, we can see on a yearly basis, a quarterly basis, or a monthly basis, you’ve got Gold Shares, COMEX New York Gold, Market Sectors/Junior Gold Miners, Yamaha Gold. Inversely correlated to that, we have a number of different stocks in here. And if we break it down to a month or a quarter, we can see all of those other pairs. And again, you can see that Bitcoin having an inverse correlation of 92.76% to those gold contracts to solidify, based on science, what I’ve just said.
And again, a lot of the indicators that we see out there, the trading methodologies, they really are quite antiquated compared to the new algorithmic systems that are in the market that enter orders at the speed of light. It’s very, very new technology. Inner market technical analysis doesn’t point to one trade. It points to potentially 20 or 30 trades, both with that particular market and against it on the inverse side. So for gold right now, our key level to watch this week is 1873. Our neural index is down, but this reverse check mark is telling us we have very little downside momentum on gold at the current time. But keep a very close eye on the dollar index and gold contracts.
S&P 500 Index
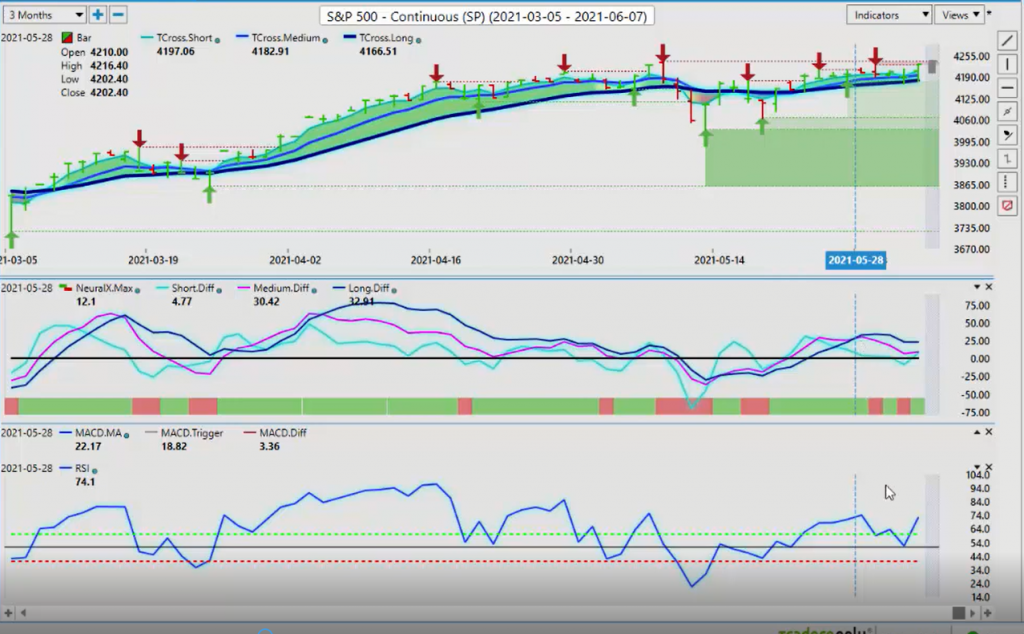
Now, as we look at the S&P 500 going into next week, once again, with the S&P 500 as the dollar weakened, even after Thursday’s move with the ADP report when the equity sold off, Thursday, they paused rate on that 18-day predicted or their TCross Long, excuse me, at 4174, bouncing off that and accelerating higher, but we must clear this level right here, guys. We’ve got to get through this 4236 area or the risk of a sell-off is always there. Our medium-term crossing our long-term predicted difference is a little shaky at best, but again, that reverse check mark, you can see, I’ve drawn a 50% line on the predicted RSI. We’ve come down, hit it right to the number and accelerated over the 60 level telling us that we have some upward momentum still in the global stock markets.
Crude Oil
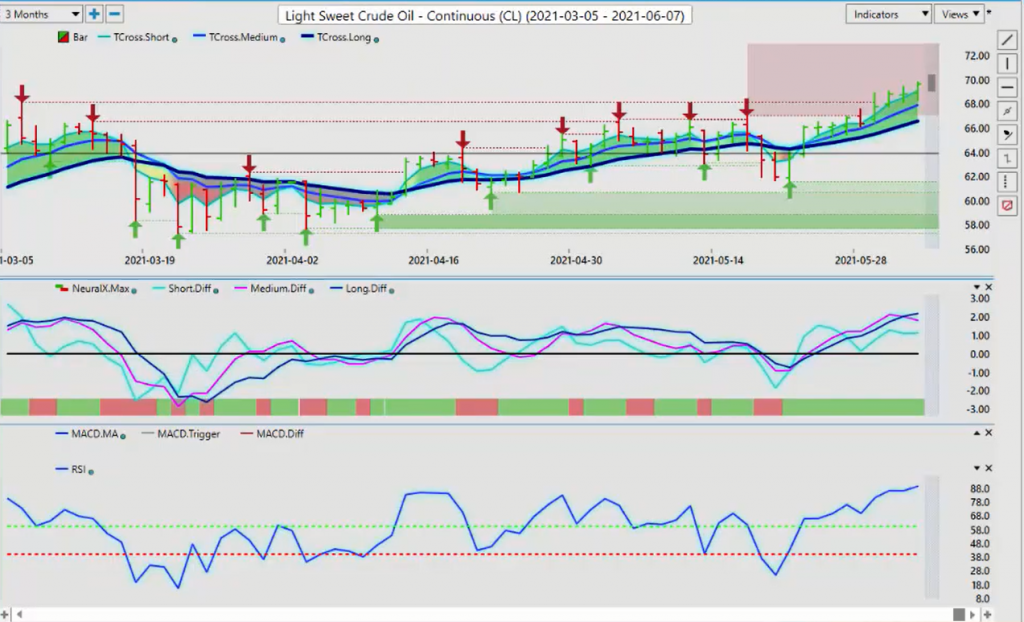
The same thing would apply to oil, a very strong commodity here that, again, is tied to the Canadian dollar. It’s tied inversely to the U.S. dollar, but it mainly follows its move off of stocks. So stocks advancing higher and we can see that oil absolutely jumped on board on that particular rally and it’s gone higher. So when we look at this right now, the theory here with advanced inner market technical analysis is that, again, if the S&P 500 can advance, then oil would advance with this.
So if we look a little closer again under the hood of these particular markets from what a neural net actually looks at with light sweet crude oil, the dollar index, RBOB Gasoline contracts, of course, Dow Jones Industrial Mini, heating oil, Japanese yen, gold, again a commodity, the euro is correlated to that, Brent crude, 10-year Treasury notes, natural gas.
When we break it down into finer points, we can see the actual number of that correlation. Again, this is science-based, guys. This mark, the market you’re trading is being moved by these markets, not by impulse buying and selling and retail traders. Institutions are moving their money back and forth, in and out. And what we want to do is track real money and what markets they’re going into and what markets they’re using to drive the market that you’re actually trading. So the inverse correlation on here, you can see all of these different markets, and that is the theory behind that or the correlation. What it tells me, what I’ve learned from the VantagePoint software is that oil and the S&P will likely head up together, but gold is still a player in those particular markets. Excuse me.
Bitcoin
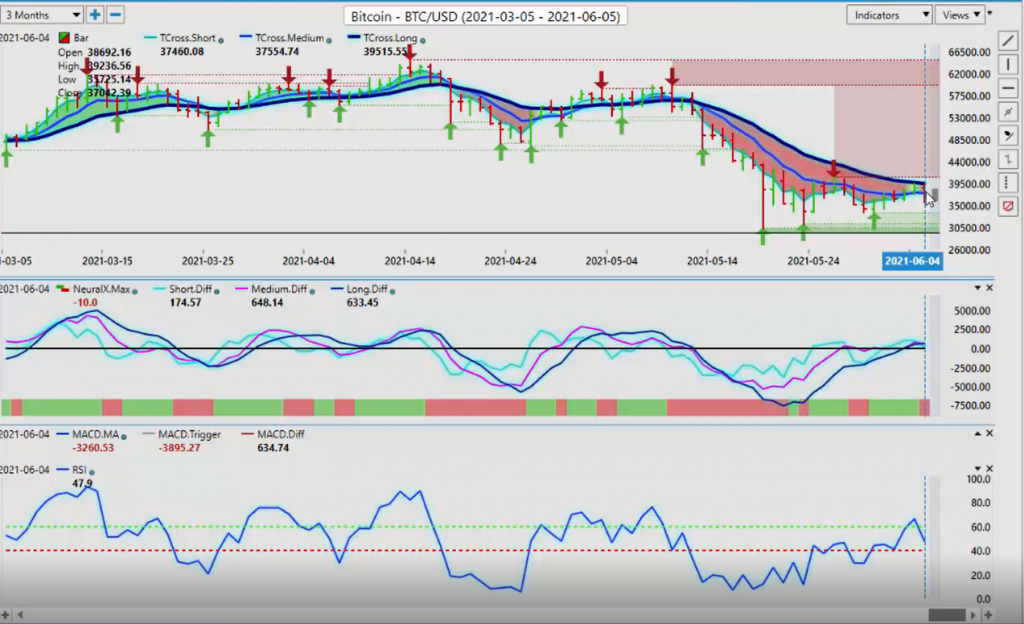
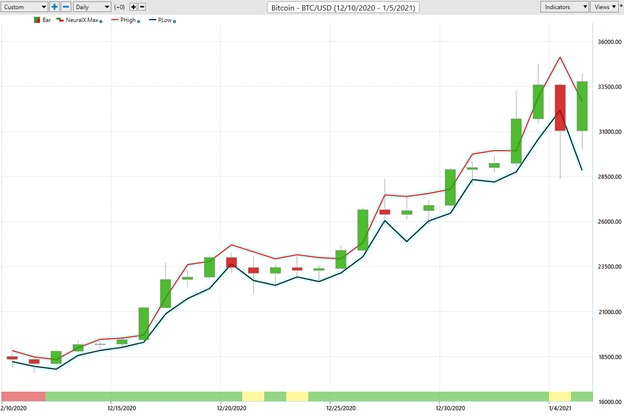
Now, again, when we look at this from last week, Elon Musk, again, making comments, but he’s becoming less and less relevant to anything related to Bitcoin. Now, with the dollar down, we can assess here that, again, Bitcoin is down actually with the dollar even though it’s trading against it. They both appear to be moving up and down together. Dollar is sold off at the end of day on Friday, so did Bitcoin. Once again, I will remind everybody that, and I don’t agree with this, that Bitcoin’s Coinbase is trading over the course of the weekend and we’re getting these big gaps in price. I am not a fan of that at all. And as you can see, potentially, this is where regulation will be beneficial. But for now, Bitcoin, holding under 39515. So again, we’re looking to see if Bitcoin can push above that. We have a verified resistance point rate here, that high for 40771. We need to break through that.
And again, the VantagePoint TCross Long sitting right at that particular level, our predicted difference is above the zero line. But once again, that reverse check mark, very dangerous when I’ve seen this. Many points, just looking at this particular… Because again, this is a modified RSI using a 60-40 split, not used for overbought or oversold or accumulation. It is not used for any of those things. It’s simply there to show us momentum, a break of the 60 or break of the 50, then a break of the 60, very high momentum. But trading off of overbought and oversold, I think that technology has gone out with the 70s and 80s. It’s a momentum based market here, particularly asset classes like digital currencies like Bitcoin. So again, if we can take out that critical level, move up above there, then Bitcoin will likely start to recover.
Euro versus U.S. Dollar
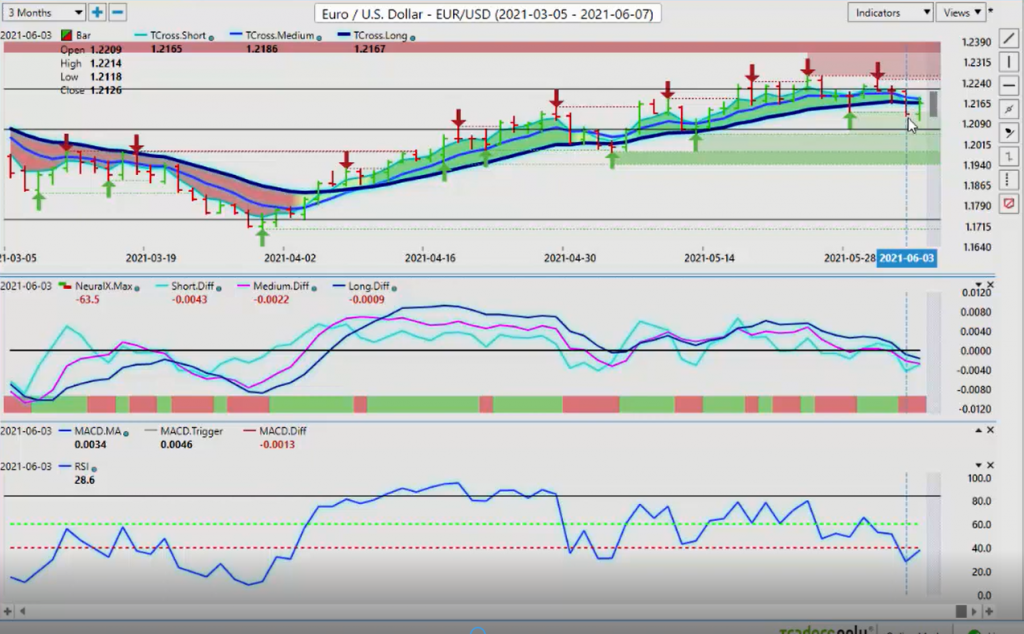
Now, as we start to move into our major currencies, once again, with the Euro/U.S. pair, I have discussed this at length, the yearly opening price, 1.2340. I’ve had my own direct clients selling into that area and then buying off the VantagePoint TCross Long. This previous week, we’ve largely moved back and forth between the TCross Long and the yearly opening price. But as you can see, after that ADP report on Thursday, it pounded the euro down with gold dropped the same amount, but both have recovered. So what we’re looking for now is, can the euro recover from here? We’re in a period of known dollar weakness. The only thing that could change this, again, is that CPI number coming out next week. But I will hold my ground that that unemployment report, in my respectful opinion, was not bad. It was okay. There was parts of it were bad and parts of it were quite good. The U-6 number was good. That’s the number I watched, the broader unemployment. Labor rate participation, I believe, was pretty decent too. So there’s still a lot of strikes against the euro.
One of the main arguments I’ve made is between the euro and gold that I question whether either one of those two would have made it to the level they did without the COVID meltdown in March of 2020. I’ve shown the exact day. The Fed, March the 15th, 2020, emergency rate cuts sent gold and the euro through the roof. Well, there’s not going to be… Rates are, in my respectful opinion, are starting to bottom here, so that could put a top pretty soon in the euro, and it could put a top in gold also. But again, I don’t think we’re going to see that until August, September, because these are not strong months for the dollar going forward. But again, knowing your levels is critical.
When we look at this right now and knowing those inner market correlations, if we break this down and we look under the hood of the euro, what is really driving the euro? It’s not waves, it’s not this, it’s not that. It’s institutional buying and selling and global correlated markets. Even if we look at the S&P 500, the reason, guys, that I show the S&P 500 and not the DAX 30 and the Dow Jones Industrial and the Nikkei and all these other stock index is because they’re all 80% to 90% correlated to each other, so it would be a redundant analysis. Most eyes are on the S&P 500. It’s got medium volatility versus the Nikkei 225 and the Dow Jones Industrial, so I’m not going to complicate the analysis. I’m going to just look at the one global index, which is the S&P 500, and I can see how all the individual stocks are going to be doing based around those forecasts.
But with the euro, again, we see a strong correlation to these different markets. The dollar index is inversely correlated. Gold is in there, the correlation. If we look at the ETFs side, you can see Gold Miners. On the Future side, I can highlight it that way. U.S. stocks, TC Energy, air lease. There’s a ton of markets that the average person would never be able to figure out without actually having neural networks to be able to pinpoint these correlations.
When we break that down on a percentage basis, once again, the euro futures obviously has a 99% correlation to the Euro/U.S. pair. You are trading the euro futures whether you like it or not. You can see a number of stocks. Apple, 88.63, positively correlated to the Euro/U.S. pair. Inverse correlations are all stacked up down here, the dollar index, 99.59. If you’re trading the Euro/U.S. pair, how could you not want to look and do analysis on the dollar index or on gold or on the U.S/Swiss franc. The list goes on and on, but the highest the neural networks are able to find those high correlations.
So with the euro forecast, we need to get above this yearly opening price, and very, very soon at 1.2240. If we cannot clear 1.2240, then there is downside risks to this particular pair. As I’ve already warned, just be careful of false breaks up above 1.2240. We can see multiple. This could be argued two ways, that these are all false breaks or bull traps or it also could be interpreted that somebody is knocking on the door and it’s just a matter of time before they kick that door down. So you get a soft CPI number next week. That would likely be the catalyst for Euro/U.S. longs. But if it’s a weak number, it would be the catalyst for the longs, excuse me, and a strong number would send the Euro/U.S. and gold contracts lower.
British Pound versus U.S. Dollar
Now, as we look at the pound/dollar for going into next week, the pound, again, just continues to shake off the dollar strength. That’s largely because of its correlation to the Euro/Great Britain cross pair. With Brexit now, that Euro/Great Britain cross pair plays a big part in what happens between Euro/U.S. and Great Britain/U.S. We remember from years ago that essentially these two pairs would move together, Euro/U.S. and Great Britain/U.S, but that’s not really the case these days. Euro/U.S. going up, Great Britain/U.S. going down, and vice versa.
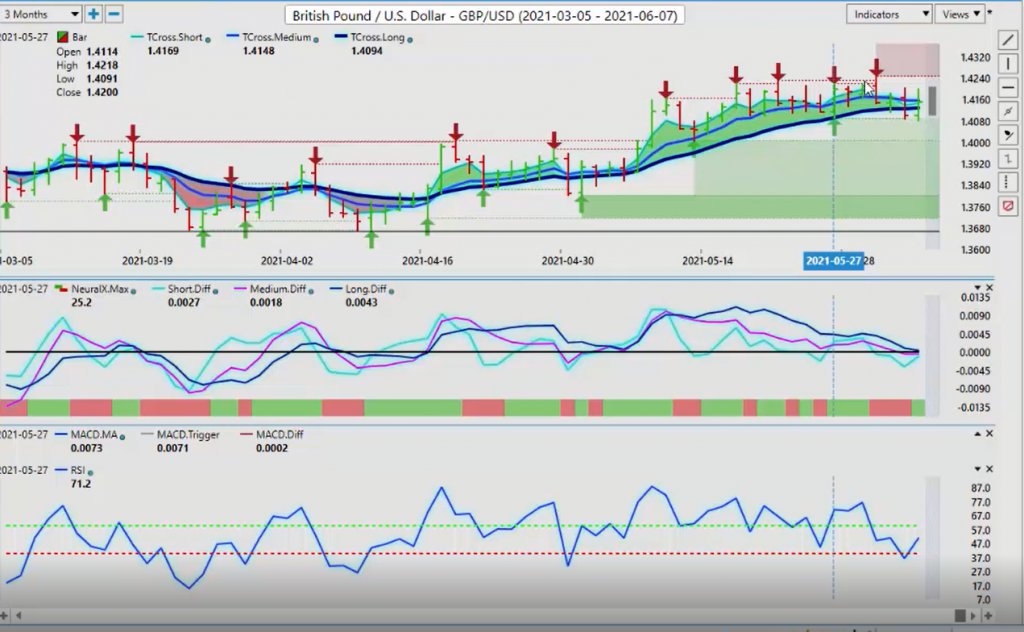
So for now, this key level is 1.4129, which we’ve closed above. But this verified support low at 1.409 is the one to keep a very close eye on. And again, heavy resistance at 1.4240. I’m sure that just about everybody on this planet can see that verified resistance up at 1.4240, but that doesn’t mean it’s not relevant and it certainly doesn’t mean it’s just an easy short trade. The pound/dollar has been above its yearly opening price for the entire calendar year for the most part and it’s been very, very bullish.
So again, when we look at it closer here and we actually pinpoint in this January level here, we’ve had multiple retracements exactly to the yearly opening price and it’s rebounded every single time. So yes, we’re slightly overextended, but I also feel that ultimately the pound/dollar goes higher. It will likely just take a bit of time. But the first step is we want to make sure that we’re holding above the Low at 4091 and the indicators are positive. This reverse check mark on the predicted RSI, we’ve managed to, again, holding at the 51 level on the RSI suggesting we’re still going to advance.
U.S. Dollar versus Japanese Yen
Now, with the dollar/yen going into next week, the dollar/yen is going to be highly affected by gold contracts. So again, if you’re trading the dollar/yen, then focus on what the dollar index is doing and what gold contracts are doing. If gold contracts strengthen, the dollar/yen is going lower. We formed a new verified resistance high at 110.20. We’ve hit this three times rate after the ADP report. We’ve hit it again after the non-farm payroll number, only to sell off, but you’ll notice we stopped right on the TCross Long at 109.38.
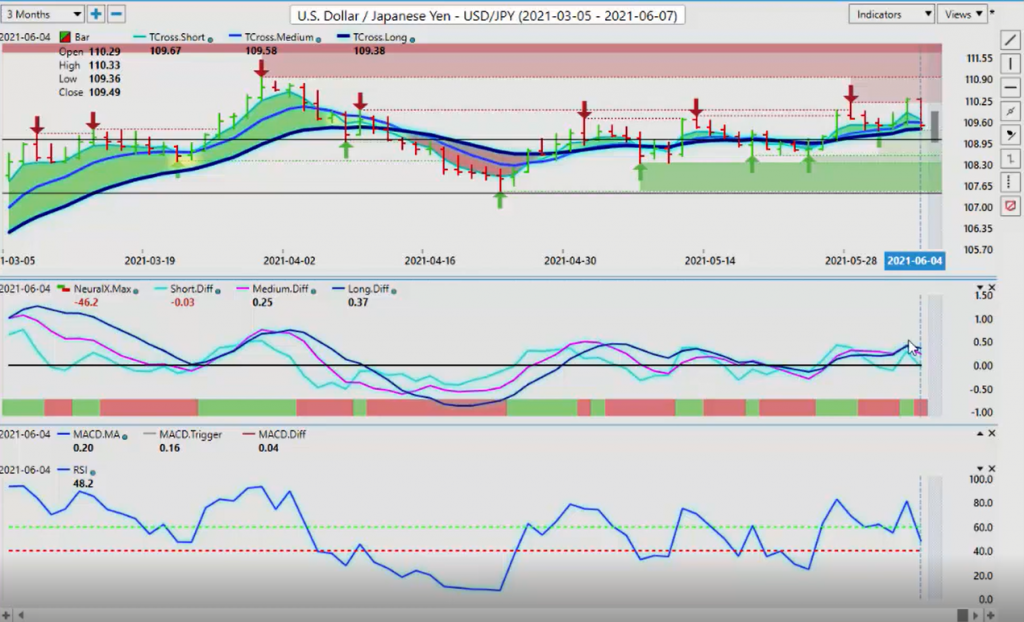
We have our medium-term crossing our long-term predicted difference. Once again, suggesting their gold could be getting ready to make a move here in the dollar index tanking because, again, we’ve already experienced the dollar strength from what I originally suggested from May the 28th and usually that runs until about the 10th of the new month. And then, that’s it. And then mysteriously, it sells off. If that’s the case, then dollar/yen could be getting ready for a bigger move. But any shorts, I would still suggest we target as close to 110.20 as possible and be very cautious around 109.38.
U.S. Dollar versus Canadian Dollar
Now, with the U.S./Canadian pair, another poor job is reported of Canada. This is where fundamentals become very skewed because, again, oil prices are strong, equities are strong. That supports Canadian dollar longs. That indirectly support shorts on U.S./Canada. So as long as commodities are strong and equities are strong, you’re going to continue to see the Canadian dollar likely advance, but we have heavy verified support building up around this 1.2012 area. If we break through that 1.2012 area, you can pretty much take it to the bank. We’re going to hit 1.1917. And at that particular time, we would likely see the Canadian dollar turn around as we start moving into the end of summer.
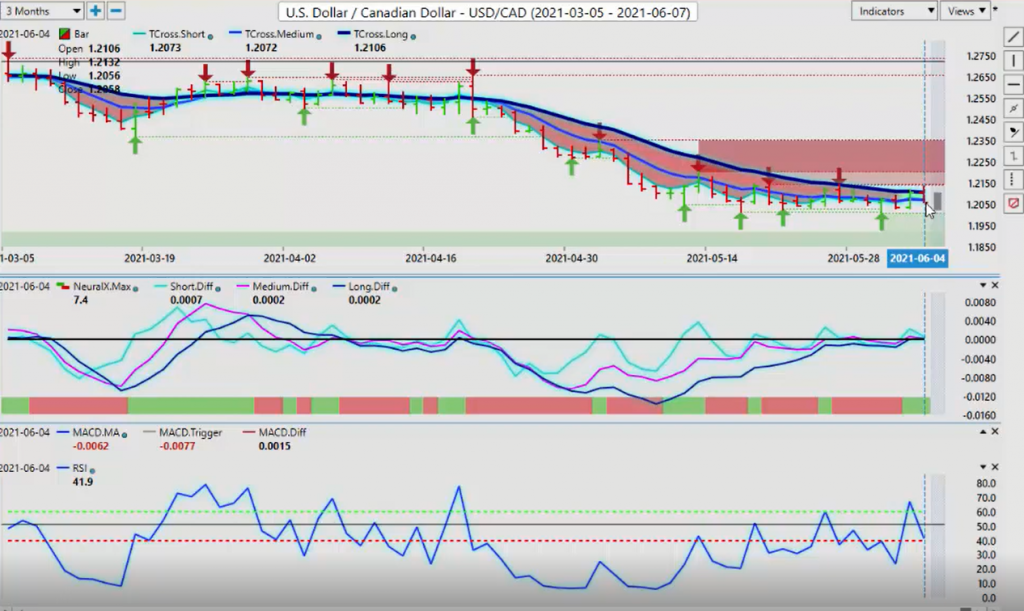
But there is still downside risk here. VantagePoint indicators, the original sell from back here… I don’t usually like to do that but it was such a good sell order after the break here that it is worth mentioning that this original sell signal from VantagePoint came at the 1.26 level, and we’re now 600 pips lower. So on a single contract, guys, at 6 grand, that’s a pretty good chunk of cash. So now, this week, 1.2106, this is the level we need to watch. As long as it’s holding below this level, shorts are absolutely still in play. A reverse check mark suggesting we have very little upward momentum here, and the Canadian dollar is likely to benefit from further U.S. dollar weakness.
Australian Dollar versus U.S. Dollar
Now, the same thing would apply to Aussie and New Zealand. Very similar trades here. Again, we’ve rallied all the way down on Thursday on the ADP report, then rallied all the way back up on Friday. This is buy the rumor, this is sell the fact. And again, with the yearly opening price at the 77 level, that’s the level you want to watch to begin the week. The VantagePoint indicators are a little bit mixed, but the neural index, which again, is applying 31 other markets in the target market. So when we look at that Aussie currency, you can see, once again, the Aussie futures contract, Aussie/Canadian pair, Ritchie Brothers, there’s platinum metals. Then the inverse side of that, you’ve got SunOpta, U.S./Japanese pair. This is, again, science-based trading.
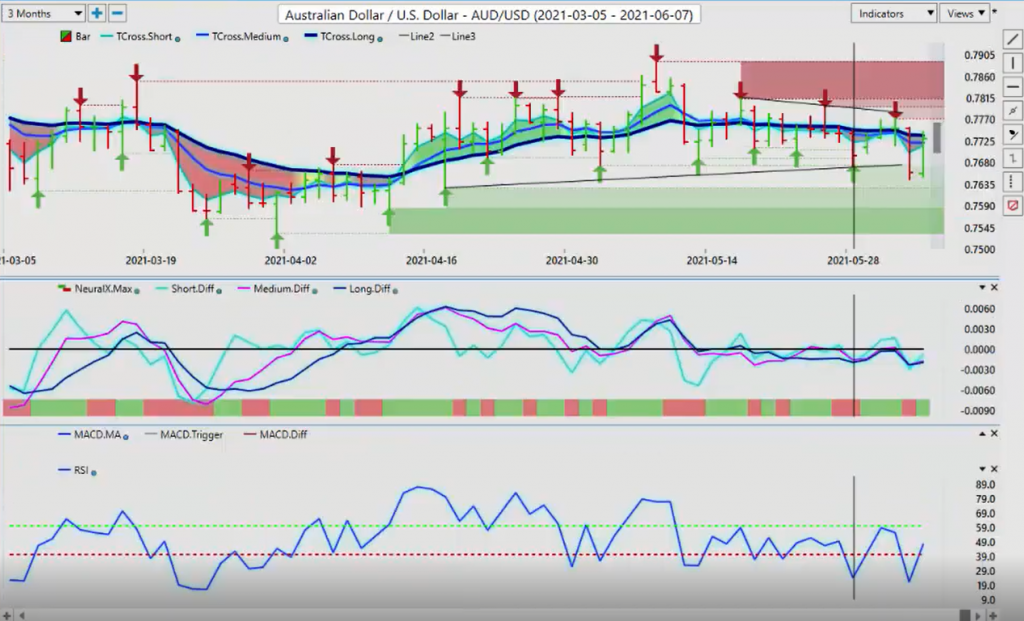
We look at these inner market correlations and we can even break them down and say, “Okay, well, I don’t want to look at yearly correlations. What are the monthly correlations that have very high correlations?” Then, these numbers start to change a bit, and you can see that some of those are swapped out for other markets. If I go to the quarterly, I could see the exact same. So this is what you want to watch, guys. And again, we want to do science-based trades, not in a crystal ball, voodoo stuff, or waves or whatever.
New Zealand Dollar versus U.S. Dollar
If you can apply those other markets, that’s great, or those other indicators or trading systems. Just make sure that you understand what’s really the driving factor of these underlying markets. It’s always based around, in my respectful opinion, the dollar index, oil, gold, the S&P 500, and now a new player, which is gold’s archnemesis, which is Bitcoin or Ethereum, like any of those Blue Chip digital currencies.
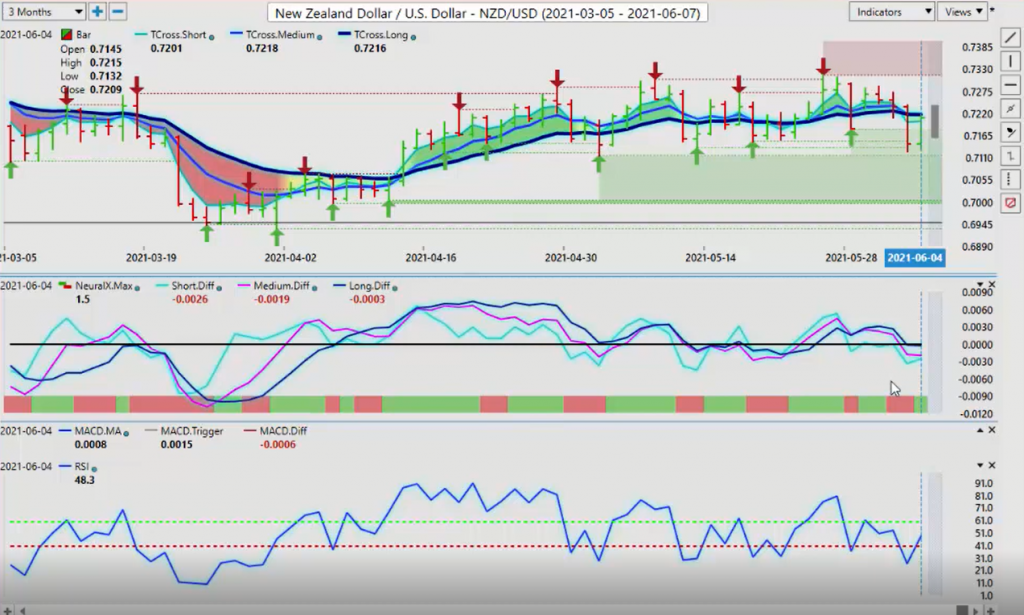
So when we look at this again, the New Zealand dollar, almost identical. As we’ve come all the way up off the yearly opening price, we’re hitting and getting all tangled up, 0.7216. But if we can break above that and the indicators show momentum, then we could have longs here too. But what we need for the Aussie, the New Zealand and the science, guys, science, is we need strong commodities and we need strong equities. That’s what we’ll feel those demand for those particular currencies. So with that said, this is the VantagePoint AI Market Outlook for the week of June the 7th…