


Welcome to the Artificial Intelligence Outlook for Forex trading.
VIDEO TRANSCRIPT
Hello everyone and welcome back. My name is Greg Firman, and this is the Vantagepoint AI market outlook for the week of May the 10th, 2021.
U.S. Dollar Index
Now to get started this week, we’re going to begin with the dollar index, but we’re going to have a brief discussion here on the US unemployment rate. Now are the numbers a bit of a shocker on Friday to just about every economist out there, lots of different reasons popping up. Why that unemployment number they’re saying was so bad. Unemployment benefits being extended to September people staying at home, not wanting to go to work. I can’t speak to that. I am domiciled in Canada, so I’m not sure about that. Just what I’ve heard, but what we can do is look at the U six number here and really make a decision more on that than just the headline number.
Now, the U six number is the broader unemployment rate we can see in 2011, if we go back to the, the height of the COVID crisis at 22 million, we’re in 2021, we’re 11.1. 11.1 in February, but as this number goes lower, this shows a stronger labor market from 10.7 to 10.4. So I’m not in complete agreement with the way that the media is spinning, how horrible that report was. I certainly will concede it wasn’t great, but I would also respectfully submit that it was very curious that gold started to rally midweek. It definitely suggests that that number was leaked and that’s why gold started to move higher.
I knew something was wrong soon as I saw that. But once again, you know, I think it would be, it would warrant somebody to look a little closer into this, to say who was actually buying gold midweek because somebody was, and, and I find that very suspicious to say the least, but looking at the dollar here, we can see if we go back, we count this back. One, two, three, four, five, right here. We can assess that the dollar had both three good days of rallying. And then it, right after that ADP reports, something was wrong. But the, even the ADP report came in at 740,000 jobs, I think, so really nothing really to worry about there, but then all of a sudden on Thursday, it really started to sell off. And that’s when we saw gold, starting to spike.
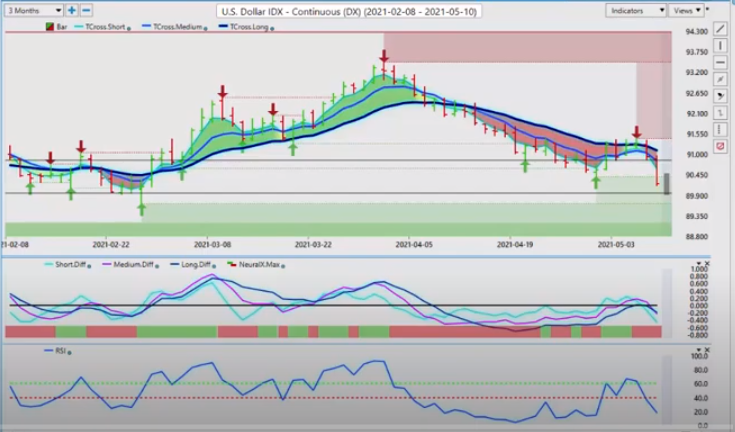
Now Bitcoin went up with it though, too. So we’ll talk about that, both of those in a minute, but for now going into next week, it’s going to be difficult for the dollar to rally. Now we know what the US Dollar cycles that the dollar is normally week on the Tuesday after the non-farm payroll. Anyway, so this is likely to accelerate what I will, what I will suggest to everybody for the week that you, the area that you really want to keep an eye on, okay, is about the 89.80 area on the dollar index.
Now these dollars cycles, there’s certain currencies that they affect more than others. The Euro, the Swiss Franc, the yen. These are the main currencies during that period, the Aussie, the New Zealand and the Cad. They’re more commodity, equity-based more so than dollar strength, but when we look at this again, the yearly opening price in the dollar, just remember, despite all the noise and everything we’re hearing from the market, it’s still, the dollar is still positive on the year. Not by much now, but it is still positive.
When we look at this from a seasonality standpoint and we go back one year, it was one year ago to the date that the dollar took a very significant tumble. There is enough more than enough meat on the bone here to suggest that, that could repeat itself. So I’ll point out that seasonality because it is important, but what we also have to take into consideration here is that the dollar went lower because of COVID, gold, gold went higher. The US vaccine rollout is doing well very well. A lot of the states are back to normal, not even wearing masks anymore. So things are improving. So just remember it, the conditions in 2021 are not the same as 2020.
The, I believe that the labor report labor market will recover here and again, with those extended unemployment benefits going all the way out to September, excuse me, September, then these numbers are going to be a little bit skewed. So for now, going into next week’s trading, the thing we want to see is can the dollar breakdown below the yearly opening price and officially turn bearish on the year. We will be able to see that using the vantage point key pivot areas 91.10 is the vantage point T cross long. If we click on our FA, we can see that we’ve got our two day rule here.
Now I’ve, I’ve talked about this before with the two day rule is what I look for is a two day close below that blue line than a retracement back to the blue line. That level is 90.77. So again, we’re closing at 90.21. I would anticipate we will come up and test 90.77. If we fail at that particular level, then the dollar is likely going to push significantly lower going into the, in the coming weeks. Now, if that is true, then I would flash forward is here to gold. Now, again, I am not a gold buyer until we clear that very important yearly opening price, which is 1904.00. Gold is still as if you bought gold on January one here, guys, you’ve been losing money the entire year. That’s a simple point of fact. So when I’m going back and I look at this from once again, one year ago, gold did have a very significant rally last year at this time, because of COVID though.
Gold
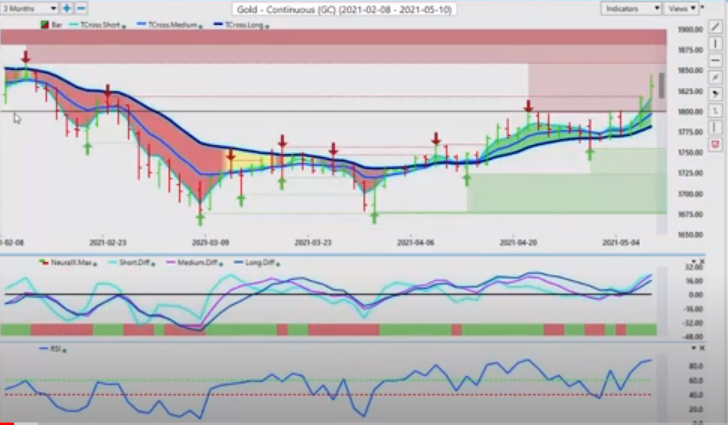
Remember if we didn’t have the international global lockdowns, COVID spreading, gold would, would not have gone to those levels. So it’s left to be seen still is gold going to turn bullish on the year. In my respectful opinion, again, I would not personally be a gold buyer until it’s actually positive on the year. Am I missing something between the current price in 1904.00? No, actually I’m not guys, because again, there’s, there’s a number of different, there’s, there’s several positives for gold, but there’s just as many negatives. And again, I believe that the US economy is going to recover. The jobs are going to recover and that will improve as we start moving along towards September. Now, right now with our MA diff cross, we do have a clear buy signal on this, but we’ve got to get through. We’ve still got some very stiff resistance up here, 1858.00.
I think it’s inevitable that we’re at least going to test that level very early in the week, but we want to watch the vantage point indicators very closely for potential failure. Now, the T cross long is all the way down here. When we look at this at 1781, the further we move away from that level, the more likely it is we’re going to retrace back to it. When we click on our FA, we can see we’ve got a huge gap in price off of their 1801.00. So I would anticipate that we are going to come back down to these two levels very early in the week, probably by Wednesday. And we want to see if this level at 1801 is going to hold.
If you’re a gold buyer, then that’s the area you would focus on to begin the week. Now the vantage point predicted low is that 1816.00. So another way that you can do it for next week is say, okay, I believe that gold is going to go higher date 1858.00. So I would target the vantage point, predicted the distance between the vantage point predicted low at 1816.00, And that long predicted the predicted moving average by itself at the 1801.00 area. So if you are a buyer, that’s the area you would target. Just remember what I’ve said, hear my warning guys, 1904.00, We are still negative on gold in the year. Just be very, very cautious. Now I’m sure the fed is sitting back in his chair, giggling and saying, I told you so here.
S&P 500 Index
So obviously the equity markets love that number. And because the fed is not going to hike or at least that’s what they believe. So right now, again, to begin the week, we want to target some levels here.
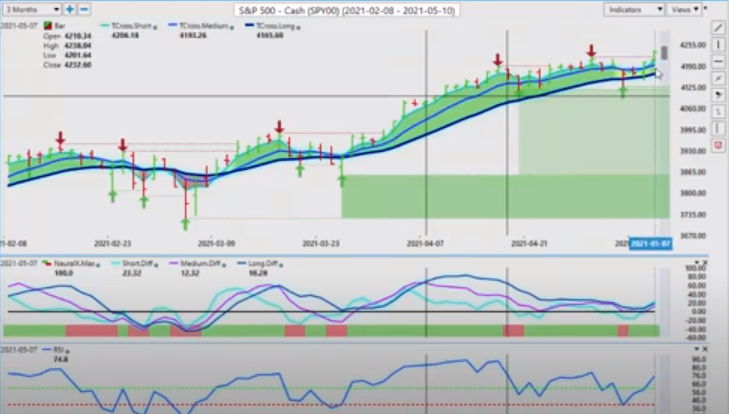
Our T cross long is 4165. 4165 or long while above this level. We’ve had multiple retracements to it on that dollar weakness this past week, but we’ve bounced out of there each time. Now on this push below here on the Tuesday, this is the classic Tuesday reversal that I often talk about, but you’ll notice we did not close below that level. Try and ignore the intraday volatility, the noise and everything else, but always watch where we close. Are we closing above or below that vantage point T cross long. We’re closed above, that led to another three-day rally. But again, my, my, in my respectful opinion only, I’ve been in this, these markets for 25, 30 years now. And I know when I smell a rat here and somebody I’m, I’ll eat a bug if I’m wrong here, guys, but I’m telling you somebody leaked that number there because stock started moving up heavy, but gold was the one I was watching.
So once again, we did have a verified resistance at this high of 4218.00. So I, I’m still, I’m still support longs even at this level, but we have to be a little bit more cautious with longs. Now our predicted low to start the week again is 4211.00. So we want to match that up to the vantage point, predicted moving average, that’s coming in at 4198.00. So the way I would look at this each day is the way I look at this. Actually, this is just a, because this is an outlook, not a recap of something that already happened. So it’s a trade setup that you can replicate in your own trading. So at the predicted low is 4211.00 and the vantage point predicted moving average, the long predicted is 4198.00. That’s the target zone. And we know that Monday and Tuesday are volt.
Monday is volatile. Tuesday is a reversal day. Then by midday, Tuesday, we start to get a real price, a real feel for the market. So these are the levels that you would want to target. The indicators in vantage point are fully supportive of longs on the S and P 500. The fundamental picture obviously is also supportive of further equity gains. It’s very difficult, even for me to believe that the S and P is at 4200.00, and we just keep making these new highs, but to the credit of the vantage point software, it’s been an accurate call. And I haven’t always agreed with it, but it has been accurate, very accurate. Now is we look at oil for next week. Now oil may have to take a step back here. Can it continue to advance with the stock market? Potentially, but it, the market could also interpret this as that the global economies are not going to take off the way they thought they were going to, and there may be less demand for oil.
So get oil will still follow the S and P 500, but some of the critical levels we have to watch here, there’s a very different signal here between the S and P 500 and oil. When we look at oil, we have an MA diff cross right here, the medium term trend against the longer term trend is not strong.
Crude Oil
We have very powerful, verified resistance that has not been able to been break at 66.52. So now we have to sit back and see, is the market believe that that labor report does the market now think that the economies are not going to take off the way they previously did that could let some of the steam out of some of the era of the oil to say the least. So once again, keep a very close eye on the critical level here. And when we look at this, we closed on Thursday below that predicted moving average at 64.85 on Friday, we rallied back up, but we still closed below that blue line.
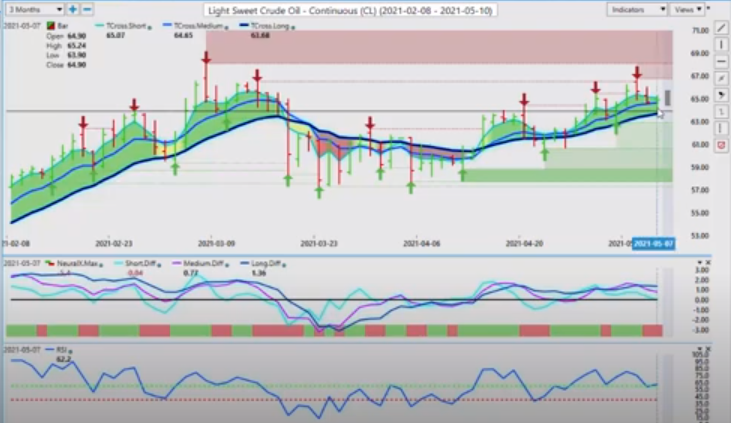
Our MA diff cross is our neural index, but our RSI is predicted RSI is still telling us we have momentum year, so a very mixed signal, but watch this level, all of your activity to start the week is going to be around 64.94. So we’re going to be watching other commodities, and we’re going to be watching us in the S and P 500 if we are trading oil. Okay.
Bitcoin
Now, when we come up here and we look at my, one of my favorites, as you guys probably already know, I am in the exact opposite camp of, and I have been for a very long time as Warren Buffett and Berkshire Hathaway on Bitcoin. And, and again, it’s my understanding now that you know, the people that are not trading it are now having special investment teams set up to trade it. So very confusing things coming out of Berkshire Hathaway and some of these other big investment firms. But, once again, Bitcoin’s still having a good week here guys. So when we come back here, one, two, three, four, five, we came down, but then we fully recovered. And again, using the vantage point, verified support levels are fantastic because there, there are a non indicator. They simply identify the support and resistance zones or failure points in the market.
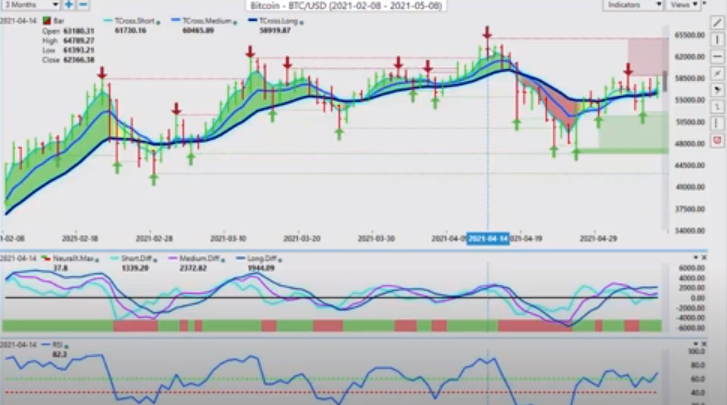
So from here, what I’m seeing is that we have good support on Bitcoin at that low of 52,418. We’ve got buyers coming back in. We just need to clear this particular level here at this high of 58931.00. And then we would likely look to return back towards the 65,000 mark. Now, just remember, like the way I look at people will argue that there’s no intrinsic value with Bitcoin. Well, there’s no intrinsic value with gold either guys, but the difference, the large difference between Bitcoin and gold and my respectful opinion only is that one is going to be a form of payment, just like a US dollar, Canadian dollar or a Euro.
So it then has value because we say it does, you know, we say that gold is worth $1,800 an ounce. That’s because that’s what we’re willing to pay for it. Right? But the difference between that and Bitcoin in my view is that we’re going to start be able to make payments on cars and maybe houses. I don’t know, but food beverage, all these things, there’ll be a form of payment, whether it can maintain these lofty levels will left to be seen. But for now, it’s still remains bullish. The indicators on vantage point, very mixed. And I may diff cross down, which was accurate, but the neural index is holding green and the RSI is above 50 and above 60, which suggests that we still have further upside potential. And after that labor report, that’s not going to help the US dollar against Bitcoin.
Euro versus U.S. Dollar
Now, as we move into some of our main Forex pairs for next week, looking at the Euro us payer, once again, you can see I’ve highlighted this bar right here. This was to start the week we came right back up here, and then we sold off at three good days of selling. But then the ADP rec report came out on Wednesday and gold started to spike something very odd was happening. And, and I direct, I saw it clear as day, as soon as gold started a rally. And really there was no reason for gold to rally on a technical or a fundamental basis, based on the previous economic data, the recovery and the anticipated recovery in the labor market, unemployment rates, all of these things are improving. So the Euro goes lower with gold, but then it turns around. And this is where again, we’ve when we look at this in the market, the neural index turned from red to green as gold was rising. So the one thing you want to understand what the Euro currency, if you’re trading, it is a very high correlation to gold.
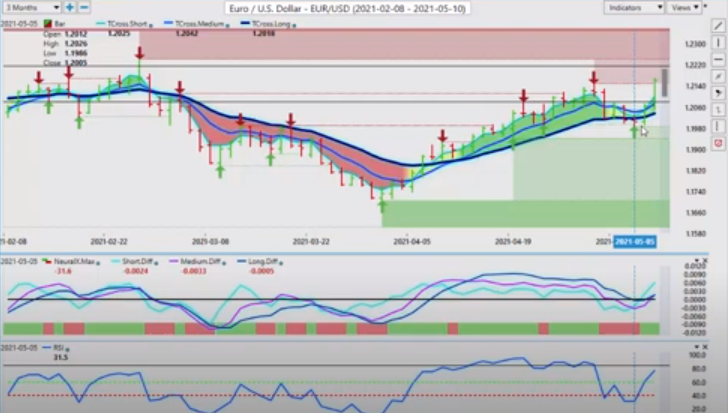
So gold is going up. Then the Euro is likely going to follow that. That is what happened, but when we break this down again and we click on our FA, you can see that trading here for the week that we, we immediately started the week where last in last week’s weekly outlook. I suggested that exact level for shorts in the video around the 1.2070 mark. Then we sold it again on, on a Tuesday at the exact same level. Then on Wednesday, we’re starting to have a bit of a problem here. It’s still down, but it came back up here and there’s the warning sign for me, closing above that predicted moving average, that was an absolute problem with the neural index. And then of course it led to this big spike.
So the Euro, once again, here, guys is no different than gold. If gold continues to advance towards its yearly opening price, the Euro currency will do the same 1.2240 keep a very, very close eye on this. We’ve had failures at this level before in this very calendar year. So again, you can see it right there, the exact date where it retraced back up to the yearly opening price and then crashed even lower. So be mindful of that guys around that 1.2240, 1.2238, be very, very cautious at that level.
British Pound versus U.S. Dollar
Now, as we go into the pound dollar for next week, once again, the pound is, is moving up. You can see that I identified, we had the, the move up on Monday and the bank holiday. And then we were basically down the entire week on the pound. It just couldn’t seem to get going. It couldn’t get past where it’s high was on Monday and it just kept wandering around, but this is the level you guys want to keep an eye on for next week, 1.4015.
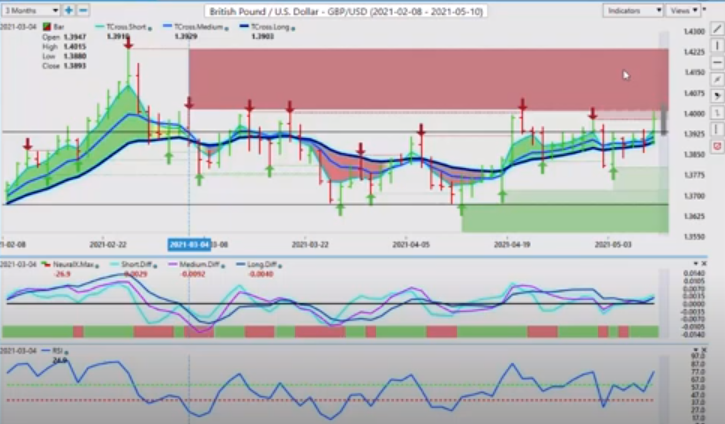
Now there is a, obviously a dark ominous cloud hanging over this payer, this, this very heavy verified resistance zone. So if we start penetrating into this dark red area, then again, the pound, if it can clear 1.4015 and close above it for two days in a row, we should be able to get up towards this 1.4234, but the bank of England is just as mixed as the FOMC. So there’s no guarantee here guys. Okay. Now what I will warn you of too, with the pound dollar is that like Euro US the real driver behind these two is believe it or not. You’re a great Britain. So if your old great Britain rallies with if gold rallies and then the Euro rallies, then that’s going to push your own great Britain higher, which may pin great Britain US below these levels.
So keep an eye on that pair right now are key levels in the vantage point software, you can see we’ve springboard, literally spring-boarded off the T cross long on Friday, 1.3894, but always remember that could have gone either way. If that unemployment report came out, what they were looking for, like a million jobs or even eight or 900,000 jobs, and then upward revisions to the previous month, the pound dollar could have easily broken down below there. That’s why you want to always avoid those type of event risks, because it’s a crap shoot. Like, you know, they’re forecasting a million jobs, they get 266,000. It, nobody can anticipate that something like that happening, that the number being that far out, right? So, but this is the key level to watch. If we can’t break through this level and close above 1.4015, then the, the pound may be in a little bit of trouble, even though the Euro US is rising.
So when we click on our FA and we look closer at this to begin the week, we’ve got 1.3932. We have the vantage point predicted low at 1.3920. So again, all of what, in this particular case that if you want to buy the pound dollar, yes, there could be a breakout play, putting a tagging, a limit order at say (1.40) 1.4030, 1.4025, but that’s a high risk long trade at that level. I would prefer to wait and do the setup that I’ve discussed in the vantage point live training room and in on here, is when the predicted low and the, the predicted moving average is in the same zone. Then that’s the area we would target.
We want the trades to come to us. We don’t want to chase price here guys. Let them have their fun up at 1.4015 and see, because like I said, if it stays above 1.4015, you can buy up there anyway, on the break of that level but I want to see it closing above that level two days in a row, then this very long-term resistance area will potentially become a longterm support level. So resistance has to flip to support. We’re not there yet. Okay.
U.S. Dollar versus Japanese Yen
Now the dollar yen, once again, it didn’t have a bad week either. You can see I’ve outlined this line on this bar rate here. We came down at the end of the day, a Monday, and then we basically went up to sideways for the next three or three days or so, but then something ominous or funny was going on with gold. And next thing you know, the dollar ends tanking. Remember the Swiss Franc, the Japanese yen and the Euro, these currencies follow gold. So if there’s any upward move in gold, there’s going to be an upward move in those currencies, like the yen. So that’s, what’s pushed at lower.
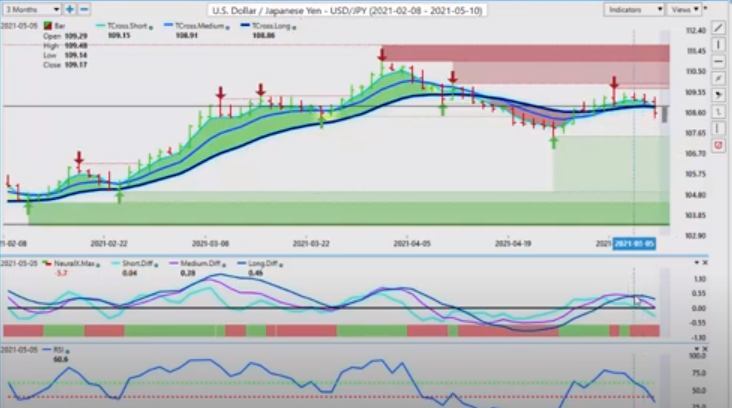
When we look at this right now, our medium term crossing our longterm predicted differences down and it’s down hard. So a again, it looks at what the break of the 40 level and the RSI, the problem, the only other potential savior for this pair is that if stocks really rally hard in a risk on environment, that still doesn’t necessarily mean it’s going to favor the yen because of that correlation to the stock market. So again, we’ve, we’ve got to keep bringing gold back into this scenario to see if, because really, if the stocks are going up this hard, like the stocks have been doing prior to COVID, that was killing gold, that wasn’t helping gold at all. So again, when you want to watch gold, if you’re trading this and the S and P 500, but our key level 1.0885, we closed below that.
Now we need to see if we can hold below that. So if we click on our FA, we’ve got our vantage point long predicted here at 1.0892. We’ve got our predicted high at 1.0882. So all of our resistance is clearly identified if you’re using your software this way. So we’ve got our T cross long, our long predicted and our predicted high all in that same area for Monday, that’s the area you want to watch. And if, if that area holds, then the dollar yen is likely going to take a run at this lower 1.0748 area. Now with the US Canadian pair, a big move down on the bank of Canada. I’ve repeatedly given warnings on here that the bank of Canada’s numbers are lagging. They’re saying the Canadian economy is booming. It’s coming back. That’s just not factual.
Ontario has been shut down. We’re still shut down and locked down. The bank of Canada takes legging data. The problem here is what I will let everybody know is that we open, we close, we open, we closed, we opened, we closed. We keep playing this game here and it’s throwing the bank of Canada’s forecasts off too, because the economy is booming one minute, and then it comes to a grinding halt the next. So this is causing confusion. In my respectful opinion, we have moved way too far, way too fast on this pair. And it’s been caused not by the governments, not by the people by the bank of Canada, making a flip comment when they shouldn’t have made that comment saying that everything is fine in Canada. No, COVID here. That is not true. Again, Ontario, the most populous province is in complete lockdown. Stay at home order.
U.S. Dollar versus Canadian Dollar
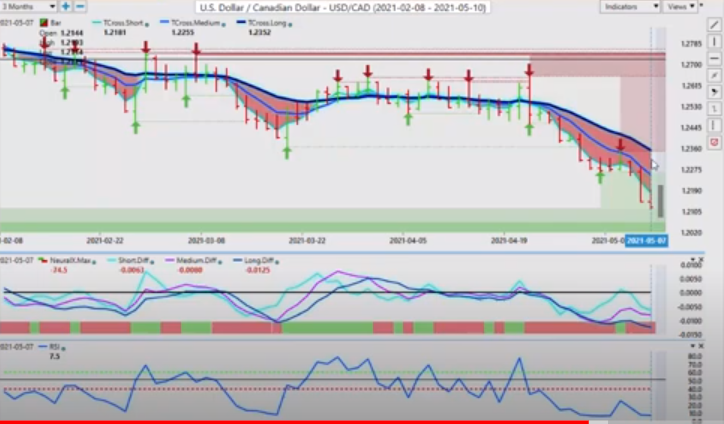
The economy has come to a complete halt. The bank of Canada, when they made that comment, the economy was on a partial lockdown and things were improving, and then it went sideways, completely went the other way. So the bank of Canada’s forecast, we need to put that aside. At least for the time being Canada does have a good rule vaccine rollout plan in progress here. Now that should help, but it’s going to take time here. And now that, that there’s a lot of slack in the, in the labor numbers. So we have to see, but when I look at this for next week, the long predicted I would anticipate at the very least that we are going to come up and, and test the 1.2233, the, the Canadian labor report from Friday was absolutely horrific. The unemployment spike all the way up to 8.1, a loss of 200 and some odd thousand jobs.
But that’ll turn that should turn around by potentially July, August, and we get the slack out of there. But for now, the market’s going to have to rethink this a little bit after looking at that labor, because as bad as what they’re saying, the Canadian, the US labor report was on Friday. The Canadian one was just as bad if not worse. So we’re, we will be looking for a retracement here, but the market is, this payer is moving into an aggressive downtrend to say the least.
Australian Dollar versus U.S. Dollar
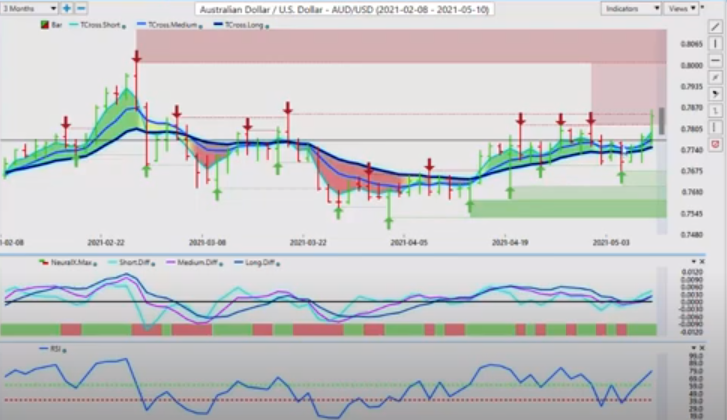
Now with the Aussie and the New Zealand. Once again, you can see that the Aussie and the New Zealand did nothing all week. We came up here and then we were down for basically, or three or four days. And then as gold spike tire. Again, my view, I’m going to keep saying this, you know, is that my view is that, that there was a, there’s corruption at its finest.
Somebody leaked that, that ADP report, excuse me, the non-farm payroll number. Somebody made a lot of money off that. And, you know, because again, when you look at the fundamentals, but the Aussie obviously responded very well. Now we’re getting all tangled up in this zone here. This predicted, or this, this verified zone high is 0.7849. If we clear this, you can see that we have very, very little resistance until the, the 80 cent mark. So a potentially very good week to be buying the Aussie. And if we put the piece of the puzzle together with inner market correlations, the Aussie loves it. When the stock market, the S and P 500 goes up, but it also tends to like it when gold goes up too. But the higher correlation in my view is the S and P 500.
New Zealand Dollar versus U.S. Dollar
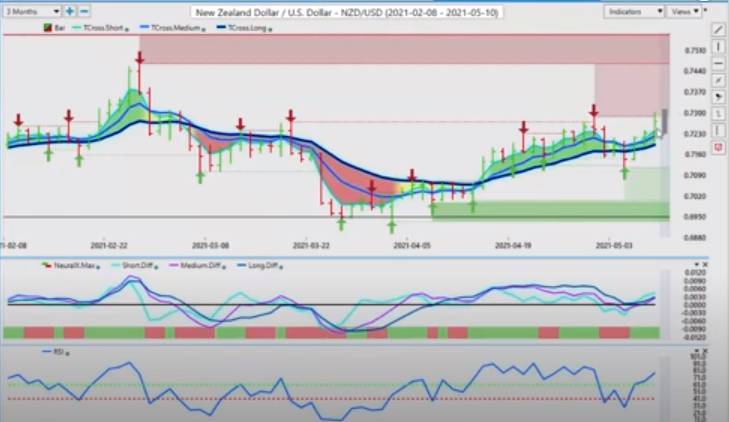
So the S and P continues to advance, we can break through here. We have a fresh buy signal with our MA Diff cross. Our neural index is on board predicted RSI looking great. We just have to clear this hurdle at this high of 0.7849, and that will open up the door to potentially 80 and beyond the same exact thing applies to New Zealand Us here guys, it’s the same trade. You can see almost the exact same signal. We just need to clear that high of 0.7286. And once again, that opens the door to 0.7464 and potentially beyond.
So it’s just a question now guys, is how is the market going to respond to that labor report? Are they going to look at that U six and digest it a slightly different the way that I did, or they just going to fire at will and start selling US Dollars based on the fed? I believe it’ll be a bit of both here, so we’re going to have a choppy week ahead, but I think there’ll still be some very good opportunity. So with that said, this is the vantage point AI market outlook for the week of May the 10th, 2021.


