


The Hot Stocks Outlook uses VantagePoint’s market forecasts that are up to 87.4% accurate, demonstrating how traders can improve their timing and direction. In this week’s video, VantagePoint Software reviews forecasts for CarMax (KMX), Checkpoint ($CHKP), Verisign ($VRSN), Pfizer ($PFE), National Beverage Corp. (FIZZ) and Northern Oil and Gas ($NOG)
Register for a Free Live Training
Hello again traders and welcome back to the Hot Stocks Outlook for September 17th, 2021. Hope you’re all having a great week out there in the financial markets. And as always plenty to cover in today’s outlook.
We’re going to start out, we have shares of CarMax also have Check Point Software, Verisign, Pfizer, National Beverage, Northern Oil and Gas. So a lot of different markets spread all over the marketplace and there’s really been a lot of volatility. There’s some stocks doing well, some things doing poorly. We’ve got the dollar index moving around quite a bit, and you’re seeing these things ripple through the markets.
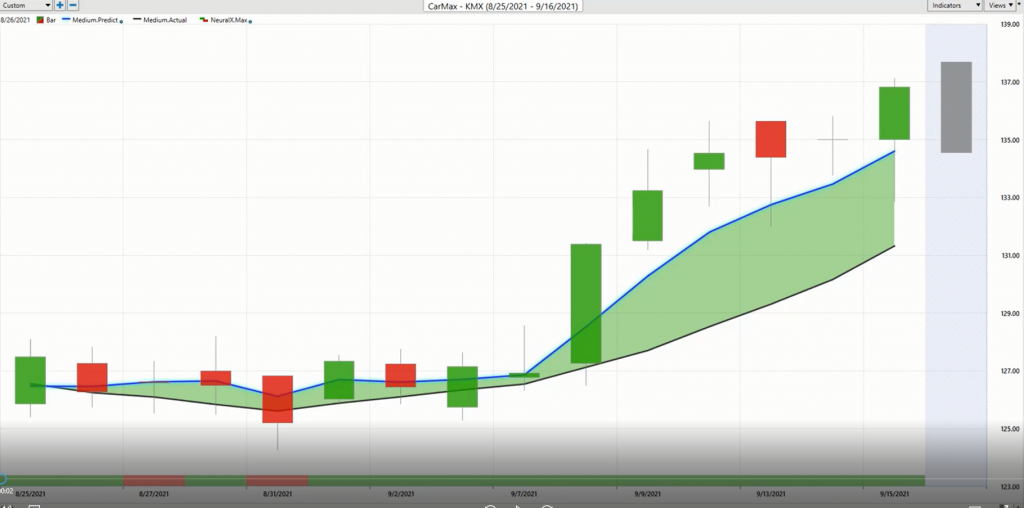
But a really straightforward example of how to use the Vantagepoint software in shares of CarMax here. And so what you have is daily price action. So you see each one of these daily bars represents a full trading day. So you get your high, open, low, and close. And right up against that data you’ll notice there’s a couple of lines. There’s a black line there and also a blue line. Now the black line that you’re seeing there, that is a simple moving average or what we refer to it as the actual simple moving average. And that’s a very common technical indicator. And what it does is it looks back at the previous, in this case, 10 closed prices, adds those all together, divides by 10. And it’s a very simple tool. And what it does is it helps to smooth out the price data so we can see where prices have been over a given period of time.
But traders need to know where is prices going? Where’s the price going into the future? Where can we be ahead of a move in the market and make sure we can get our positions before an advance or decline? And so what we’re able to do is actually compare these two lines, that blue value and the black value. And whenever that blue line crosses above the black line, you can think of it as suggesting average prices are going to start moving higher. Now it’s important to understand, not just that predicted moving average value, but at the very bottom, you see, we have what’s called the neural index, we’ll get to that, a predicted high and a predicted low that’s provided before each and every trading day.
But what’s important to understand is for all of these indicators to get generated and plotted against the charts that traders can use this information, Vantagepoint is utilizing its technology of artificial neural networks to perform what’s called intermarket analysis. So what that means is specifically to CarMax the software understands market relationships. Now that can be things like individual stocks that share, there’s stocks like Carvana and other things in similar sectors. You’ve got things like just the S&P and the global indexes or the NASDAQ and the Dow Jones Industrial. You’ve got things like global currencies, like the dollar we’ve seen that has a big effect on commodity driven stocks, as well as the actual commodities and currencies. You’ve got global interest rates. Then you’ve got big things like ETFs which wrap-up a lot of stocks and where investment is flowing in and out.
So what the software is able to do though, is look at those market relationships, understand how these things push and pull against the target market and actually use that information to generate true price predictions of where price is expected to go into the future. Now, what happens is those predictions are then utilized and built into these indicators. So you actually have these forward-looking predictive tools. So in the case of the predicted moving average or this blue line crossing above the black line, it’s suggesting average prices are going to start moving higher relative to where they’ve been.
Now, one of the really great things about the software is really the adaptive abilities of it, as it’s able to every day look at those global close prices, whether it’s global commodities, stocks, how those are affecting the target market, and then forecast out for the next trading day. So at 6:00 PM Eastern time, you’ve got all of the information for the next trading day. And it’s going to let you know, okay, well, are we getting signals where we’ve created fresh crossovers? And that’s where we can use some of the tools like the IntelliScan to see those fresh signals coming through and actually let the software drive us to identify opportunity.
But moving on here, in addition to that blue line crossing above the black line that suggests average price is going to move higher. That neural network and technology process is also working at this bottom indicator here, but just like you have probably seen a very simple artificial intelligence example, they’ll put a little robot in a maze and it will figure out how to get to the goal and you can move the target of the end of the maze. And it will eventually run a bunch of iterations and figure out where it needs to go. Well, it’s kind of the same thing in that you need to set a target. And so for the neural index at the bottom, this is targeted to be very short term strength or weakness in the market. So plus or minus over the next 48 hours, strength or weakness. And we can combine that with the other predictive indicators that work on other timeframes, maybe even our own analysis, where we have a fundamental bias to be long and buying and taking profit or shorting the market. But nonetheless, we can use this as a guide that says, okay, well, if that blue line is crossing above the black line, we know we only want to be long, but when this neural index goes bearish, the way I like to think of it is expect some lower lows over the next 48 hours of trading.
Now you have to understand this will get updated each and every trading day. So you see it gets bullish here and we subsequently sort of trade straight out of there for the most part. But then again, we can use the predicted highs and lows. So while at the end of this trading day, it’s telling you that neural index is bearish. Hey, there might be some weakness over the next couple of trading days that adaptive technology says, look, the blue line is still above the black line. And in addition to that, you’re provided with these predicted high and low ranges. So we can see this is the prediction for today. And we can see how accurate all of the previous predictions are. And so you have all of these levels here. So when you understand on this trading day, hey, expect some weakness over the next trading day. We understand look down towards these predicted lows to be a buyer. And you see that 48 hours later, market’s moving higher, some more predicted lows being hit here from volatility around these areas. But overall, I just really, I keep bringing these predicted forecasts in over these long spans of time to highlight things like this predicted range. Even after the market does break higher as the forecast suggested, volatility picks up and these levels do an excellent job day in and day out of identifying some levels where you can come in with a trading plan and approach and make the most out of it.
Now here’s Checkpoint Software. And what’s been interesting is we’ve seen a lot of signs as far as bearishness in the broader indices. So the S&P is rolled over. We see that in the Dow, and that really sends those signals, especially when you run the IntelliScan and see, hey, there’s stocks that are rolling over here.
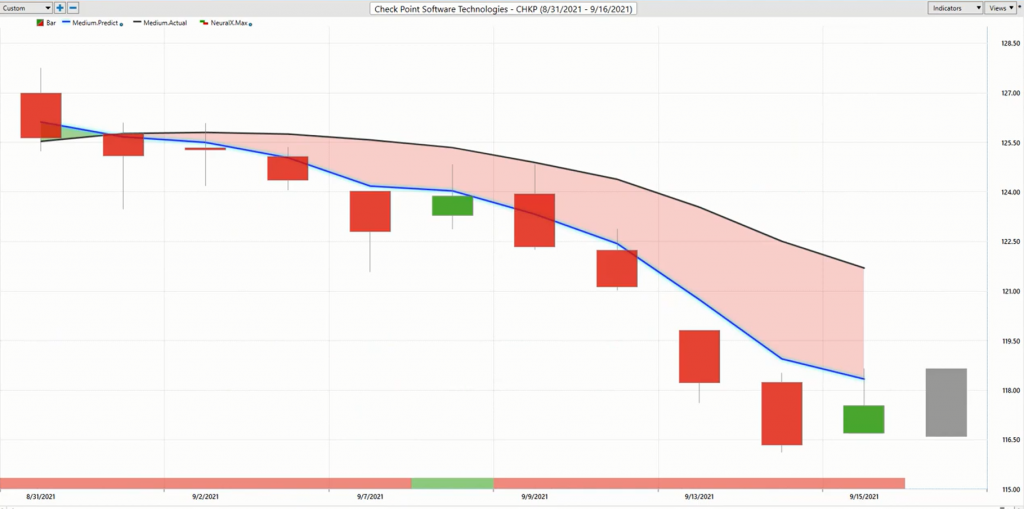
If we have maybe positions where we’re holding long positions, well, it certainly looks like a good time to maybe hedge some of those positions, look to get some short term… some shorts on the market and balance things out. And so here we have Checkpoint Software, we see crossover the downside, pretty much weakness all throughout here. You have one day where the neural index goes bullish. You get a little bit of higher highs there over the next trading day, but very quickly, let’s see this as 10 trading days, it’s right nine out of 10 times. And the overall trend saying you’d only want to short and take profits on shorts. Of course we can bring in the predicted highs and lows to get even more specific as far as the forecast. And levels that are screaming at you if you’re looking for an area to get short up here. And you see that, we get that trend resuming and then things bouncing around a little bit more.
But it’s the quality of the forecast where it says, okay, well, if you can find a spot where you know you want to be, figure out say, hey, I want to be long here. I want to be short here. Let’s go in with the Vantagepoint tools and manage that. And if things start going wrong, or if a trade goes bad, well, Vantagepoint’s going to very quickly say things have shifted, change that behavior and use the Vantagepoint forecast to make the right decision here.
Here’s Verisign, again crossover to the upside here. So we’re seeing a lot of mixed signals here. Some stocks are doing well, some are doing poorly. Like I said, the overall index is actually looking quite bearish and we’ve seen things suffer a bit, but you see here in neural index bearish, you get a little bit of weakness here. Sometimes I like to think of this as if we have a predicted moving average and the neural index is bearish. Well, expect some prices to trade below that moving average that you have. And you see, you get a couple of days where the prices are hanging out a little bit lower, but neural index gets bullish again. And the uptrend resumed, same thing happens here. Another 48 hours, there’s some weakness in the market, but we can pinpoint all of what’s going on here. And say, okay, well, we can have these predicted highs and lows to help guide some of that action and know, Hey, if we’re trying to buy while we should buy at, or near that predicted low target up towards the predicted highs and clearly only be long, taking profits on longs.
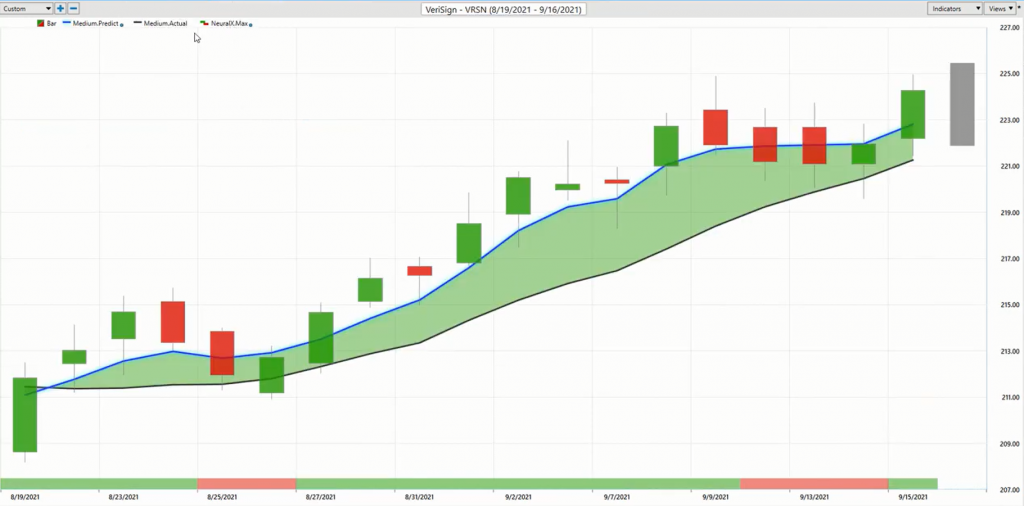
And you see just a period where the market has not performed very well. If we’re just talking about the S&P and the broader markets, but where the forecasts are forecasting things to move higher, these levels do a pretty good job.
Pfizer here, now things have shifted. We looked at Pfizer and BioNTech quite a few weeks ago where things were still an uptrend or a couple of months ago at this point, but things have shifted. And we can imagine that if a lot of those stocks shift we may see things weigh on the markets of those things have leaded higher. But again we get these crossovers to the downside here, and very clear if you’re trading Pfizer over what’s now been almost a month of time, three full weeks of trading, very easily here, you’ve been short and you’ve been short at these levels. Even on days like these are real interesting where if you’re going to short, you get short at the open here and you see that we get a couple more days where we move higher, but you do not want to get long. You only want to be shorting that market.
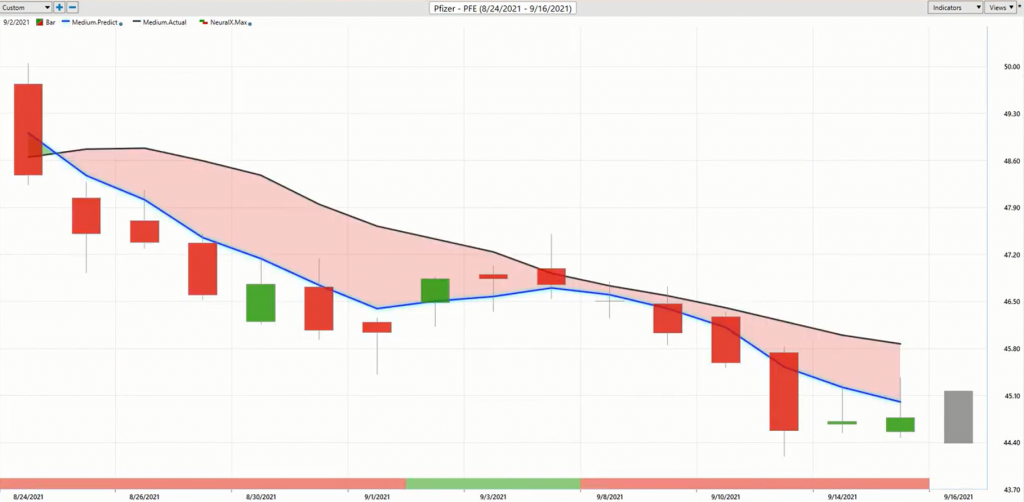
And that’s where we see again, the S&P also rolling over. So even when you see some of the strength coming in, you understand there’s some broad-based weakness here. And until we get that blue line crossing above the black line, we’re still projected to move lower.
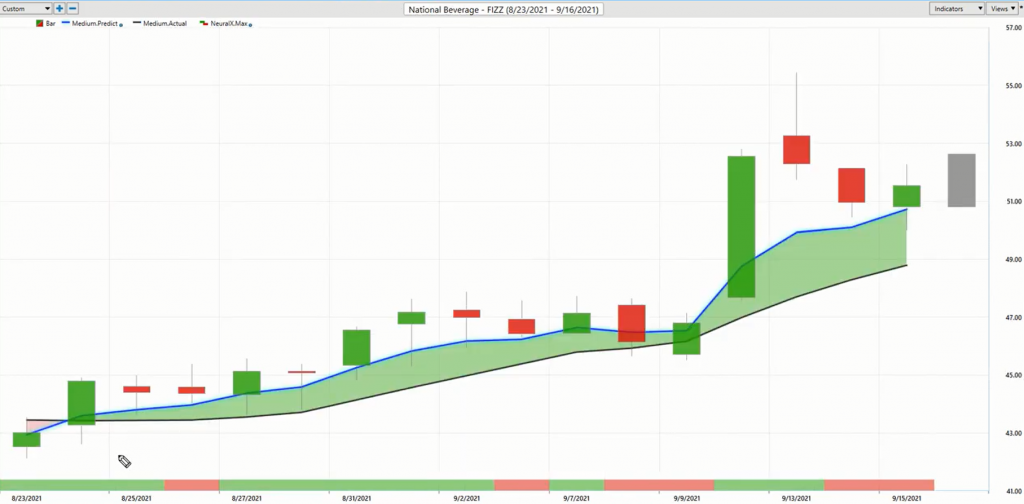
National Beverage Corp. (FIZZ)
Here’s a share of National Beverage here. We get across over to the upside. Again, you get these neural index periods where neural index you get the bearish there. It corrects the next day, but you still see you’re getting some lower lows over the next 48 hours of price action there. It happens again here, some lower lows, but the overall trend is up and same thing here and look for some lower lows over the next 48 hours at least, and manage the opportunity based on a lot of this information.
So we haven’t looked at a lot of it, overall moves here. We’ve got about a 16% move there. Pfizer, we can come back here. We’ve got a, not a huge move here and in shares of Pfizer, but 6% decline. If you’re on the way up there, you certainly want to understand, look, it’s over, take your profits, don’t give money back to the market here. Verisign here. We can take a look, overall about a 6% move. But just what I like to highlight with these opportunities is not so much the move from crossover to crossover because you’ve got to decide, are you a trend trader, or what are you looking to do with your overall strategy?
But the consistent forecast, so even when we look at these longer charts that have been trading, and there’s a lot of fundamental information and things going on in the markets and volatility, well, the software does an excellent job at saying, look well, if this is the market you’re trading, there’s unique markets that are known to drive and influence and affect that. And so those are really the important things that are going to affect how things go moving forward, and we can get some really valuable clues and insights from those related markets. And so that’s what’s really going on under the hood here. And so we don’t have to sort of guess, we understand, hey, if I’m trading this market, you know what the game plan is, you have those tools to help manage that overall portfolio. And that can be full of long positions, short positions that are all really benefiting and tend to skew in the direction of trend. And obviously if you’re managing, taking profits, adding at predicted lows, you’re doing a good job minimizing the risk, but still keeping that exposure on.
So here’s Northern Oil and Gas. We talked a little bit about the energy shifting, where there had been a lot of weakness. It was very clear you didn’t want to be long, especially if you’re doing short term trading that it’s easier to get that momentum to the downside. But it was actually about the 23rd, we saw all these stocks and crude oil shift to the upside. And you just start to, as you’re running your IntelliScan, you see these stocks start to shift upward and it makes it very clear that, okay, well, whatever the previous game plan was may have shifted, but you don’t just see it in energies, you see it throughout the whole energy sector and energy stocks. But even some of these stocks where we’ve seen a lot of volatility around crude oil the commodity, the reliability of the forecast here to say, look, if you’re going to be a buyer, utilize these levels to make these trading decisions and combine that with your overall strategy and timeframe that you’re working with.
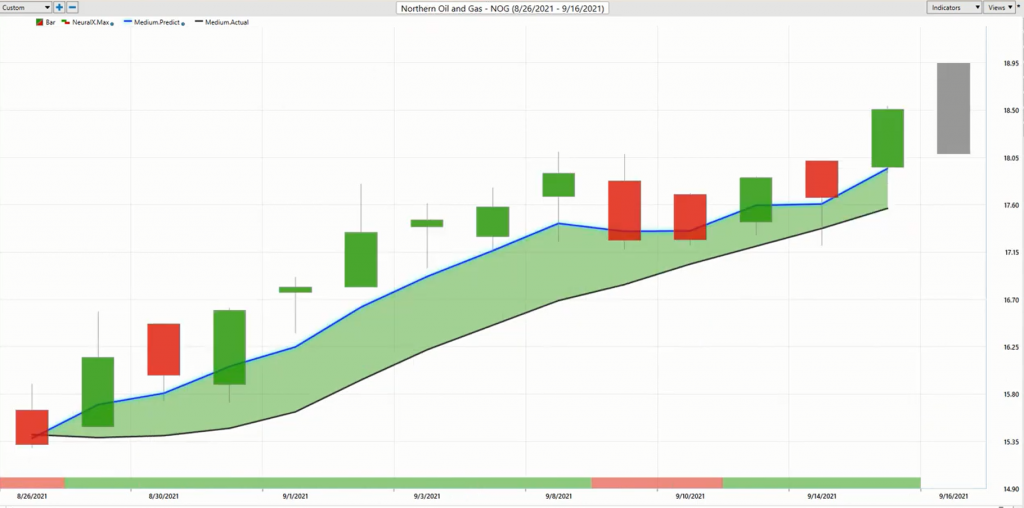
But we’ve got a really nice move here in a lot of these energy shares have certainly popped over the past few weeks, about a 18% rally there in Northern Oil and Gas. But multiple entries along the way to take these nice chunks out of the market as we see again all this volatility coming in. Oil rattling around, the dollar rattling around. It is certainly a period where you’re seeing volatility, there’s a potential for things to really crank up, but the guidance here the software is getting you in some really nice positions where if we see some of that volatility increase, you’ve got some things to potentially really benefit the portfolio. But the main thing is get those updated forecasts, adjust and adapt to those changing market conditions. So I’ll leave it there. Once again, this has been our Hot Stocks Outlook for September 17th, 2021. Thank you all for watching best of luck out there. Bye for now.