


Register for a Free Live Training
The Hot Stocks Outlook uses VantagePoint’s market forecasts that are up to 87.4% accurate, demonstrating how traders can improve their timing and direction. In this week’s video, VantagePoint Software reviews forecasts for Newmont Mining ($NEM)., Phillips 66 ($PSX), Bank of New York ($BK), Waste Management ($WM) and Apple ($AAPL)
Hello again traders and welcome back to the Hot Stocks Outlook for July 15th, 2022. Hope y’all are having a excellent week out there in the financial markets, and as always plenty to cover here in this week’s outlook. And if you’d like to learn more about the VantagePoint software, how it can specifically help you with your trading, make sure you go to vantagepointsoftware.com, you can sign up for a live training where again you can learn more of the specifics about how this technology can help you make those better trading decisions week in and week out. So let’s start out here with shares of Newmont Mining. We also have Phillips 66. We’ll revisit shares of Apple, Bank of New York, and lastly Waste Management.
And we’ve covered a lot of this over the past few weeks, but it’s really a good time to really summarize this past few weeks. We’ve had markets moving up, markets lower, and really how do you get those positions on and make those better trading decisions as we see volatility pick up in the marketplace. But let’s start out here with shares of Newmont Mining and what we have here is daily price action. So each one of these candles represents a full and complete trading day, and what we have right up against that price data, you’ll see there is a black line and also a blue line. So the black line that you’re seeing there is a simple moving average, very common technical indicator. And in this case, it’s looking back at the previous 10 close prices. It’ll add those all together and divide by 10. And what that value does is really smooth out the price action and act as a baseline for us, letting us know where market prices have been, but traders need to be ahead of that next move in the marketplace.
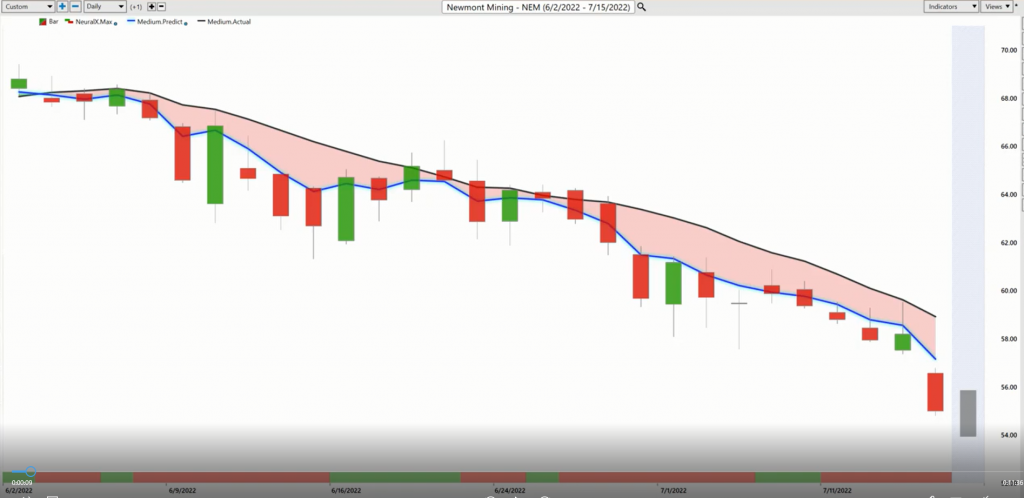
So what we’re able to do is actually compare that black simple moving average, or what we refer to as the actual simple moving average, to this proprietary predicted moving average. And for this number to get plotted and then calculated on your chart each and every trading day, this is where the technology of artificial neural networks come in and they’re performing what’s called intermarket analysis. Now, when we look at a stock like Newmont mining, well, certainly this can share relationships with other gold mining stocks or ETFs. But let’s just think about this. I mean, how much has this affected by things like the dollar index? How much has everyone’s portfolio been affected by things like the dollar index? Things like crude oil prices are the value of the gold futures themselves coming out of the ground, or silver, platinum, palladium prices. So these are all these factors that go into play and certainly become quite obvious when we’re talking about a company that literally mines these metals out of the ground.
But what it’s able to do is understand those relationships. Again, whether they’re taking place in correlated markets, inversely correlated, leading, or lagging relationships that take place, and it’s using that information to generate true price predictions, and it’s that technologically driven prediction that’s used to construct the value of these tools, turning what were lagging tools that are just going to get dragged around and really reacclimate past price for you, into a forward looking predictive tool that’s going to consistently and accurately get ahead of the market so that you can make these better trading decisions. But it’s not just in this proprietary predicted moving average. We have this indicator at the bottom of the chart and actually a predicted shadow candle you see at the very right hand side of things.
But let’s go ahead and stick to this blue line over below the black line. So whenever we see that value, essentially that prediction of the average moving below the actual moving average, it’s suggesting average prices are going to start moving lower. A lot of different trading strategies and instruments might want to use to express that bearishness. But we see since that crossover coming through, this stocks down 19.5%. And certainly we’ve seen gold futures really get hammered as well, especially silver futures recently, and that’s all driven by the dollar and these global market relationships. So if you’re looking for a place to maybe hedge some of these long positions you might have staked out over the past couple weeks, we have some very clear areas within the resource space where we be seen that weakness, and you can understand how those intermarket relationships would drive things like this.
So moving on to the rest of these predictive indicators that help you manage the opportunity once you identify that blue line crossing below the black line, if you look at the very bottom of the chart, you see this bar. And again, it goes from green to red, back to green, and it’s getting updated each and every trading day before that next trading day. It’s projecting forward. So what it’s forecasting is actually a short term projection of strength over the next 48 hours. I think of it as these really 48 hours of whatever the subsequent candles are. So what this can help you understand is that the overall trend, you’ve identified that, but there may be little flurries of short term strength in that price action.
But as long as that blue line remains below the black line, average prices are still moving lower. So as we go through these forecasts, you’re going to see these situations, where you see it here, here you get a little blip higher, but you go immediately lower, well this indicator driven by that neural network technology is accurate upwards of 80 plus percent of the time. So essentially four out of five times it can help you get that short term strength or weakness projection, but you can also include that with this predicted high and low range, which we look at every single trading week as well in the Hot Stocks Outlooks.
So when we really combine all of this and understand there’s been a shift in Newmont Mining, where might I be looking day in and day out for levels to potentially get short positions? So these levels act really effectively, and I bring this through all the time where it’s a technologically driven tool. It’s just trying to get that level for you. And oftentimes the previous trading day can be very effective to help you identify some really important levels where you want to be paying attention. But you see generally it’s pretty much right on the trading day. You get a very effective entry into the market, but very clearly that you’d only want to short and take profits on shorts. And you see there are about a dozen entries on the bearish side, and as that trend continues, you can pull more out of it and minimize your risk. Take some profits, put them in your pocket and use that to maintain the rest of that position.
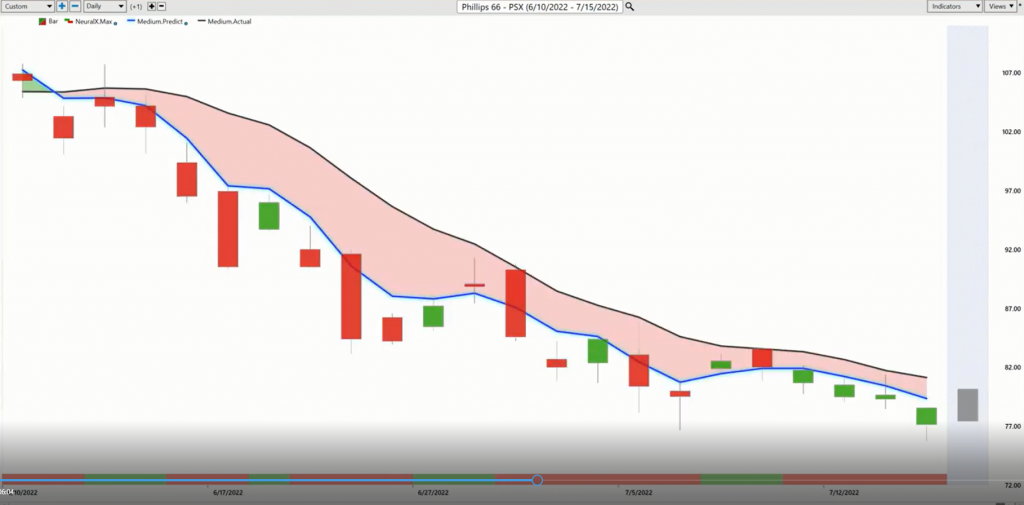
So again about a 20% decline here, but let’s just go ahead and revisit Phillip 66, which we looked at a couple weeks ago, really before we started seeing the 10% moves lower in crude oil, but still the same, recognizing that there’s been a problem here in the energy stocks and the energy futures and energy space generally. So it’s very clear that, look, you don’t want to be long in this area. It’s been really tremendous as far as the rallies to the upside we’ve had at the beginning half of the year here, but clearly recently this is not the time to be long, and we can bring in the help of those shorter term forecasts to help as far as actually putting on some of those positions, if you so choose now.
Again, we forecast for the crude oil futures and other markets as well, but clearly understanding that this is not the week where you want to be buying into energy stocks or buying crude oil futures, and just use the forecast to understand that when the energy energies and commodity markets start trending higher again, well maybe there will be some opportunities there, but when you have things like the dollar index going higher and crude oil prices going lower, makes it very difficult for certain stocks to get moving.
Now we’ve had a really bright spot here in shares of Apple, so I keep bringing this through to highlight that there’s a very important shift all the way back here, really at this midpoint in June, going into really the tail end of June here. And when you recognize that you have a place where you can trade that strength.
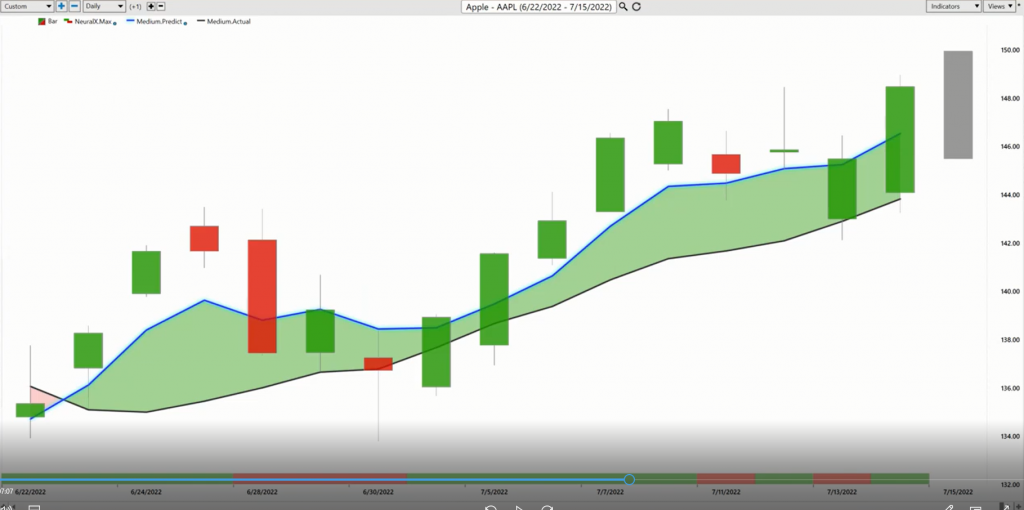
Now you may have areas where you want to go ahead and express that weakness as well and get that hedged portfolio, but this is why this gets very important to not only recognize that there’s some short term weakness, but like I mentioned, use that level identification that you get via this technology to help you know where you might want to look to scoop up some shares. So we looked at this in some detail and I really like bringing this through. When you get a lot of volatility, the software does an excellent job at adapting and getting things right back on track, so the trader can make those better trading decisions.
So like we looked a couple weeks ago at this situation, moving to that previous predicted low, pretty much the exact same thing here. You see all the price action takes place at the higher end here, but it’s just the next trading day where all the sellers come in, you get that gap down, and that’s where you want to know that that’s where you should be expecting this price to dip lower. You get that gap down in immediately the market finding that support and moving higher. So it’s been a very difficult market if you don’t understand maybe where to trade it. The indexes are quite mixed, but if you have those stocks that should stand at as a bright spot, and what the software does a really excellent job is skewing things into that bullish area. So the strongest stocks are going to get the strongest forecast and you can actually use tools like the Intelliscan to help identify those shifts right as they happen, but maybe more importantly, identify the stronger stocks in the market so that you can stick with those and hedge areas where things aren’t looking so bullish.
So here we see shares of Bank of New York, so financial stock. Here’s a little bit of a mix of all the… We got mining, energy, technology, financials here. But what I wanted to actually do is highlight some of the short term forecasting here. So you see this blue line below the black line in a very mixed market here, but you see that neural index goes up, goes down, goes up, and down. And it’s really the combination of these forecasts that’s going to help you as the trader express your trading approach, whether it be shorter term, longer term. However you like to trade, you can combine these tools to really make that fit. So when we come in and bring in the those predicted highs and lows, this is what can really help you understand where are some of these levels where you really want to be looking for opportunities to even cover the position, but also reset the position and resort?
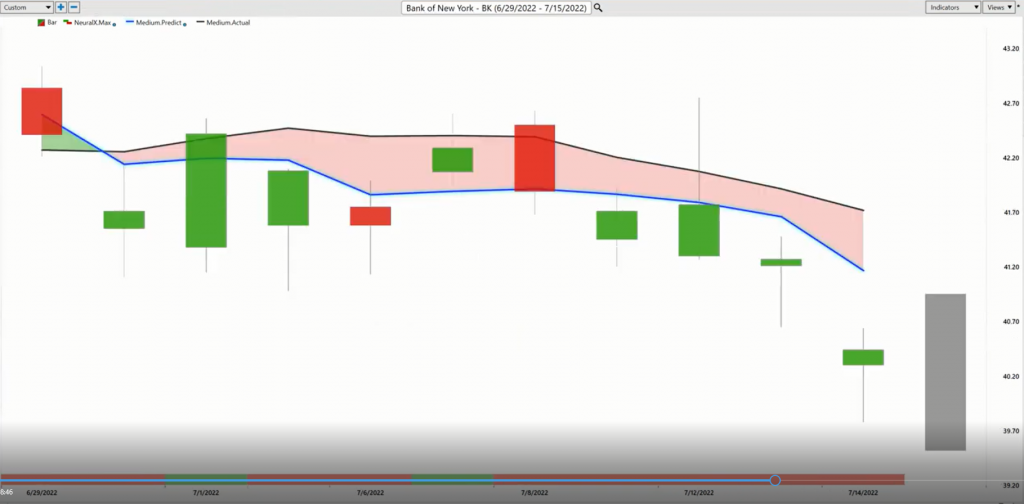
So you see how a market doesn’t really move anywhere, you get a little bit of mixed forecast back and forth with the neural index, but when you combine the short term forecasting of where those levels should be from the predicted highs and lows, this can help you get on that position when not a lot is happening and take some money out of it. So again, there’s these areas in the market where things are quite weak, and that’s why you kind of see the indexes running sideways and shaking all over the place, certain stocks holding up and doing well and other things a little bit more mixed. So I wanted to bring Waste Management through, because this was one of these stocks where we saw this crossover to the upside. I don’t doubt that we might see some strength and things continue here.
But when we look at the short term forecast, and again the accuracy of this neural index being upwards of 80% accurate regardless of Fed announcements, earnings reports, regardless, it’s reaching that very high level of accuracy on really all the markets that are forecasted for.
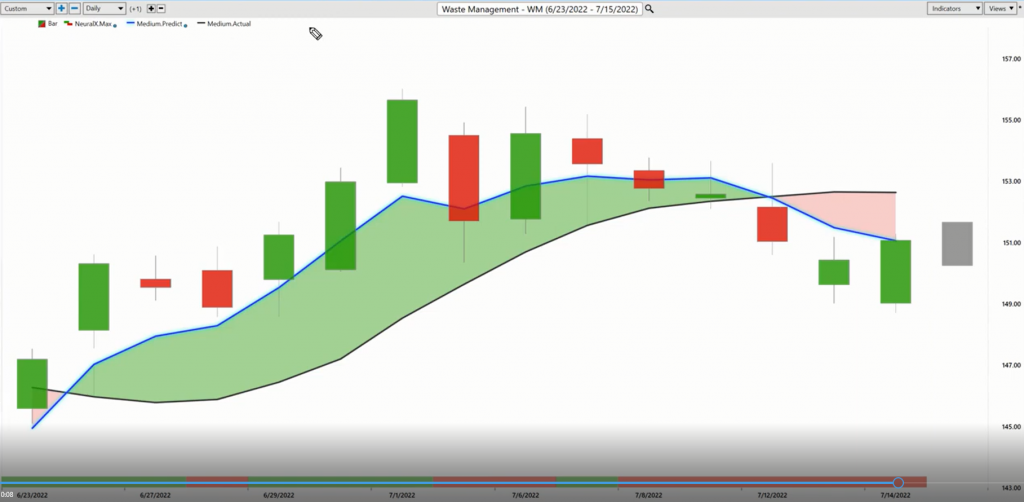
And you see here with Waste Management that neural index really bullish on the way up here, but you’ve seen over the past several days, you’ve got about seven of the eight trading days here that neural index has been bearish and you’ve seen things go a little bit lower. So letting you know, look at the very least look for those weaker prices to come in if you do want to potentially be a buyer still, but recognize that there’s been an important shift there, and maybe focus some of your attention on some of those more obvious areas in the market where that strength is playing out. You can identify some cleaner levels and really clearly define what’s going on.
So you can get in front of it, and much like Apple here, you see about a 8% rally, but going into this very important period where we’re likely to see a lot of volatility, some things potentially going higher and some things looking like they really want to go much lower. You want to know those places where you should stake out those positions, get a really nice entry, so when volatility really kicks up here, you can either have a really nice trade that keeps working for you or take a little profit and move on to something else and wait for these things to line up a little bit more cleanly. So I’ll go ahead and leave it there. Once again, this has been the Hot Stocks Outlook for July 15th, 2022. Thank you all for watching, best of luck, and bye for now.


