


Register for a Free Live Training
The Hot Stocks Outlook uses VantagePoint’s market forecasts that are up to 87.4% accurate, demonstrating how traders can improve their timing and direction. In this week’s video, VantagePoint Software reviews forecasts for SPDR SPY($SPY), Archer Daniels Midland ($ADM), Auto Nation ($AN), Beacon Roofing Supply ($BECN), Boston Beer ($SAM). Schlumberger ($SLB), Phillips 66 ($PSX), Silvercorp Metals ($SVM), United Rentals ($UR),
SPDR SPY ETF ($SPY)
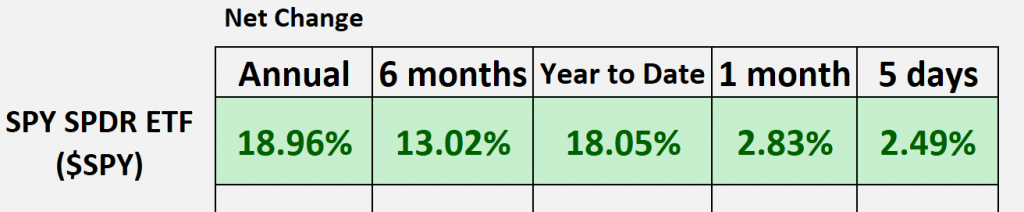
Hello again traders, and welcome back to the Hot Stocks Outlook for July 14th, 2023. I hope you all are having a excellent week out there in the financial market. Certainly bunch of tremendous opportunities really spread all throughout the different sectors of the marketplace. And so let’s go ahead and as we typically do, we can start by taking a look at that S&P 500 ETF, and we can see that we’re up about, well, 19% going back 12 months, pretty similar to that year to date count. And more recently what we’ve been highlighting over the past few weeks is, okay, well the range might expand, you get a little bit of volatility, but aside from really some choice opportunities on the bear side, it’s been full steam ahead and market’s looking extremely bullish here. So make sure if you haven’t already that you can go ahead and click on the link in the description below and get a live demonstration and really learn how these tools can help you make much better trading decisions in the marketplace.
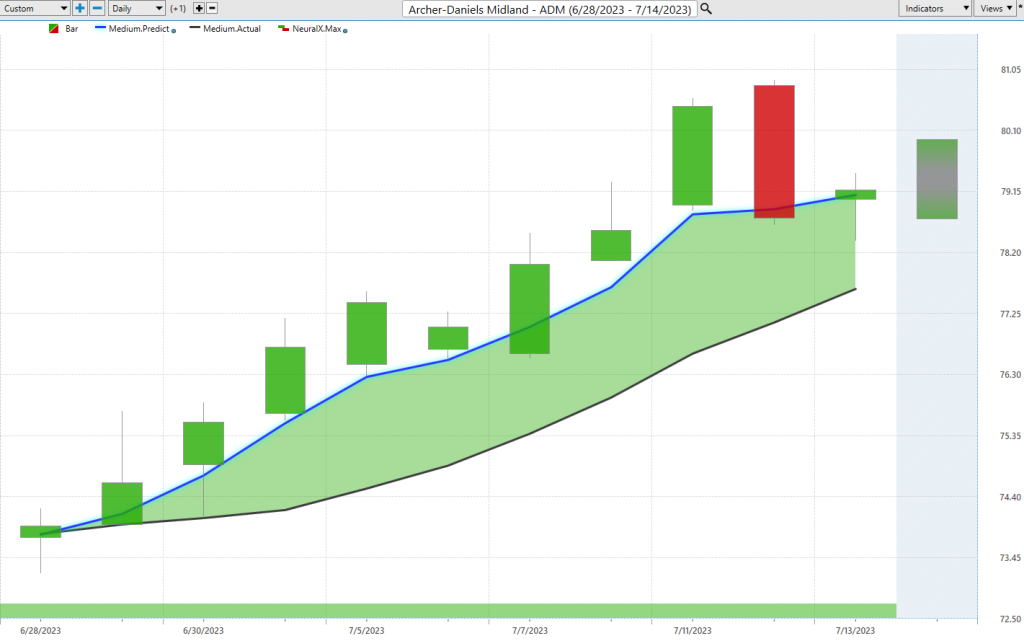
So let’s start out by revisiting Archer-Daniel Midland. So we actually looked at this last week in the Hot Stocks Outlook, and it really serves as a good example to understand how all of these predictive indicators work together. And so what we have here is daily price action. So we can see all of these candles that you see represent a full and complete trading day in the marketplace. And it’s right up against that price data that you’ll notice there is a black line value and also a blue line value. So that black line value, that is actually a simple moving average, very common technical indicator. And in this case, what it does is it looks back over the previous 10 closes, it’ll add those altogether and divide by 10. And so this acts as a good baseline for us as a traders to really know where market prices have been.
But the problem with this indicator and many technical indicators is that they all are just derived from past prices. So they really just lag behind the markets and get dragged around by the most recent price action. And so what we want to do here is compare that black value, again, acting more as a baseline of where things have been, to this proprietary predicted moving average, to that blue value that you see on the chart. And for that number to get plotted and calculated every night for the trader. Well, this is where that technology of artificial neural networks come into play. And so specifically for ADM, what is understood is that there are other markets that are known to drive and influence the future prices here. Well, this being a agricultural stock, well, this can be even things down to soybean prices or corn prices.
It’s going to look at things like the S&P 500 and maybe agricultural ETFs, but it’s even able to understand subtle relationships within individual stock. So this is why this goes all the way down the line and is extremely important to help traders have really a global approach as to how different markets including financial futures, like the value of the dollar index, global interest rates, are all affecting the markets that you’re trading. Another way you can think about this is the relevant data set that is used and plugged into those neural networks to generate highly accurate future price predictions. And so all of that information is going in to generate where that average price is expected to go. So whenever we see that blue line value cross above that simple moving average, well it suggests average prices are going to start moving higher. And so this really acts to solve some problems for traders to say, “Okay, well traditional moving average, they’re only going to be lagging behind the markets and a day or two can make a huge difference as far as identifying an opportunity in the marketplace.”
So this is where these tools really are robust and do a very good job of leading the marketplace. And you see we’ve gotten about a 7% rally in just the past 10 trading days, but you should really think of VantagePoint as more of a suite of these predictive indicators that you can use and combine with your trading strategy to really make most of each of these opportunities. And so if you look at the very bottom of the chart, you’ll see this green bar, and as we go through subsequent charts, you’ll see that it goes from green to red, but what it’s helping the trader understand is very short-term strength or weakness over the next 48-hour period. So in a sense, you can plug in and write what is the problem that needs to be solved by those neural networks? Well, in this case it’s short-term strength or weakness over specifically that 48-hour period.
And lastly, we’re given a predicted high and a predicted low. So again, this is a totally separate neural network solving this problem of where’s the intraday predicted high likely to be? Where’s the intraday predicted low? What’s going on over the next 48 hours? And then that highly accurate forward-looking prediction of average prices. And so when we really combine all this, and as we do each week look back at those predicted highs and lows, well, this is actually where we were Friday and we highlighted that, okay, well expect the market to maybe trade lower to this predicted low, but the neural index is bullish and you see that lead to a really nice advance. You get a little bit of volatility here as you see all of that price action is just so bullish at the top end. You don’t get down to these predicted lows, but you see how you get that shaking around, neural networks come back online and doing a extremely good job for the trader to keep managing the opportunity at hand.
So again, about a 7% move in ADM, but a really great example of updating the forecast, seeing how these tools work and how they’re going to update each and every day to help traders adapt to those changing market conditions. So as we move forward here, shares of AutoNation, and it’s the exact same approach here. You have that blue line crossing above the black line, neural index bullish, but what you’ll notice is along the way, well neural index gets bearish. You have some weakness over the next 48 hours. Actually in this case, you see that markets actually trading, actually below this low even 48 hours later. But you see how these tools adapt, neural index gets bullish. You’re still having that blue line very strongly above the black line and every single one of these trading days. So as the market advances from really the 140s up to about the 180s here, you have a 31% rally over 28 trading days, but maybe you’re a shorter-term trader, maybe you want to get aggressive as that market moves into profit for you.
Well, this is where those predicted highs and lows can be very effective. So once you’ve set that directional bias and you have that anticipation of, okay, well if you can deal with the volatility over the 48-hour period here, you may want to be buying down at these predicted lows as the market moves into those, again, predicted areas here. So you see some really nice entries here early on, and that gives you the opportunity and make the most of the opportunity, right? So here at these predicted highs, you come off a little bit, those are often really nice opportunities to take some profit and reload up the bag here, right? So again, it really come down to your trading style and timeframe, but when you have these tools that are going to really be an excellent roadmap, well, you can really make intelligent trading decisions and make sure that you really recognize all this strength coming into the marketplace.
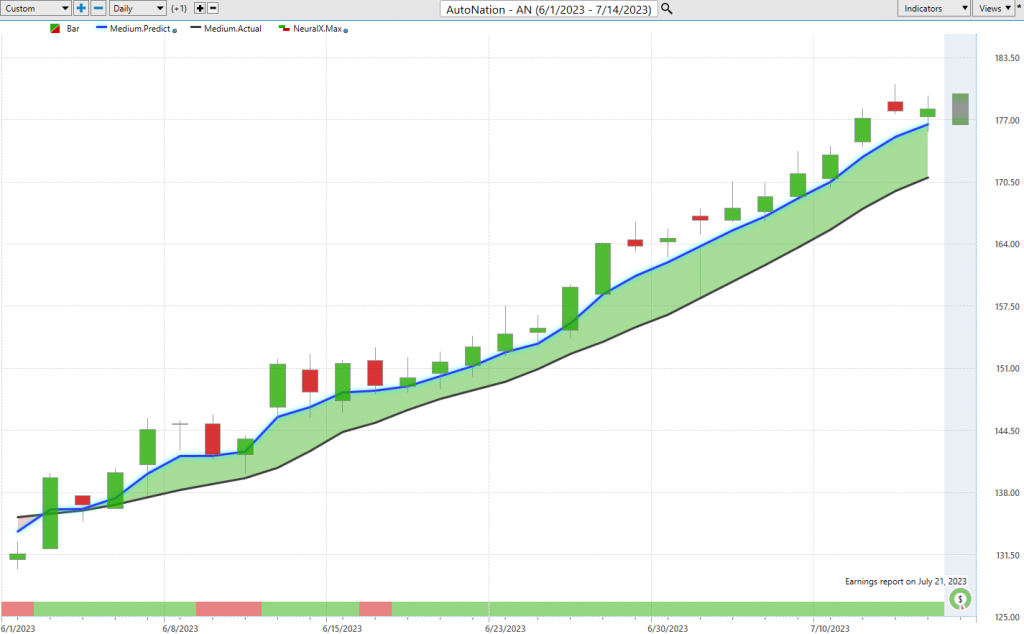
So whether it’s ADM, we got AutoNation here.
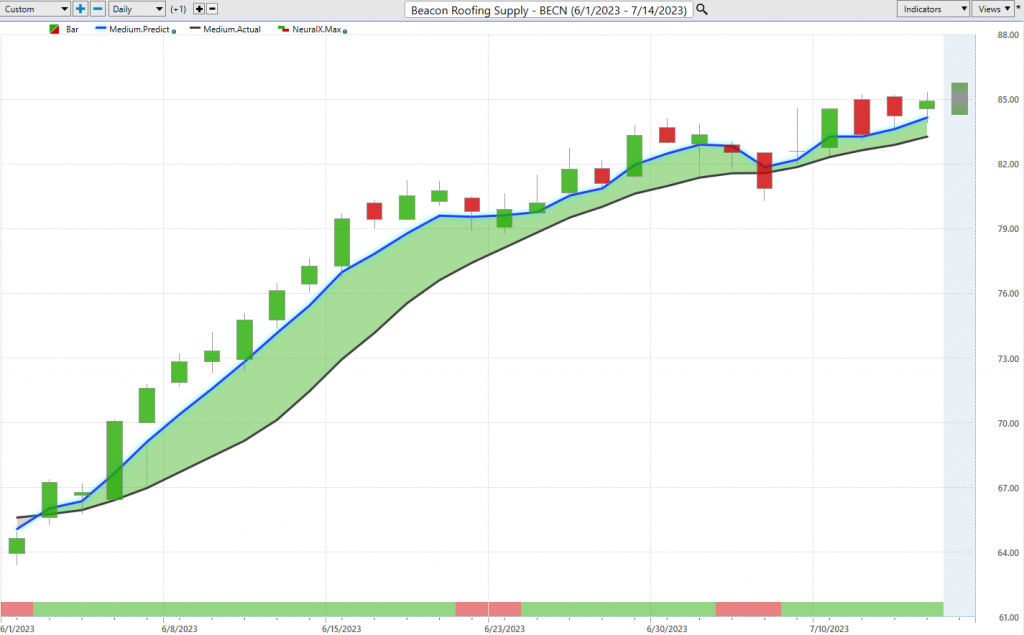
Here’s Beacon Roofing Supply. So moving over to some capital goods. You see that crossover blue line over the black line, neural index, very bullish. Now you get these little spats, again, 48-hour periods where there’s some short-term weakness in the market, but as long as that blue line remains above the black line, it’s suggesting average prices are above that lagging moving average, and you’d expect the trend to resume higher. Here we have about a 28% rally over 28 trading days, but a 500-share position there has up almost about 10 grand just in the past 28 trading days here. So again, we’ve seen so many markets all through the summer do extremely well, and what you want to do is get in early, recognize those shifts and get those really nice positions on at those VantagePoint predicted lows.
Now, we haven’t seen much bearishness. I certainly encourage you to go back and watch the previous Hot Stocks Outlook. We sort of zoned in on Zencorp, and it gets back to this point of think of how bullish the markets have been. The S&P is just moving higher. You got things gapping up, going crazy, but for some reason Zencorp couldn’t get going at all and is still down towards its longer-term lows here.
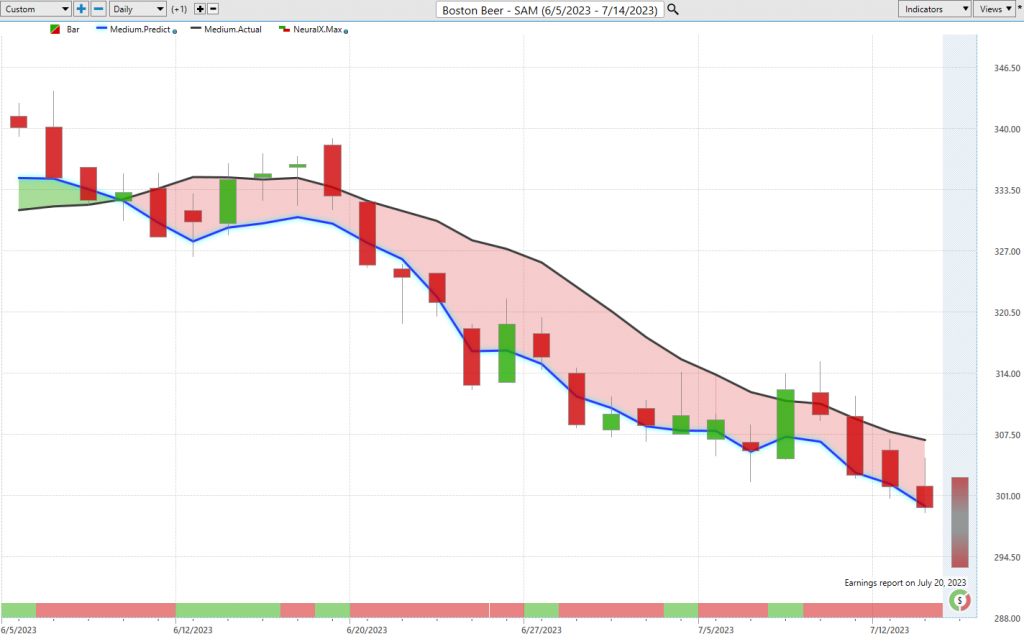
Here’s Boston Beer. We have this crossover to the downside, and you’ll notice how all these tools work together, right? The overall trend is down, but especially on the bearish side, you may get these moves where some short-term strength comes in over those subsequent 48-hour periods.
But what happens is those neural networks do a good job of skewing the indicators to remain bearish. And you see how that predicted moving average still has quite a bit of separation from the actual moving average. And as we take that information and potentially combine it with things like the VantagePoint predicted lows, it offers an excellent roadmap to make some better trading decisions and be patient waiting on better prices, especially in some of these intraday timeframes that you might be participating in. So again, not a lot of bearishness out there, but clearly VantagePoint doing a good job as far as highlighting those markets that you can just either avoid or potentially set up some hedges in the portfolio. You got all these things doing extremely well, making a lot of money on the bullish side. Well, where you see bearish forecast might be a good place to go ahead and balance things out a little bit on the portfolio level. So again, about a 10% decline just in the past 23 trading days in a market that’s essentially gone straight up.
Now, more recently, we’ve seen a lot of exciting things picking up in the commodity space, whether that be oil, whether that be steel, copper, gold, I mean all of these commodities actually picking up and doing fairly well here. But energy has been a big part of this, right?
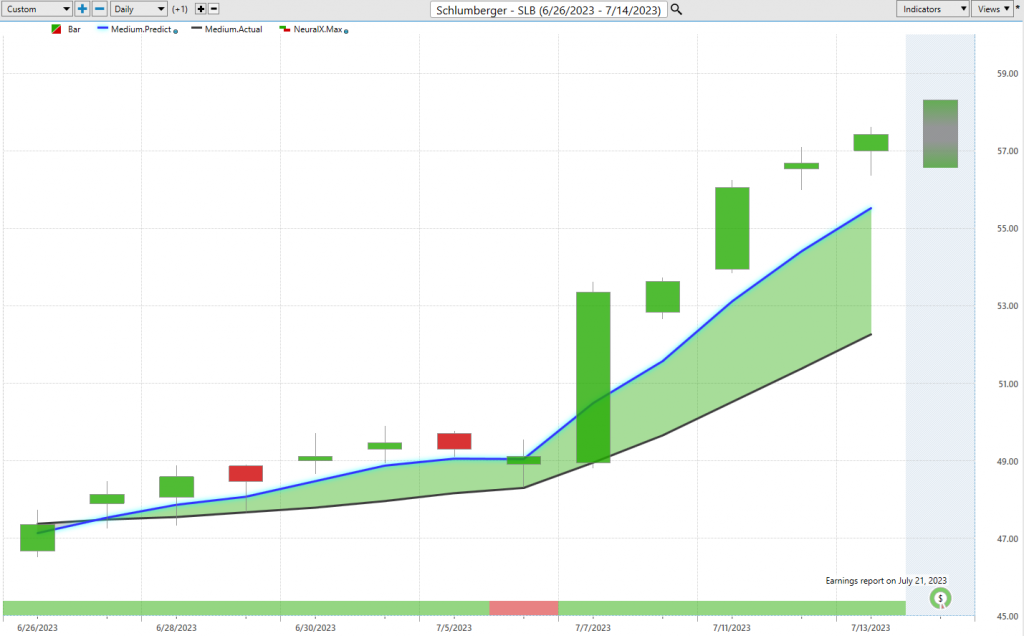
So here’s Schlumberger, and we’ll also have Phillips 66 here, these energy stocks, but you see these forecasts getting very bullish. And so, this is where traders who are utilizing tools like the VantagePoint Intelliscan, can set up a process by which they’re going to see these fresh crossovers coming through and identify those areas of the marketplace where sometimes you don’t see this in the commodity itself, in the crude oil contracts, it really becomes evident through the stocks picking up first and really leading the way.
So here in shares of Schlumberger, you see that blue line crossing above the black line. And again, we can bring in those predicted highs and lows to really lay out that roadmap of, okay, where are you actually looking to accumulate a position here? And you see on this intraday level, and then also within the bigger trend, excellent levels to go ahead and take action and start participating. So once again, we’ll take a look at the overall move here, but this stuff is moving and certainly something you want to be aware of. So about a 20% rally in just 12 trading days, again, not a huge position there, making you quite a bit of money on the bullish side. And to that point of seeing these crossovers come through, well, here’s Phillips 66, and you see Schlumberger really led things, and that’s what you’ll really identify as you set up that process with these predictive indicators and see some of these sector rotations start to come through.
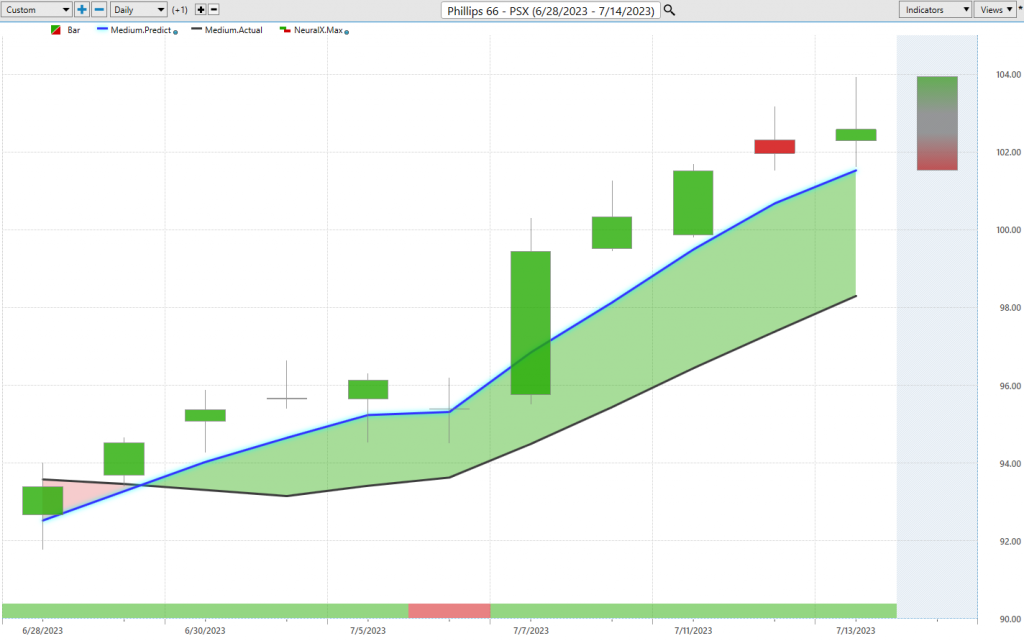
So you see more recently in Phillips 66, we get this crossover to the upside. All the logic remains the same, right? As use these predictive indicators and you want to think about your money management and trading style and timeframes that you like to work in. But these levels are extremely valuable for the trader to understand, okay, that’s where the opportunity is. That’s where we can accumulate a position. And you see how intraday this market is closing above those levels and getting ready to move. Even here more recently on the top and how it does excellent job. If you expect the trend to be up, well, you’d want to leave some of that position on, but there’s really great opportunities to take some profit, manage things and even accumulate more at better prices. So really nice move there in Phillips 66. Again, we take a look at the overall move here, about an 8% rally and about nine trading days. Again, just even 100 shares has yet pretty good there.
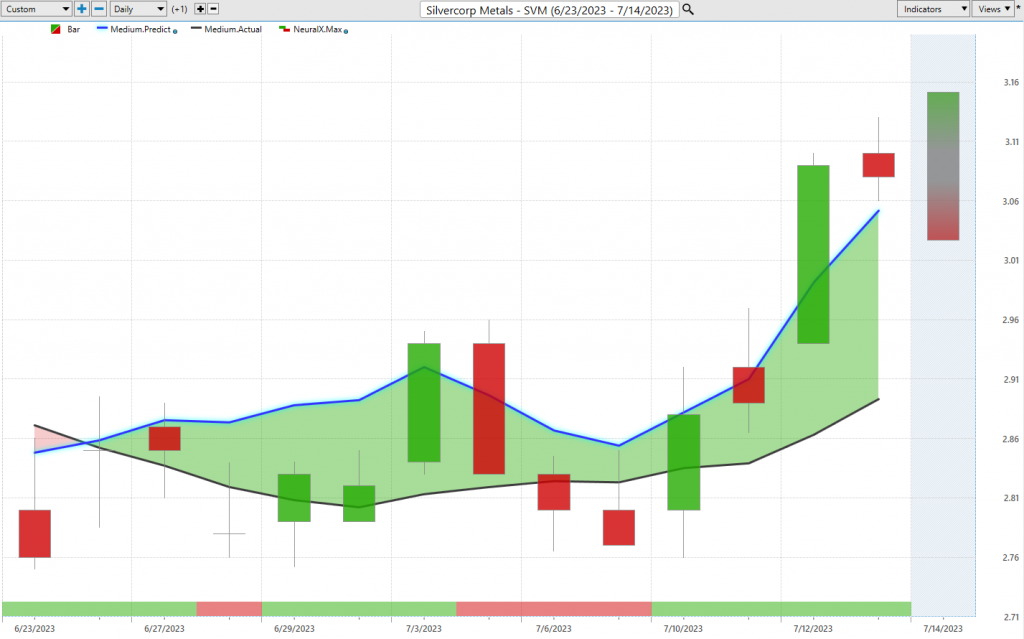
Moving over to Silvercorp Metals. And so this is a really interesting one where on the commodity side, you really see all these metals, copper, everything’s starting to move higher. Look at this stock chart here. You get this blue line crossing above the black line, a lot of chop and sideways price action. But very clearly, that blue line is very solidly above that black line. You have a couple of these areas where the neural index gets bullish and we see that subsequent weakness in price over the next 48 hours. But once that neural index gets bullish again, well we’re really moving here. So those predicted lows that are being spit out here, well look at that. That’s just about perfect here. You get a big gap down, the market closing down at that level and then almost really never looks back from that point on and just keeps pushing to that bullish side. We get this other pullback right here and off to the races, things are moving as the markets start moving higher, and really the dollar has just been really taken it on the chin here. And so that’s going to play into the metal markets and through the basic material space.
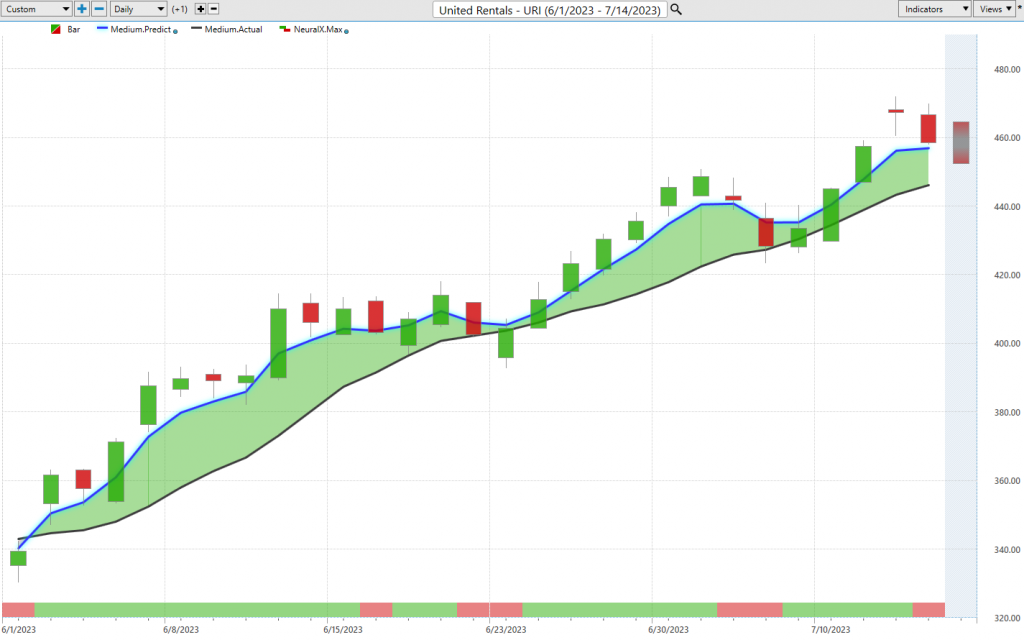
Lastly here we’ve got United Rentals. Again, just another example of how all these tools work together, right? That blue line above the black line, neural index very bullish. Here comes your sideways consolidation phase, another period about 48 hours of weakness. But how do you want to be thinking about the market? Well, you want to be positioning yourself as a buyer. Utilizing the short-term levels, like predicted lows would make the most sense here, sort of following this logic that we follow week-to-week here of how these predictive indicators can really set up that roadmap for you.
So really nice rally here. This one really coinciding with just all this strength we’ve seen really since the beginning of June and straight through July. And then even more sectors like the energies, like the metals coming along for the ride as well. So you see about a 31% rally, about 28 trading days. And again, I don’t know why this says 21 shares here, but 100 share position, you’re up about $10,000, just about 28 trading days. So again, I really encourage you go back and watch many of the Hot Stocks Outlooks, and we’ve just been highlighting this that yeah, things look really bullish. It looks like we’re going to see a lot of high profit potential as far as those percentage gains. And here we are after a couple months of some really nice action in the market. So once again, this has been the Hot Stocks Outlook for July 14th, 2023. Thank you all for watching. Best of luck, and bye for now.