


Register for a Free Live Training
The Hot Stocks Outlook uses VantagePoint’s market forecasts that are up to 87.4% accurate, demonstrating how traders can improve their timing and direction. In this week’s video, VantagePoint Software reviews forecasts for AMD ($AMD), National Beverage ($FIZZ), Helmerich & Payne ($HP), , McCormick and Co. ($MKC) and Goodyear Tire ($GT)
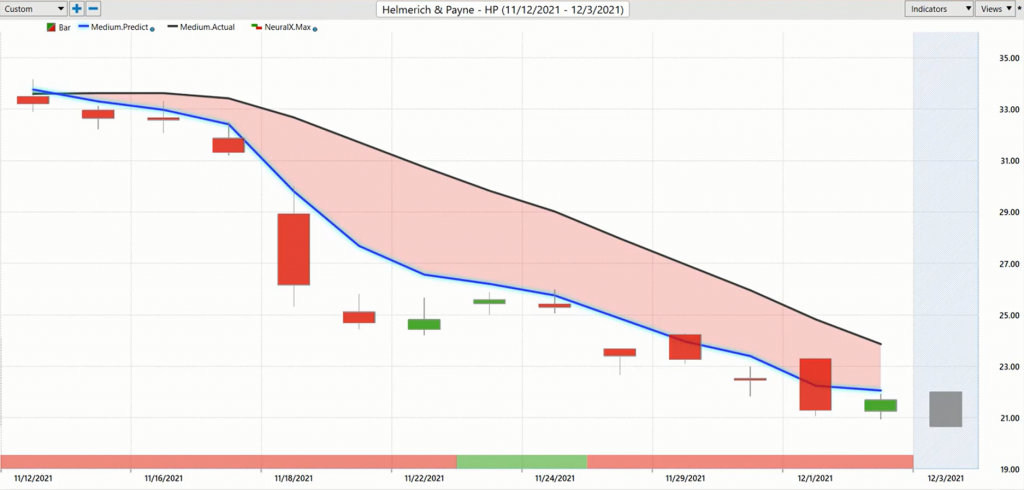
Hello again, traders and welcome back to the Hot Stocks Outlook for December 3rd, 2021. Hope you all are having a excellent week out there in the financial markets and as always plenty to cover and catch up on in our Hot Stocks Outlook. Now we’re going to go ahead and we’ve got a H&P, Helmerich and Payne energy stock, which we looked at last week. We’ll also take a look at AMD. We’ve got Goodyear Tire, McCormick and company, and lastly, National Beverage. So just want to highlight, really, what’s going on in the energy space and so what we identified was that energies and actually some financials started to show some weakness and so this chart for HP is just a really good example of how all of these tools work together to really help the trader as they navigate, really a lot of the volatility that we’ve seen recently here, right?
So what we have here is daily price action, and all of the forecast work in exactly the same way with that end of day data and so what you’ll see is, you see that there is a black line and also a blue line right up against the daily closes and price action, those candles. Now what that black line that you’re seeing is, that is a simple moving average. It’s a very common technical indicator, and what it does is it just looks back over the previous close prices in this case, the last 10, adds those all together and then divides by that number. So it acts as a really good measure to smooth out the existing price action and let us know where market prices have been. So that’s the actual, simple moving average there. But what we need to do as traders is be ahead of the move and know where prices are expected to go ahead of time.
And so what we’re able to do is compare the value of that black lagging, moving average to this predicted moving average and for this value to get plotted and generated each and every trading day, this is where the technology of artificial neural networks come in. So what vantage point is doing is it’s looking at known relationships that drive and influence this specific stock. So we refer to this as the target market and so that’s going to be things like, the broader stock indices, like the S&P 500. That’s going to be things like individual stocks or ETF groups, but it’s also going to be very important things like the futures market for crude oil and Brent crude and international energy prices. I am going to look at things like interest rates, as well as global currencies that are… Energy is being priced in dollars and things like this.
So it’s very important to look at these relationships, but that’s the whole thing, there’s so much information. There’s so much valuable clues to be derived via that information. That what vantage point is able to do with that technology is actually, use that information to generate a true price prediction of where things are headed, going next. And so what we’re able to do is take that price prediction, and actually build it into the value of these indicators, turning what were lagging indicators that are just going to get pulled around by what’s most recently occurred in the market into a forward looking predictive tool. Now in that same approach, that’s using those predictives or using those price predictions to make essentially predictions about the market. At the very bottom of the screen, you’ll see that this is another indicator. You see it is a bar that goes from green to red, back to green and this is also utilizing that technology, but it’s just tuned differently. It’s tuned to a different timeframe looking ahead, only 48 hours.
So letting you know about very short term strength or weakness in the market that may take place within a trend or within some directional bias that you have, and lastly, to really round out the forecast, and this is where it really all comes together is vantage point provides a actual predicted high and low intra-day, right? So before the trading day occurs, you have a prediction for the high and the low, for the next trading day, and that’s, what’s going to make it easy for traders to set limit orders, profit targets, and manage things based on their timeframe and their approach. So here we see this cross over the downside, a really excellent entry, we covered this last week, but what I really just want to cover this week is, all right, well, we knew that energies are weak. We understand that this is a stock within the sector that may experience that weakness along with energies and if you’re just following the forecast, you see that in this case, you’re going to get filled right at the open, right?
If you have a limit order waiting at the predicted high, the market opens, immediately moves lower. You see the market moving forward still here, but the point being of just these tools, doing an excellent job week-in and week-out, guiding the trader on how to move forward and how to manage these trading opportunities. So, obviously a huge move out of the crude oil futures, and that’s had some drastic effects on things, but we also saw… We looked at some of the financial stocks. We’ve seen some of this weakness come into the market, and there’s very straightforward ways to get some exposure to that, but also manage it even over the past several days with the help of these short term tools.
So a 35% decline in the past 13 trading days, about 500 shares, about $5,700 move to the downside, but let’s look at AMD. We looked at this last week as well, and a really good example of a nice stock through October, where we saw all this strength in. We know… You look at all the Hot Stocks Outlooks previously. They’re all bullish going all through October, really get out of the shorts from, talking about Facebook, was really the last one and that actually kept bottoming out until the end of October before it actually turned around, but we saw this market shift and now we’re seeing it again. So we know that there’s weakness. We see this big move lower, crossover the downside, and now suggesting that look,
it’s been a great run here for AMD. There’s been a lot of money to be made, in this case, on the bullish side of the market here.
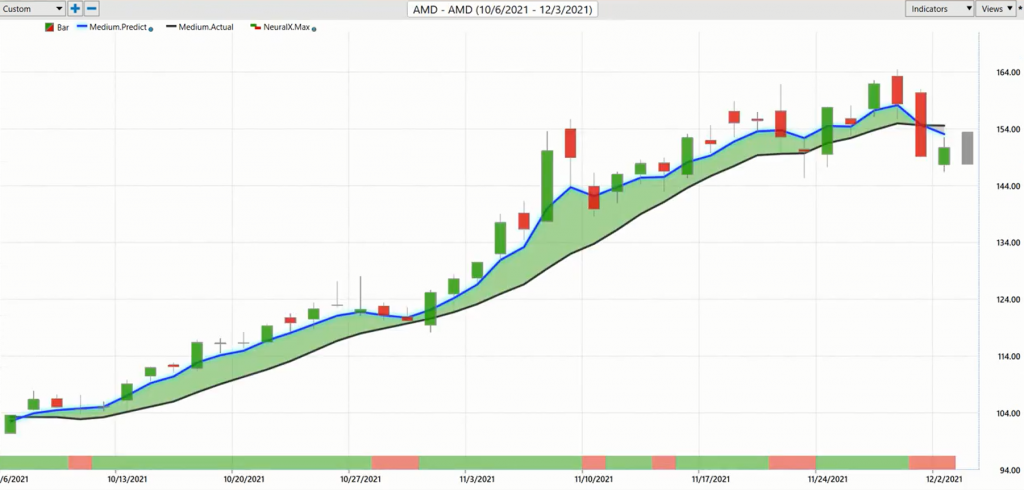
But when that blue line crosses below the black line, well, it’s a good time to go ahead and take some profits or in fact, look to short the market. So you’ve got a 49% rally in 37 trading days. If you understand their strength in the market, you’re trading AMD, you have the potential to make a unbelievable amount of money over this time period and we can come in again with the help of those predicted highs and lows. So not only is there a 49% rally in the market, but there’s 1, 2, 3, 4, 5, 6, 7. Some of these are kind of close, but a good dozen or so entries here, over that 49% rally there. So over this entire month, you want to be a buyer taking profits, and then conversely seeing that all reverse as well.
So understanding when to stop that behavior, reverse course and don’t look for something else. Wanted to bring in Goodyear here, because yes, we’ve seen a lot of weakness and a lot of these crossovers to the downside, but just some of these things are a little choppy, right?
So here’s the help of the neural index. It’s going to let you know… How I like to look of it as, when there’s a likely to see some price action above those predicted moving averages, right? So you’re getting some higher highs coming through over the next 48 hour period, but the overall trend is down and you can see how you don’t want to lose sight of that, because the market is gaping lower.
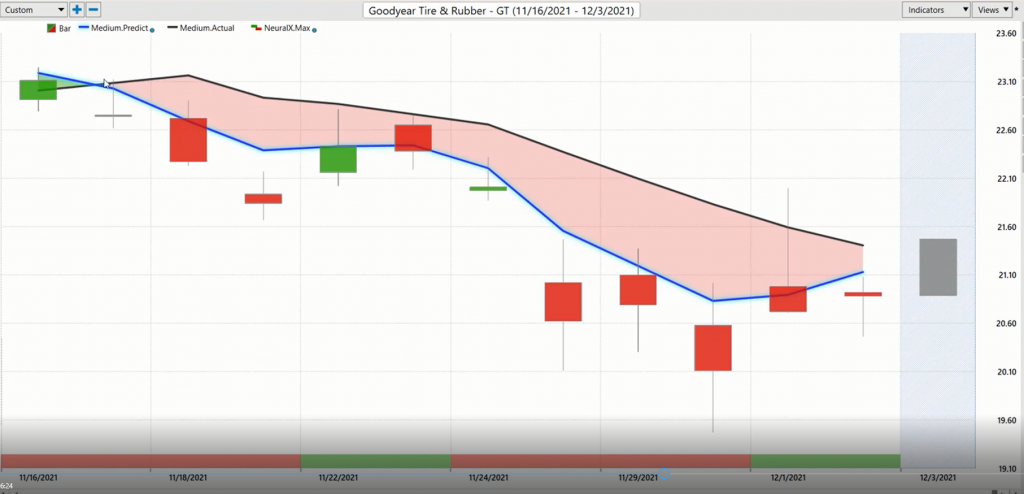
Certainly not going to be a good position. If you are on the bullish side, then we can again look at those predicted highs and lows to help guide you and here you’re going to have these times where you’re going to see volatility and you’re coming out of the range, but really what the software does excellently, is even those days where you see that you actually do close, very close to the high, but when you have those days where you come out of the range, or there is a lot of volatility, the software does an excellent job of looking at that market, plus those inner markets, figuring out what went… what happened there, and get all those forecasts really back on track.
So while a lot of people are really hesitant to probably interact with the market because there’s things moving around and the predicted highs and lows are getting spread out. Well, that’s the point, it does a good job of accounting for that volatility and providing levels to where you can take advantage of a lot of these… Again, things moving around quite a bit here throughout the equity markets.
So here’s McCormack and Company, a good example of a stock that has been very resilient in a very bearish period. So you see here that you never get this crossover to the downside here. As far as the blue line and the black line, you get a little bit of volatility as the neural index gets bearish.
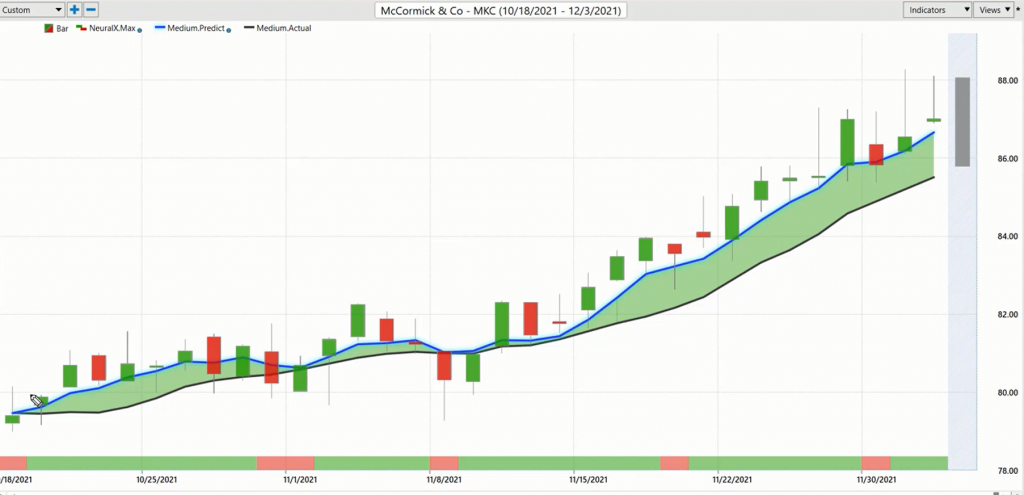
You see these lower lows over those subsequent 48 hour periods, but the blue line is still above the black line, and so you’d want to look towards, again, predicted highs and lows over the period. Would be good levels to buy at the predicted lows look to target the predicted highs. So in areas like this, here you come out of the range a little bit. You don’t break or anything like that, but you see how the very next day, all of these forecasts do a really excellent job of just getting right back on track and letting you know, okay, how to manage this situation and make the most of it here. So McCormick, one of the better companies here holding up over the past couple of weeks as we’ve seen oil and the stock markets make a move lower. But a little about 8% rally, not a huge moving sock here, but still just recognizing that that is a extremely bullish forecast and there have not been… They’ve been few in far between, as far as very strong markets out there.
Here’s National Beverage, and again, just another example, this one really tying in with the S&P as far as that weakness coming in and just very, very weak. Just telling you, look, there’s no reason to be long here. If you’re going to trade and if you’re coming into the market, looking for areas to exploit to the downside, well, you’ve got that roadmap to help you. Not only about which markets you may want to look towards, but intraday, where might you want to set those limit orders to make sure you get a really good intraday price and aren’t chasing things that are really going to compromise how much money you can really pull out of that opportunity here.
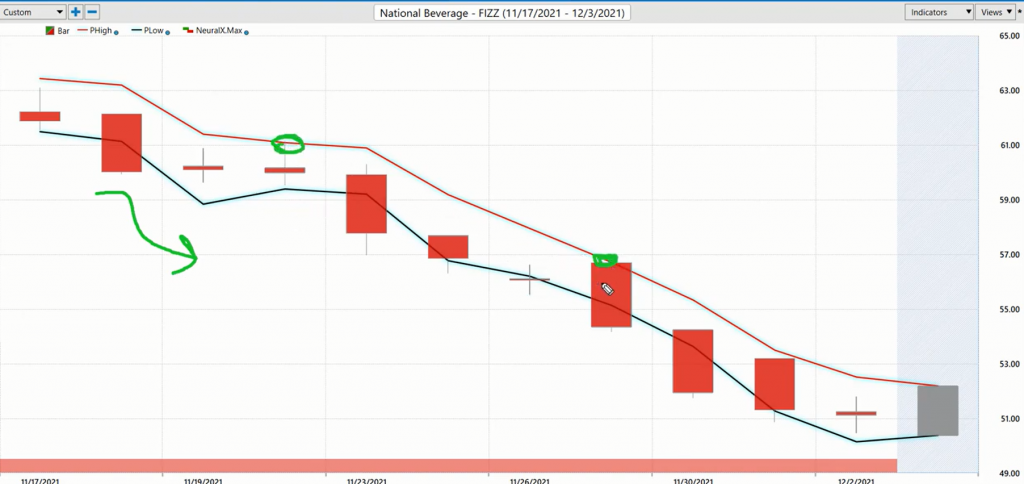
So we’ll take a little look here, pretty aggressive move a lower here, about a 15% decline there in just the past eight trading days. So again, we have seen things shake up, right? So we had this nice smooth October, and we start to see the market shift with the help of these predictive forecasts and it really gets you ahead of a lot of the market volatility. A lot of the things that certainly are likely surprising to a lot of traders out there in the market. So once again, this has been our Hot Stocks Outlook for December 3rd, 2021. Thank you all for watching. Best of luck. Thanks again. And bye for now.

