


Register for a Free Live Training
The Hot Stocks Outlook uses VantagePoint’s market forecasts that are up to 87.4% accurate, demonstrating how traders can improve their timing and direction. In this week’s video, VantagePoint Software reviews forecasts for Ross Stores ($ROST), Fifth Third Bancorp($FITB), Nucor ($NUE), Ford Motor ($F), Apple ($AAPL), and Texas Instruments ($TXN)
Hello again, traders, and welcome back to the Hot Stocks Outlook for August 19, 2022. Hope y’all are having a excellent week out there in the financial markets and as always, plenty to cover here in today’s outlook. Now, if you haven’t already, make sure you click on the link in the description below, get that live demonstration, learn more specifics on how this technology can help you make better trading decisions each and every trading day and every trading week.
Starting out here, we got Ross, Fifth Third Bank. We have Nucor, Apple, Texas Instruments, and lastly, Ford, and we’ve looked at a lot of these stocks. I really encourage you to go back and watch all the Hot Stocks Outlooks really from mid-June because we’ve had such a great run here in the market, but things may be shifting here and you want to have a tool that can understand these intermarket relationships.
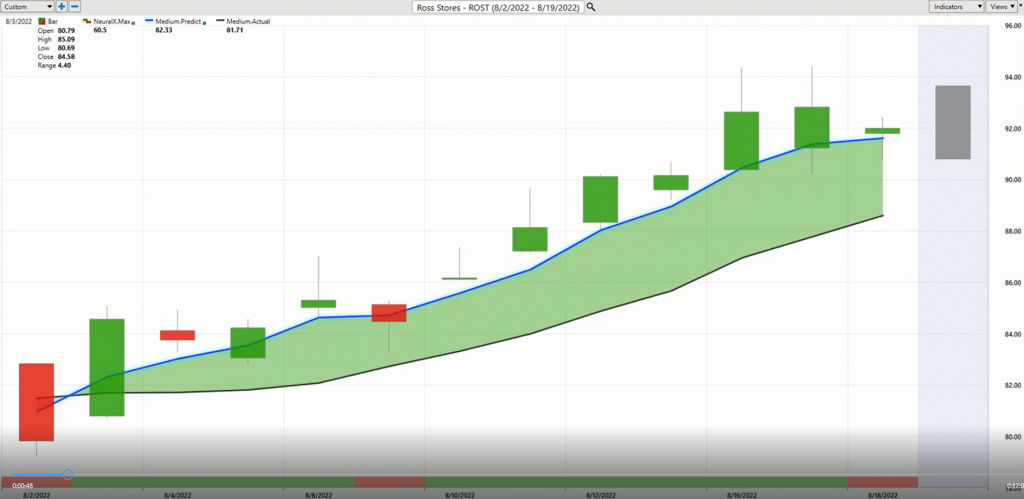
Let’s take a look at Ross Stores. Now, what we have here is daily price actions. You’ll notice that all of these forecast really work exactly the same way, whether you’re trading Ross or crude oil prices or currency futures. And so, what we’re able to do here is actually look back at daily candles. Each one of these candles is representing a full and complete trading day. Right up against all that price data, you’ll see a black line and also a blue line there.
The black line that you’re seeing there, that is a simple moving average. That’s a very common technical indicator. In this case, what it does is it looks back over the previous 10 close prices. It’ll add those all together and divide by 10. What it does for us is it smooths out the existing price action. It lets the trader know where the market has been over a given period of time, but a trader really wants to know where’s the market going next so they can be ahead of that next move.
And so, what we’re able to do is actually compare that blue value to this black line. For this number to get calculated and plotted against the chart each and every trading day, this is where the technology of artificial neural networks come in and perform what’s called intermarket analysis. Now, this is very important here because really going into this week, we actually saw a lot of strength out of the U.S. dollar index. That can typically put a little bit damper on stocks. We’ve seen commodity prices really go lower. If you look at wheat, gold prices had a really tough week here, but the forecasts are very good at looking at that individual marketing question and say, “Okay, well with Ross, how is the broader markets like the S&P affecting things? How are things like the dollar index or crude oil prices or even individual stocks and ETFs within the same sector or group, right?”
It understands those market relationships and actually pulls out very interesting clues, some information, valuable information that can be used to predict future price. It’s taking those future price predictions or that intermarket data essentially, and actually using it to generate price predictions and using that to construct these indicators, turning what were tools that just look at the past and get dragged around into forward looking predictive tools. Whenever that blue line crosses above the black line, well, it’s suggesting average prices are going to start moving higher. You might want to look to take long positions, but you can adjust according to your trading strategy and timeframe here. But the big thing here, you got Ross Stores have moved up about 12% over the past 12 trading days, not a bad move for a couple weeks of action here, but that doesn’t really round out the entirety of the tool set here.
If you look at the very bottom of the chart, you see you have this bar that goes from green to red, and it can go from back to green, back to red. This indicator is also utilizing that underlying technology. It’s again doing that inner market analysis, but it’s tuned to solve a different problem for the trader. That problem is short-term, and that means 2 days, 48 hours, short-term potential strength or weakness in the market, and it gets this right with a accuracy upwards of plus 80% on the broader range of markets. You can think of that as essentially getting this problem right four to five times, in addition to your predicted moving average that we have here right up against the chart. We also provide a predicted high and a predicted low, so actual intra-day price action to help you make those trading decisions.
I want to go through this in detail and really highlight that, okay, well, let’s look at those predicted highs and lows and we can see what did the price action, what did the actual market data look like against what actually occurred. Because we have the prediction always the day before the actual trading day. If you’re trading Ross Stores or you’re looking for things to get involved in, well, you see Ross Stores coming into this day, you have a bullish forecast, neural index cross over the upside and this level right there is going to stand out to you as a good opportunity to potentially take a long position in the stock.
Certainly, we can see that of all the times to take a long position, that was a very good moment in time. But depending on your trading strategy, you may get in before that, recognizing this trend reversal, but you may want to add to the position recognizing that, hey, it’s a very short-term timeframe. You can put on a position and this market isn’t an uptrend and should remain higher. You see, just in the last eight trading days, the market up another 9.75%. You see most recently here though, that neural index getting a little bearish here. And so, you may see some weakness up at these predicted highs or the market want to move down towards a predicted lows and you can make those adjustments accordingly.
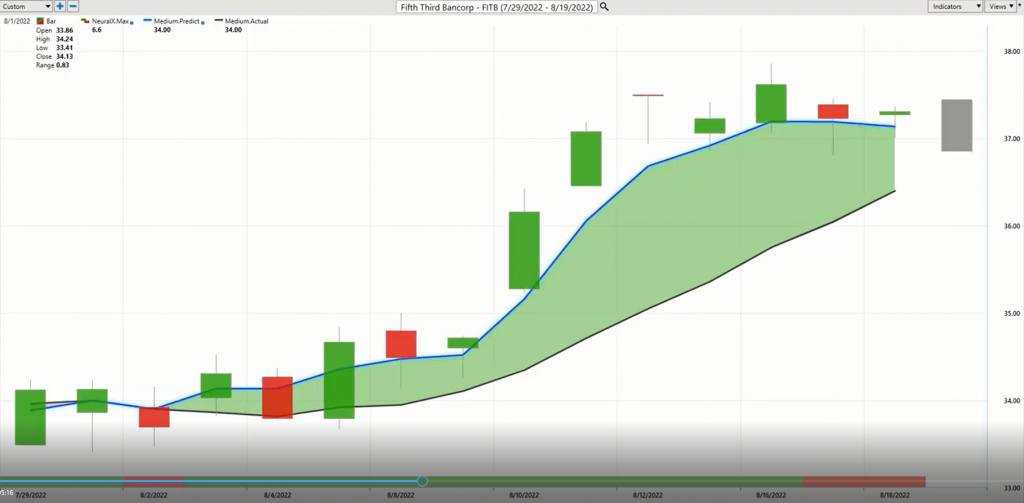
Here’s Fifth Third Bank. Again, I just wanted to highlight how these tools are going to work and help you really focus your attention. Here in Fifth Third Bank, we actually have a crossover back here. We have the blue line crossing above the black line. It’s actually remaining at the exact same level here. They’re right on top of each other, and I’m bringing this through really to highlight that these tools do different things for the trader. They solve different problems, so that predicted moving average can really help traders recognize trend shifts in the market and we can utilize tools like the IntelliScan feature to actually drill down and recognize those signals right as they come through, so you can see whether it’s happening in the banking sector or discount, retail or metal and mining or technology stocks.
And so, this really makes the trader alert to understand, okay, well, if I want to get long here in Fifth Third Bank, you see that we eventually get this very strong crossover with that blue line, creating a lot of separation from the black line, suggesting average prices are going to start moving higher. You’ll also see the neural index. It’s a lot of strength for the duration of this forecast as the trend moves higher and you really bring in that last piece to round out the forecast, really taking all the disparate pieces of this technology to round out that prediction essentially.
And so, we can say, “Okay, well, what did all of these predicted high and low levels look like on the actual trading day?” Again, we can see just how effective all these tools are on the downside here, as far as getting a good position at a very good price, but also as a potential area to take profits. As this market accelerates and all this strength comes through, well, again, you see things kind of run sideways. I mentioned this again because that dollar index has started to become strong and you’ve seen a lot of markets that have been very strong run sideways. It hasn’t been a bad week to take some profit and at least get some better prices. These tools like the VantagePoint Predicted Highs and Lows are really great tools to help you do that, take profit, look down at better levels, and make those trade adjustments that really reduce the risk and the overall exposure that you have to take to get some exposure to that opportunity. And so, about a 9% rally in just the past 12 trading days there in Fifth Third Bancorp.
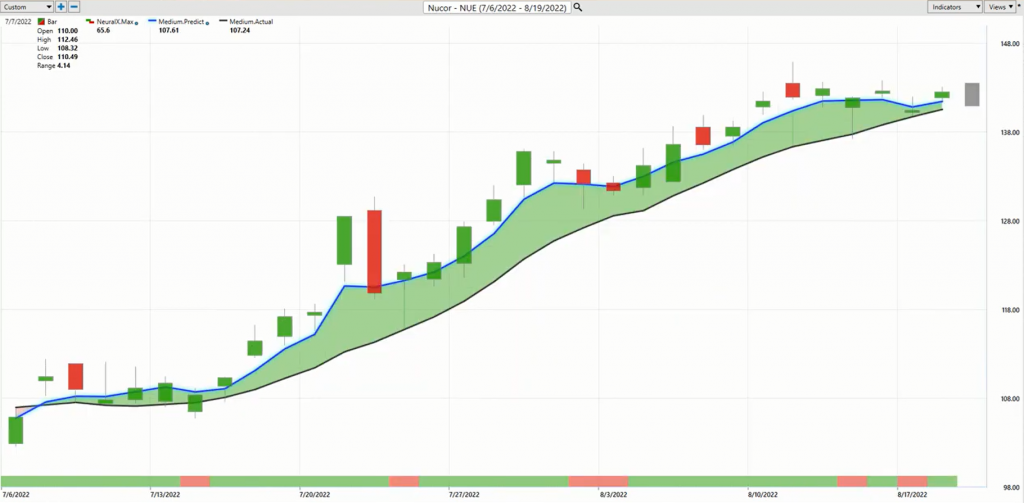
Here’s Nucor. This is a steel metal mining company here. Here we have this crossover to the upside and a huge rally here. But again, I wanted to highlight that going into the week, strength in the dollar index, you see this neural index getting bearish and sort of going back and forth as this market runs sideways. We can see those predicted high and low levels. If you’re still trading Nucor from a couple weeks ago as these forecasts have remained bullish, well, you see that these acting as good levels to maybe go ahead and take some profit and accumulate things down at these better prices, if at all. Not a bad opportunity here in a huge rally.
But again, I just want to highlight how, when you have a tool like VantagePoint, you see things like this. You see things like the dollar start to get strong. Crude oil prices move around. You see oil stocks actually have done very well and show support here, but you’re in Nucor, about 34% rally over 29 trading days. Again, just the opportunity to say, “Hey, I can make some adjustments, get even better prices here and still express that long position.” If you get that crossover the downside, well then, hey, look, take your profits, get out of the way, maybe even look to short to market.
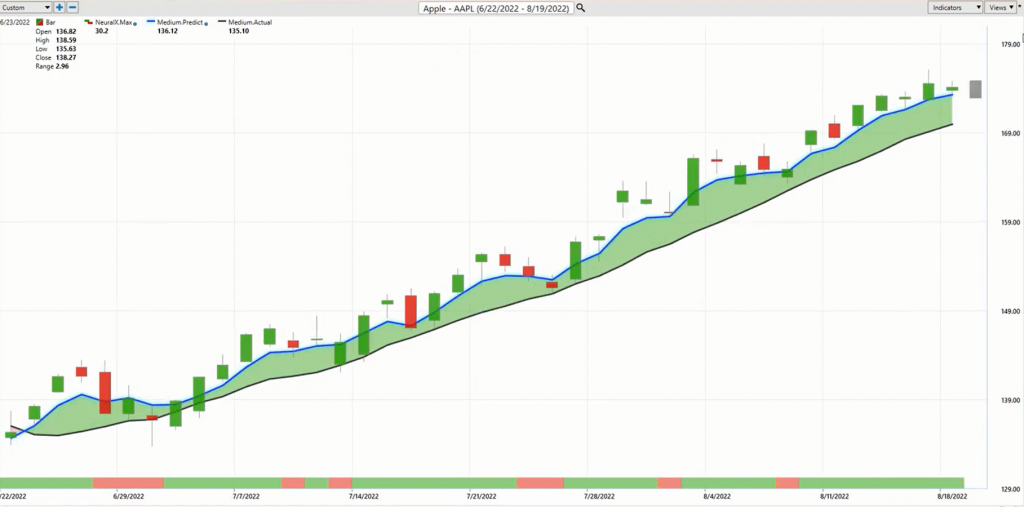
Now, here’s shares of Apple and going really back to mid-June, we brought through Apple week after week after week after week. I’m bringing it through again just to highlight how it’s so important to recognize these periods of strength and oftentimes stocks like Apple can really stand as that sort of proxy of seeing all that strength come into the market. And so, whether you want to trade the NASDAQ or just directly trade Apple shares, you see over the past 40 trading days, market’s up 27%, but it’s more nuanced than that. As we see, the blue line has solidly remained over that black line.
If you have a tool like this, you’re going to look at levels like these VantagePoint Predicted Lows as the levels to accumulate a position. This is where the trader who really understands that, hey, we’re in a very bullish period, you may want to have some limit orders just waiting down at these VantagePoint Predicted Lows, and they offer some excellent entries, 1, 2, 3, 4, 5, 6, 7, 8, 9, 10, 11, 12, 13, 14, 15, 16, 17, 18, 19, about 20 entries on the way up. There’s plenty of opportunity to get in at these levels, but what you don’t want to miss are these really big rallies and probably what you really don’t want to miss is that perception about the market and understanding that, hey, there’s some strength here. There’s some areas that you can trade that strength and places where it’s really just safer.
We’ll go on to Ford here and a couple charts here, but I want to bring in Texas Instruments because it highlights a very interesting point. Now, Apple really was the leader in the tech space and tech, NASDAQ stocks generally, we’ve seen so much strength really over the past couple of months here, but like I mentioned, the dollar starts to get strong and you really want to see these potential shifts happening in the market.
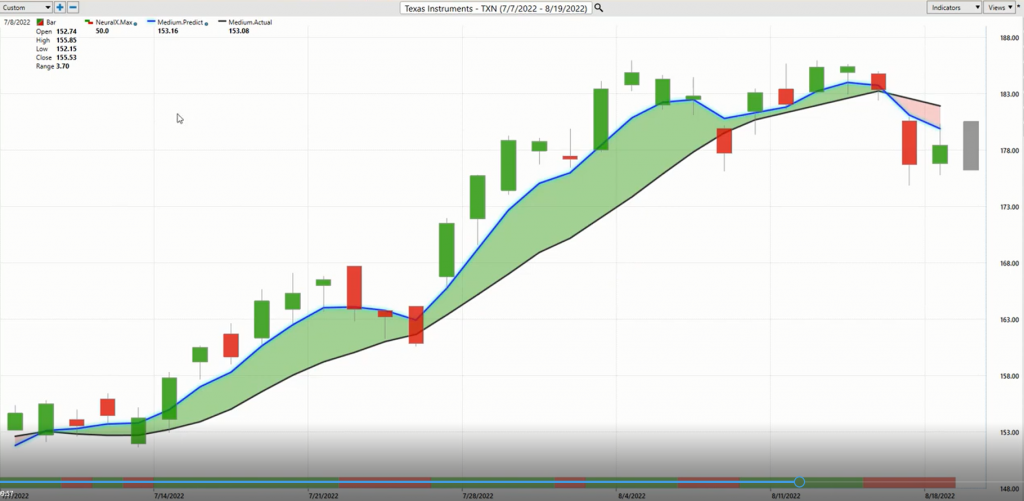
On the way up, we see Texas Instruments in a very bullish marketplace, saying, “Hey, look, if you want to get involved here while the forecasts are going to do their job at letting you know where are those levels that are going to offer some excellent value to take a position.” We see volatility really heats up around this area. But more importantly, what I want to highlight here is this recent crossovers to the downside. I keep coming back to this dollar strength and potential shifts where you really want to pay attention to this.
The forecasts are going to do a great job on those individual markets to really help you manage those opportunities where they show up, but when you see these signs like this, it really points a picture that, hey, you may want to get out of this and use again, your VantagePoint tools. You see the VantagePoint Predicted Highs and Lows doing a great job as that volatility comes in and saying, “Okay, let’s readjust. Figure out where things are at.” Very clearly here, you see a lot of weakness from the forecast. And so just, again, highlighting the neural index, crossovers to the downside. There are some areas in the tech space as well showing that weakness. When you have a tool like this, it makes it a lot easier to see those shifts happening, make those trade adjustments to again, reduce the risk and exposure to things.
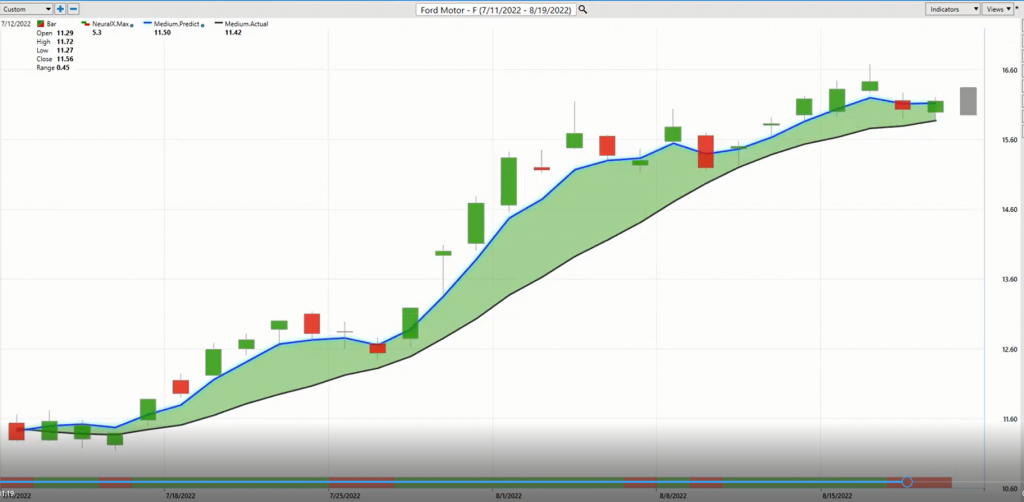
Lastly, here, here’s shares of Ford. This has just been such a fantastic opportunity. I do want to highlight a good week to potentially look to take some profits and get some better prices. You see again those neuro index getting bearish going into the end of this week. And so, we may, again, just this softening of prices on a Friday makes a whole lot of sense here, but the bigger picture here over the past couple of months is you want to be long on Ford taking profits and making money that way.
Here, market up 42% in the past 28 trading days. If you have a tool like VantagePoint, not only do you have that crossover coming through alerting you, but over those 28 trading days, going on 1, 2, 3, 4, 5, 6, 7, 8, this is one of these kind of volatility days where you’ve move all up in the bullish price action, and then immediately come to the low and then the trend resumes. Just so many opportunities to get involved in that market over what is a relatively short period of time and the market moving up 40%.
There’s really great opportunity here. There’s all this debate over interest rates moving up and how that’s going to affect things. Well, there’s a 41% rally there. When you’re getting in at the right time, there’s really great opportunity to stay involved. If this wants to move higher, great. But if it wants to come lower, you have the tools to get out of the way, take those profits and wait for those better opportunities to line up once again. Once again, this has been the Hot Stocks Outlook for August 19, 2022. Thank you all for watching. Best of luck and bye for now.