


Register for a Free Live Training
The Hot Stocks Outlook uses VantagePoint’s market forecasts that are up to 87.4% accurate, demonstrating how traders can improve their timing and direction. In this week’s video, VantagePoint Software reviews forecasts for SPDR SPY($SPY), Meta Platforms ($META), Walmart ($WMT), CME ($CME), Pfizer ($PFE), HESS ($HES), BAXTER ($BAX),
SPDR SPY ETF ($SPY)
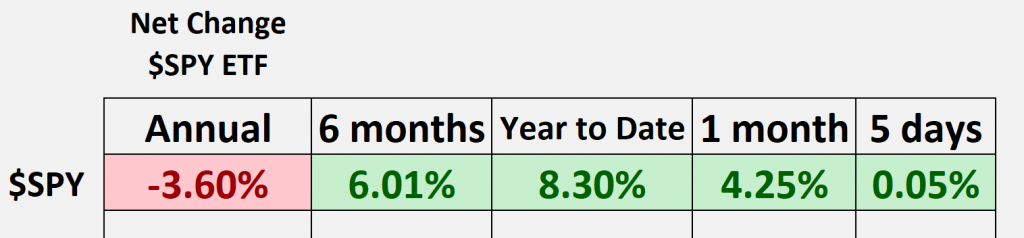
Hello again traders and welcome back to the Hot Stocks Outlook for April 28th, 2023. Hope y’all are having a excellent week out there in the financial markets. And as always, we’ve got plenty to cover in this week’s Hot Stocks Outlook. So if you haven’t already, make sure you go ahead and click on the link in the description below and you can sign up for a live demonstration, learn more of the specifics about how this technology can help you make better trading decisions in the markets in which you are participating. So as we typically do, we’ll take a look at the SPY ETF and the broader markets over the past year, but I just wanted to highlight last week’s Hot Stocks Outlooks. What are we talking about? Well, you may want to hedge to the portfolio, be prepared for some sideways price action and, well, what did we get?
A big move going lower this week. We had a nice rally as shares of Meta and earnings have come through and things have done really well there. But you want to be aware of this, and this is what we’ve been highlighting over really the past month here, is how do you identify these areas of strength or weakness in the market so that you can take on risk in a responsible way.
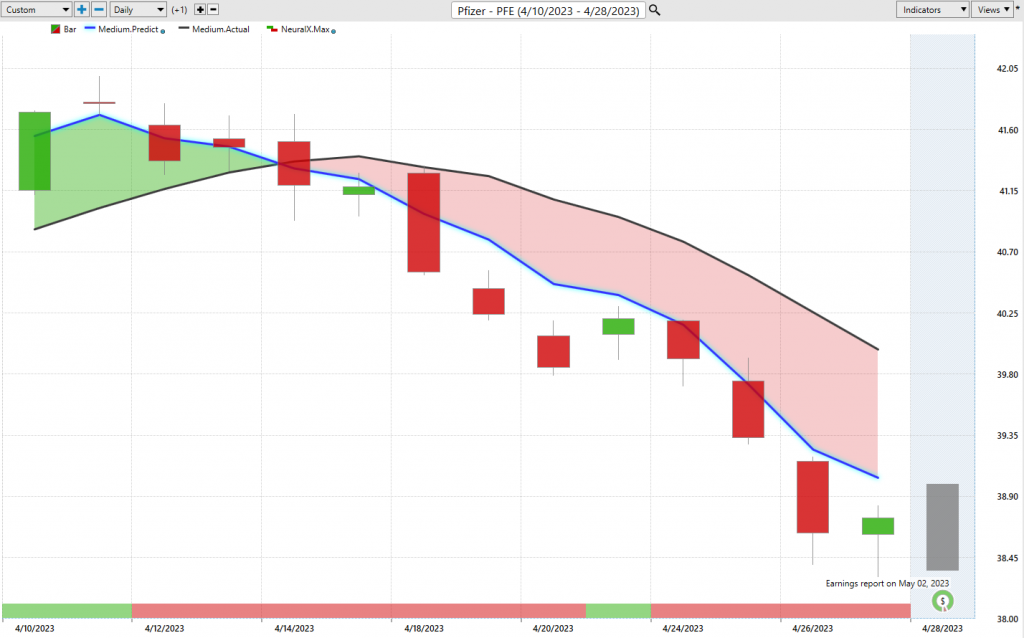
So here we’ll start out with shares of Pfizer. And so this is one of the markets we highlighted as far as some fresh weakness coming into the portfolio. So you had things like Costco on the way up, well, Pfizer on the way down, and the reason being that we had a very strong forecast from our predicted moving averages, our neural index. But let’s go through how all of this works so you can understand how to benefit off of these predictive tools.
So what you have here is daily price action, so each one of these candles is representing a full and complete trading day, and it’s right up against that price data. You’ll notice that there’s a black line and blue line value right up against the chart. So the black line that you’re seeing there, that is actually a simple moving average, so that is a very common technical indicator. In this case, it’s just a 10-period simple moving average. It’ll look back at the previous 10 closes, it’ll add them all together. And what it does is just smooths out the existing price action. I like to think of it as a baseline that we can use in combination with our predictive indicators. And so what we’re able to do is compare that black or what you might call a lagging moving average to this proprietary predicted moving average.
And you can think of this as a price prediction that is plotted on the chart for traders every evening, but it’s utilizing that technology of artificial neural networks to perform what’s called essentially intermarket analysis, right? So what does that mean? Well, essentially the data sets being used to generate these predictions is markets that are known to drive and influence the future price of shares of Pfizer. Well, that’s going to be things like the S&P 500 and the broader markets, but it’s also going to be things like ETF groups within the markets that are within the pharmaceutical or the healthcare space. It can be things like the bigger markets like the value of the dollar index or global interest rates all the way down to global commodities like oil, gold. And so it’s taking all of this into account, even down to individual stocks which the technology has understood share these important market relationships.
And it’s taking all of this into account, so you can imagine not just looking at one market, not just what the S&P 500 did, but what dozens of other markets that are known to influence the price here, how they’re subtly affecting things moving forward. And that’s what improves the accuracy of these predictive indicators, turning what were lagging indicators like a predicted moving average or even an exponential moving average that are all looking at past prices and reconfiguring what’s already occurred in the market. Well, now we have a forward-looking predictive tool, a true prediction generated via the technology to help us with these trading decisions. And so whenever that blue line crosses below the black line, well, what do we expect? Average prices to start skewing to the bearish side. Now, in addition to that very helpful predicted moving average to help us with the overall trend direction, at the very bottom of the chart, you’ll see this bar that goes from green to red back to green.
Well, this is the vantage point predicted neural index. And this is also utilizing that technology of artificial neural networks and generating those price predictions. But we can tune the technology to solve a different problem. And in this case, we want a shorter term price prediction, so really just short term strength or weakness over the next 48 hours. And we can use that in combination with the overall trend to, again, make better trading decisions and get a handle on what our expectations are for the market. And so you see here that these are about 10 trading days. The neural index I would argue is wrong once here. Where it gets bullish there, you see that there is bearishness over the next 48 hours. But what’s great about the technologies here is see how quickly you’re back down the bearish and you essentially have a 90% accuracy rate here on the neural index, forecasting that nine out of these 10 days expect the market to go lower.
10 out of the 10 days, the predicted moving average is well below the actual moving average, suggesting the overall trend is very much down here. And even that strength that you see, you might expect to just be short-lived. But here you see the market’s down about six and a half percent over the past 10 trading days. And you see just over the past week here, well, this is an area where you’ve identified that there’s excessive weakness here. And even with that strength we got off earnings and the markets bouncing back, you’re not really seeing that much here. And again, an area where if you want to keep that bearish exposure in the portfolio and keep managing that and shares of Pfizer.
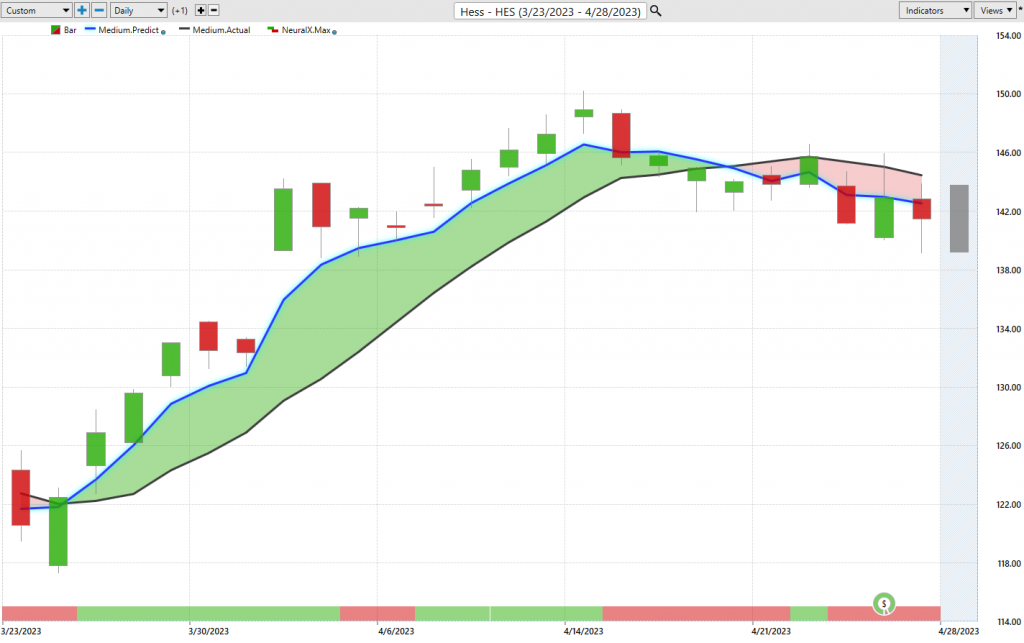
Now, we’ve talked a lot about energies over the past month and a lot of that had to do with actually the bearishness up in here. We recognized this shift in the marketplace and all this strength coming in, and that’s where you saw some news events, Saudi Arabia cutting back supply, the market gapping up. This is what this gap up is here in this aggressive move higher.
And so you can benefit off of that. You see the vantage point forecast very bullish through this environment. But as that weakness in the S&P 500 and the broader markets come in while we saw the weakness in oil. And so you see the vantage point forecast here, that neural index getting bearish, you actually have a crossover here to the downside in shares of Hess. And again this week, if you’re looking for an area to take bearish exposure, well, movement towards the predicted highs and the market then shrinks down to the predicted lows. And you’ve seen a couple of pretty nice moves here from the predicted highs down to the predicted lows. This is, again, just this week, a couple of two, 3% moves. And again, closing a little bit lower here in neural index, still bearish, but a very different picture than what we were highlighting just a couple of weeks ago.
So the trader needs to understand that, hey, you need to adapt to these changing market conditions, use these tools day by day as they update these forecasts. And depending on your timeframe, whether you’re looking for the overall trend, well, we recognize that trend shift coming in. You see that led to about a 15% rally in shares of Hess. But you’ve seen, again, a decline here just over the past several days where there’ve been multiple two and 3% declines and you don’t want to be expecting the market to move higher when we’ve got all of these issues, especially in these shorter-term timeframes that you’re going to have to deal with.
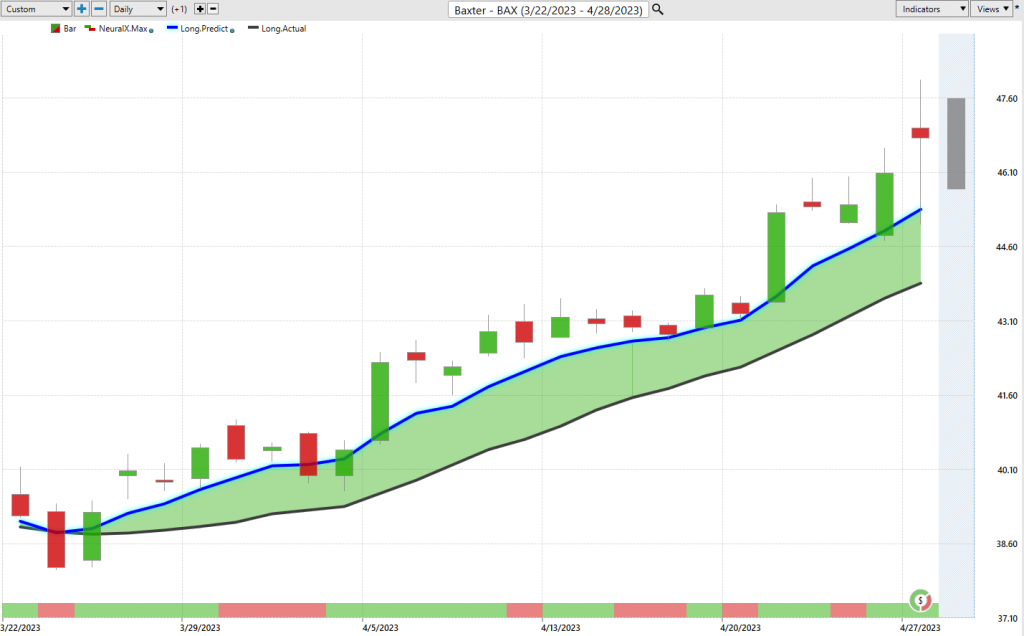
Now here are shares of Baxter. We looked at this really on April 7th was the forecast where we brought this through, and we bring this through because there’s this mixed nature of the market. You want to understand where is that excessive strength, and if I want to keep participating on the bullish side, how can I use the vantage point forecast and where might I want to use the vantage point forecast to do this?
So I wanted to bring this through because this is earnings, so we’re going to get a lot of volatility. We’re seeing a lot of volatility in the markets right now around earning announcements coming through. That’s what Meta was about. But when you’re able to recognize these situations building in the market, this really started all the way back on March 23rd. Right now we’re at April 28th here, so we’re looking at over a month’s time, the market has already moved up 22%. So you don’t want to be coming in and trying to make some play right around earnings as you get that random information hitting the market. The vantage point can’t account for an earnings report. Nobody knows what that number is going to be, and then it hits the market and potentially has a radical change on prices. Well, when your entries are down at 38, you can take on that earnings risk and do it much more comfortably than just going in the week of and trying to make some guess on where you think the market is going to move after earnings.
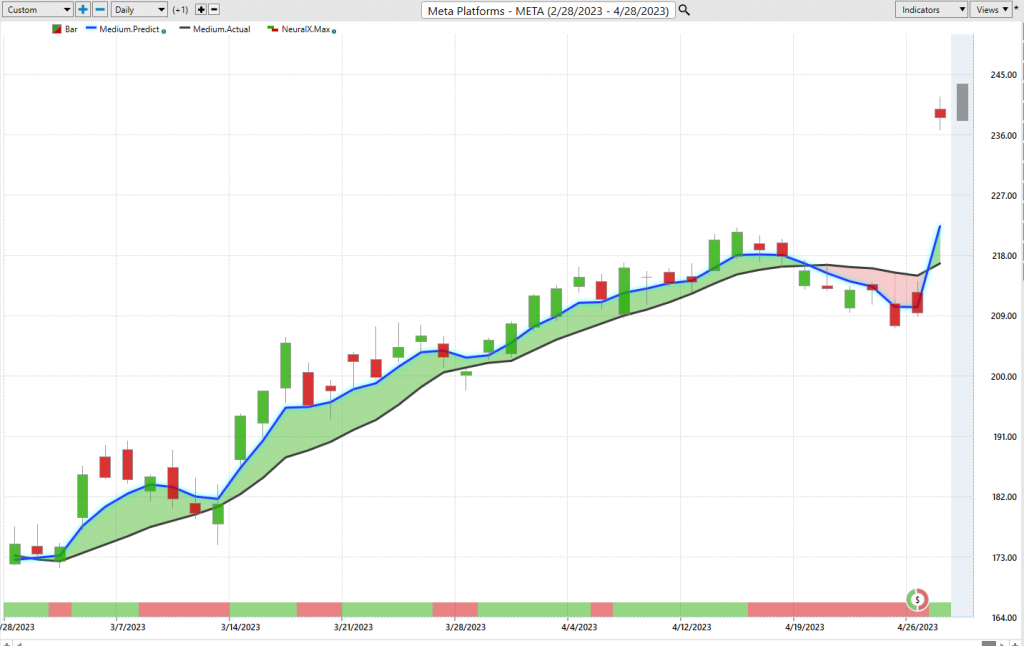
And so this brings me over to Meta. So we looked a lot at meta over this move higher because we recognized, hey, there’s a lot of strength in the market, Meta’s been doing really well here, but this was actually a clue highlighting this shift in the S&P 500. And I wanted to bring this through because yes, we had this big move off of earnings. So again, data that vantage points neural networks have no way of accounting for. But as we look at what was happening for the, I’m going to take a look at this here, the 40 trading days before earnings, well, what’s happening? The software’s doing an absolutely excellent job day in and day out highlighting short-term levels for the vantage point trader to accumulate a position, make trade adjustments, take profits along the way. But what happened here is if the market is going to trade here in prices a week later, well, vantage point forecasts should get bearish, right?
The vantage point doesn’t know that earnings are going to be here. It has no way of taking in that information. What it’s doing is looking at the inner market information. What’s happening with the broader S&P 500, what’s happening with individual stocks, how are the ETF groups affecting this market along with oil and the global commodity markets? And so it does this excellent job day in and day out, but just be warned, it can’t account for earnings. So that’s where once the earnings report comes out, it’s like all this new information is an informational catalyst, is what I would call is hitting the market all at once. Now, when you come into a market like something like Baxter and you’re accumulating that position at the right time, well, you can take on that earnings risk however you like. If you still want to be bullish, you can have some still in the portfolio, but understand that you’re likely to get a little bit of randomness around that event.
And obviously a lot of volatility that’s going to go past your predicted high and predicted low levels that are provided for that short-term price act and those short-term determinations that we need to make in the marketplace. So now this market up about 37%, but I just wanted to highlight the differences between, here’s Meta, all that volatility around earnings and then the drift lower going into earnings. Well, sometimes, like in Baxter, you get such a nice entry, the earnings roll through and they just benefit you. But again, it doesn’t change. You don’t want to be putting on the position the day of earnings. We can recognize these shifts very early and get way ahead of this strength or weakness in the market.
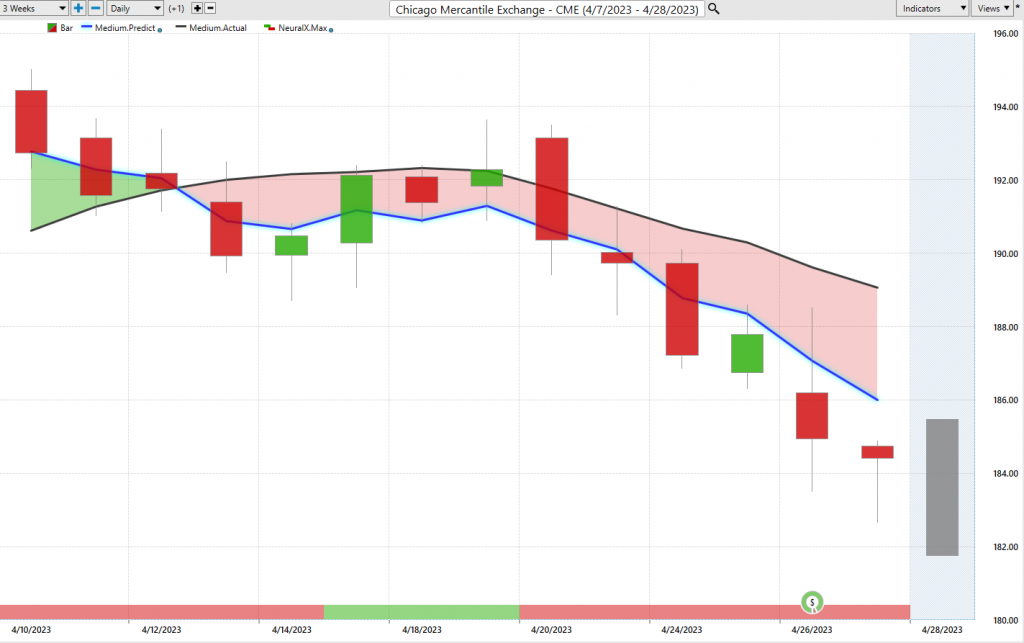
Here’s the CME. This is also a market we highlighted on the way up a couple of months ago. Well, now we’re seeing a difference in the forecast. And this is just such a great example of the combination of these indicators where the overall trend is down. Notice your neural index saying strength over the subsequent 48-hour periods, but the overall trend is down. Once the neural index gets bearish, you see all that weakness come in. And again, highlighting another area where if you want to look for bearish exposure throughout the week, well, here’s an area clearly where you see predicted moving average, very bearish, neural index, very bearish. And that’s where traders can come in and utilize tools like the vantage point predicted highs and lows to accumulate a position. So when you recognize, hey, I want to be short, where should I be looking to take out short positions, but also, where should I be looking to take profit and reset those short positions as the market moves lower?
So if you’re taking profit, you can always look for better prices, re-short, take profit again, look for better prices and re-short, but understanding where should the focus be on bearish exposure and subsequently, where might the exposure want to be on the bullish side? And you can have that hedged portfolio where you’re benefiting off of the strength that’s coming in, but avoiding some of these dangerous areas. And when oil or something starts to drip lower, you want to make those trade adjustments, take the profits and maybe, again, start exploiting things to the bare side in combination with your bullish positioning. Lastly here, we’ll take a look at Walmart shares. And again, just a pretty basic example here of, okay, well, here’s a market that has not gone lower. So even at when we look at the SPY, we see that ETF pivoting lower, highlighting that you really want to be careful out there. Don’t get yourself caught up in stocks that are ready to go lower like Pfizer here, like energy stocks or Hess. There are some really dangerous situations out there.
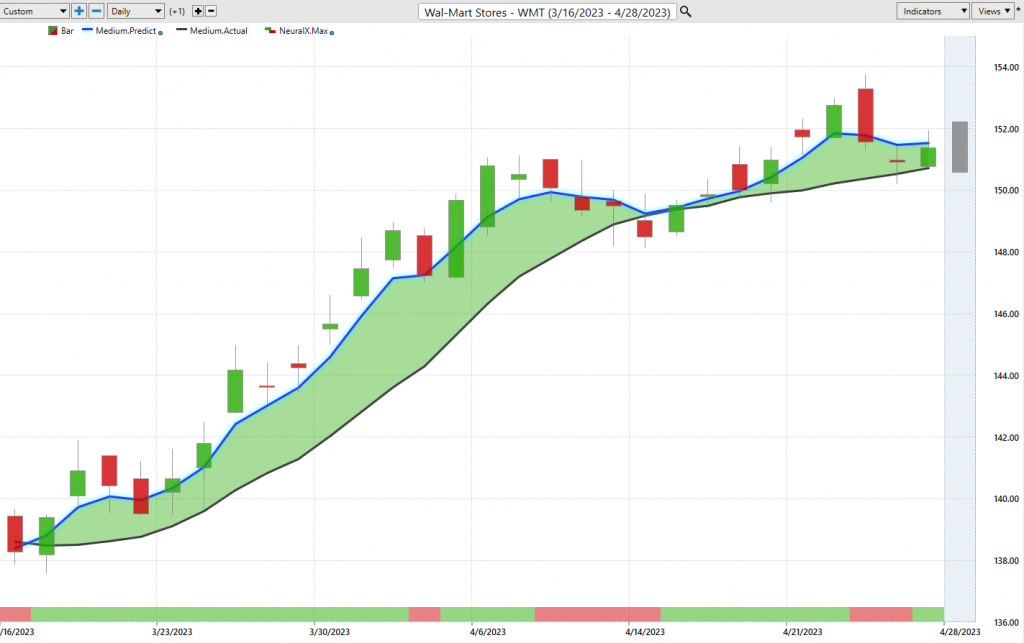
Well, here’s shares of Walmart up about 9% over the past 29 trading days. And over the past week though, just seeing the forecast remain fairly bullish here, so holding up pretty well, but not a lot happening. But this is what you’re going to get in a market like this, right? A bunch of earnings, huge amounts of volatility, markets that hold up. Well, you see Walmart, Baxter here, but some real dangerous areas in the marketplace like Pfizer, like CME, where you just really don’t want to be on the wrong side of the portfolio because these things can always accelerate to the downside. And we’re not necessarily out of the danger zone here as far as stocks and the risk on, risk off environment sort of being more clarified here.
So we’ll go ahead and leave it there for today, but just a really great example of how, take your trading style, your timeframe, and utilize these tools to make better trading decisions. You’re going to have things like earnings and news reports that hit the market, but overwhelmingly, that’s not happening in the vast majority of trading time that goes by on the calendar, and there’s really great opportunities to get really nice entries in the marketplace so that you can take on that earnings risk and potentially make a lot of money as we see volatility come into things and shares really start to pick up and move around. So once again, this has been our Hot Stocks Outlook for April 28th, 2023. Thank you all for watching. Best of luck and bye for now.