


Register for a Free Live Training
The Hot Stocks Outlook uses VantagePoint’s market forecasts that are up to 87.4% accurate, demonstrating how traders can improve their timing and direction. In this week’s video, VantagePoint Software reviews forecasts for CubeSmart ($CUBE), Caterpillar ($CAT), Icahn Enterprises ($IEP), Morgan Stanley ($MS), KeyCorp ($KEY) and Regeneron ($REGN)
Hello again, traders. And welcome back to the Hot Stocks Outlook for April 15, 2022. Hope you all are having a great week out there in the financial markets. Like always, plenty to cover in today’s outlook, and we are going to cover a lot here, going through all the features of how intermarket analysis and artificial intelligence can really give you a huge edge in the marketplace and really affect where you’re looking in the market and how you’re making trading decisions.
So we’ll start out here with CubeSmart. We’ll also revisit Icahnn Enterprises. We’ve got a couple financials here, Caterpillar. And I really encourage you to go back and watch the previous five or six weeks of the Hot Stocks Outlooks because we revisit markets, show you the updated forecast, and walk this through as a trader would, potentially adjusting their positions.
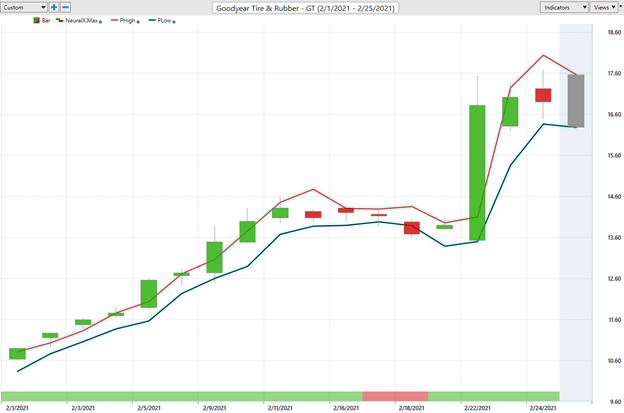
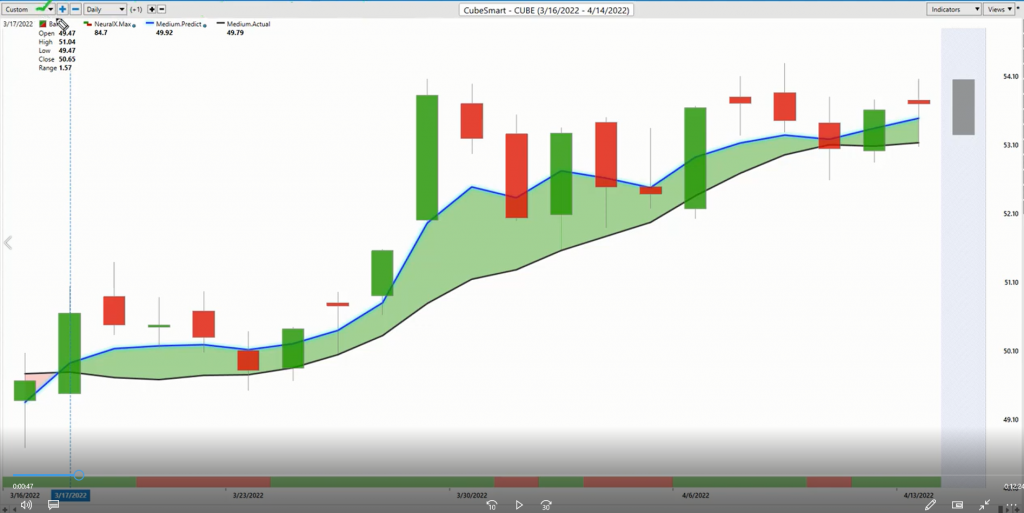
But starting out here with CubeSmart, this will act as a really good example of how all the forecasts work, whether you’re trading futures, commodities, cryptocurrencies. But how this works is off of end-of- day data. So each one of these candles that you’re seeing is representing a full and complete trading day. And right up against all that data you’ll notice that there is a black line there and also a blue line. So the black line that you’re seeing there is a simple moving average. That’s a very common technical indicator.
In this case, it’s a 10-day simple moving average. So it just looks back over the previous 10 closes, adds those all together, divides by 10. And the reason that you do that is to smooth out the existing price action so you can get a handle on, well, where have prices been, sort of smooth that out, sort of get the overall average here, right? But we don’t need to know where the market price has already been, right? We need to be ahead of the next move in the market and understand where are prices likely to go next so we can be ahead of that next move.
And so what traders utilizing this technology are able to do is actually compare that black, simple moving average or that lagging average to this blue value. And for that number to get calculated and thus plotted against the chart each and every trading day, this is where VantagePoint’s technology is coming in and having a heavy influence here on what values you’re seeing, and that should hopefully be adjusting your decision-making.
So specifically in the case of CubeSmart, which we might call the target market, this software’s able to look at up to 30 markets that are known to drive and influence the future price of CubeSmart here. Now, that can be things like the S&P 500 or the Dollar Index or interest rates. But also, there’s subtle relationships happening between ETF groups, individual stocks. And this is why it’s so important to have a tool that’s able to look at a huge amount of data and make reliable predictions. And that’s really where artificial intelligence and artificial neural networks have a huge edge.
And so what it’s able to do is take all of that intermarket information, understand how it relates back to that target market, and actually use the clues derived via that data to generate true price predictions that haven’t yet occurred. And it’s those predictions generated via the technology that are then worked into the value of these indicators, turning what was tools that really only get dragged around by past prices into a forward-looking, predictive technology that’s looking out at these intermarket relationships and it really offers these very subtle clues for future price action. We’ll especially see that when we go ahead and look at these last four charts, but I just want to go over the basics here of how to interpret the charts here. But when we look at different markets in the same sector or potentially markets in different sectors and how things like the S&P, things like the ETF sectors that are rolling around can affect things.
So starting out here with CubeSmart. CubeSmart, though, it’s very simple. If that blue line is crossing above the black line, you expect average prices to move higher. And it’s those early signals that you’re going to get with the help of those forecasts being weighted and pushed to create those signals and crossovers sooner. Now, at the bottom of the chart, though, you’ll see you have this bar that goes from green to red. So everything’s getting updated at the right-hand side of the chart, but that bar is also derived via that neural network process, but it’s solving a different problem for the trader. And in this case, the problem is very short-term strength or weakness over the next 48-hour period. Now, obviously, you can have short-term strength over the next 48 hours but still be in an uptrend and vice versa. And that’s very important to figure out.
Now, lastly, like we do every week is take a close look at these predicted highs and lows to see intraday what were these neural networks actually pulling out as far as the trading range for the day. And it’s the combination of these forecasts potentially combined with your fundamental analysis or some of your other tool that can really help you identify new opportunities with the help of the IntelliScan, but maybe more importantly, adapt and manage those opportunities that you’re in.
So when we go ahead and take a look at those predicted highs and lows, and you got to remember these are produced before each and every trading day. So we’ll have a candle that will fill in and we’ll see how accurate all those predictions are. But this is how we can see how all of those predictions, how accurate they have been. And it’s these levels that are provided to you every day, potentially in markets where you understand you’re trying to get long and take profits on longs, that really inform you of what is it that you should be doing if you want to participate in these markets. Because you get the nice move early on here as that market breaks out, but maybe more importantly is it’s been a little bit of a rough go here with the S&P 500 and the traditional stock markets.
And so you want to really pick your spots. Some stocks are not doing well and other things are doing tremendously well. So you see in the last 20 days here, CubeSmart’s up about 7.5%, but more importantly, many entries along the way to be adding really at the lower part of that range as that overall trend continues. So just an example there. But let’s continue this on and hopefully sort of connect all these pieces, potentially using the scan to even identify the opportunities with the help of these tools.
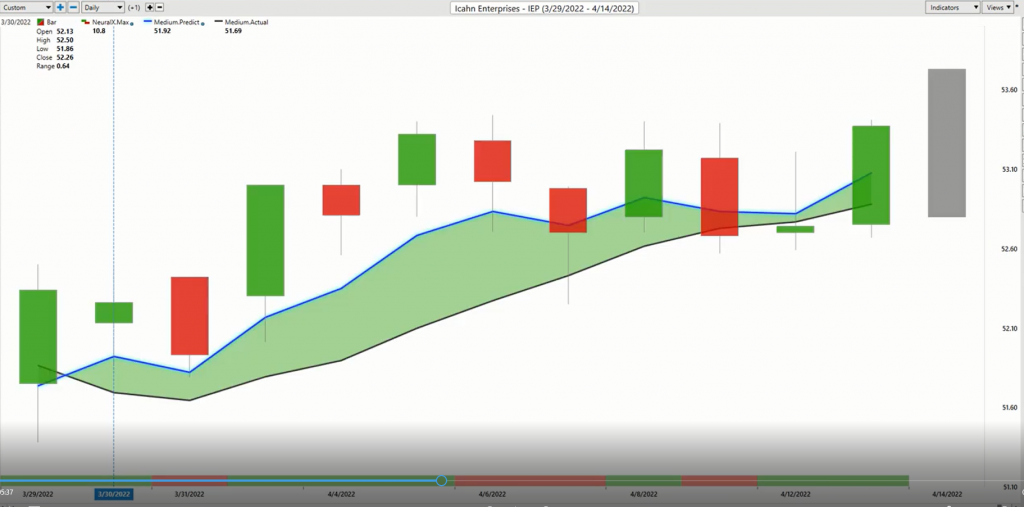
So here’s Icahn Enterprises and we’ll just do everything the exact same way, right? We’re looking for that blue line crossing the black line. Now, this Neural Index, now it’s accurate essentially four out of five times, it’s that 86-plus percent accuracy across a very large number of markets. And it really doesn’t matter whether it’s earnings reports or Fed announcements. This is really through all of those catalysts that hit the market and create volatility.
So you see that here in this case, it would be wrong. You have a Neural Index is bearish, but you see how in most of the cases, like I said, four out of the five times, this is going to do an excellent job of warning you of short-term weakness over these subsequent 48-hour periods, but you want to combine that with certainly the overall trend in your directional bias, but also the predicted highs and lows. So you keep improving that potential entry or a overall price that you have involved in that market. So here we have just a little bit of move so far, but again, I just wanted to highlight these areas where there’s some more strengths, some manageable opportunities here, and certainly that blue line well above the black line.
And then we come over to these financials. So we talked about KeyCorp last week, and really the issue here is that we do have earnings coming up in a lot of these financial stocks.
So you’ll see that on this chart, that over the next week or so, I think Morgan Stanley’s actually today here. But the point here really being that despite earnings and despite all that, actually for weeks leading into earnings, we can look at the quality of this forecast and we can see that really at the end of March it is very clear that you do not want to be long financials. If you’re doing anything short, take profits on shorts. There’s other areas where you can get long again, based off the forecast.
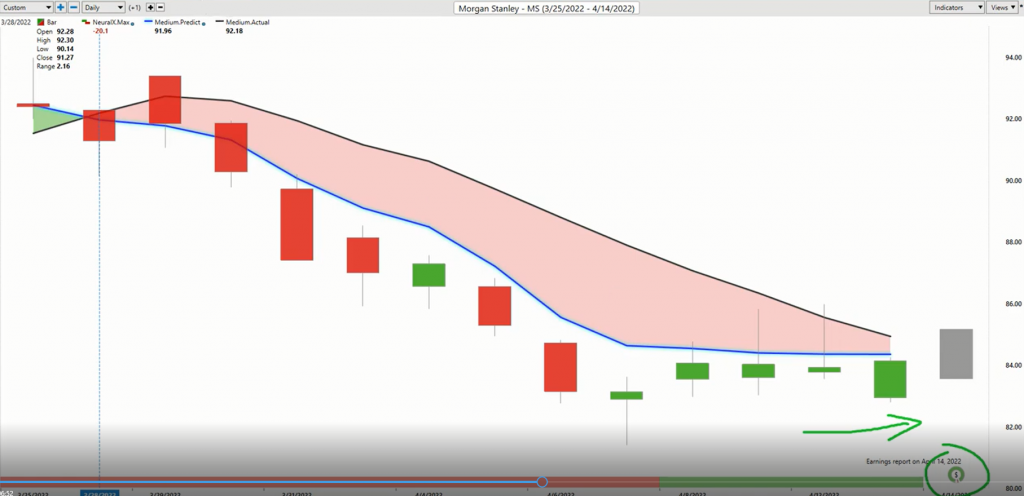
So you get this nice guidance that says, okay, all you do is have orders potentially waiting. At days like this, you have an order at the predicted high, you would just get filled at the open and then the market immediately starts collapsing lower. But check out this period here, and we’re going to compare the two, Morgan Stanley and KeyCorp. And understand, they both have earnings coming up. They’re both in the financial space. They’re both probably going to trade fairly similarly. But there’s these subtle differences that can be derived via the unique intermarket relationships that are playing out between them.
Now, they’ll probably share a lot, but they will have unique market relationships that those neural networks have said, look, this is important specifically for Morgan Stanley. And you’ll see that the Neural Index has been bullish here. You actually see that it’s moved up over these subsequent days. Of course, we’re going to have that big catalyst of earnings. And so that always needs to be understood and how you’re going to manage that. But even going into earnings, the quality of these short-term forecasts and levels, letting you know, hey, if you want to improve your position, where can you go ahead and do that.
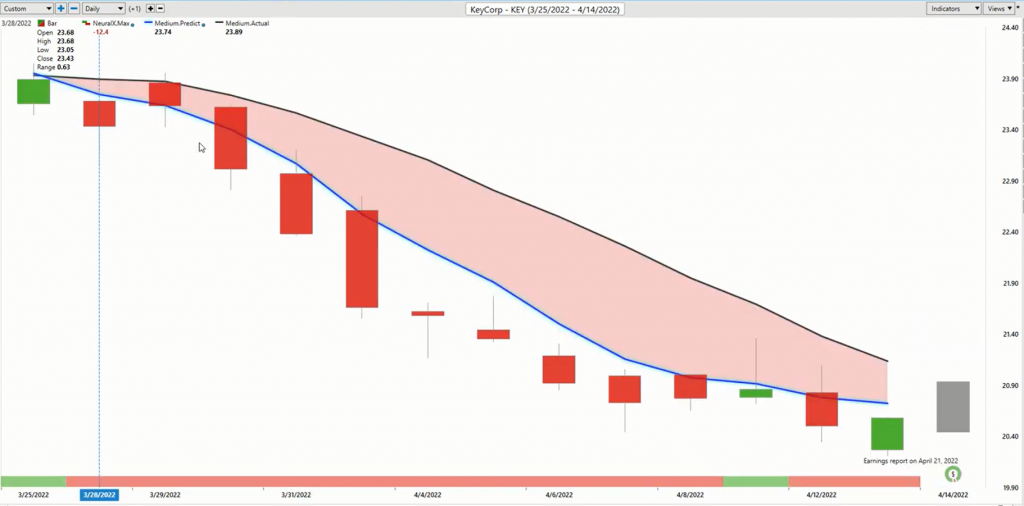
But let’s go ahead and look at KeyCorp. And I just want to say Morgan Stanley here and there you get bullish. But another financial stock, but a little bit different. And so if you’re managing an opportunity like this or adding to a position or making adjustments, you want to know the best way to do those adjustments here. And you see that the Neural Index has been quite bearish through the entirety here. And not only that, but you see even predicted highs being hit and the market selling off and moving lower. You see you get a gap down and again things moving lower, Neural Index lower, where you have quite a different picture here in Morgan Stanley.
Similar markets in the exact same sector, but very important to understand the differences and so that you can refine things and understand, hey, where’s the strongest place for me to maybe take a position in the market, whether it be long or short or whatever it is? So here, KeyCorp down about 13, almost 14% here and still not looking all that great. Now, if financials improve, well, we may see some crossovers and things move to the upside and that’ll be great, but you want to be able to find the strongest areas in that sector and let those things lead you. And that’s really where we, looking at the previous Hot Stocks Outlooks and walking through this, you see we can identify these areas where there’s strength and then stay focused on them. If there is a shift and we need to make some trade adjustments, that’s fine.
And that’s what we highlighted a couple weeks ago here in Caterpillar.
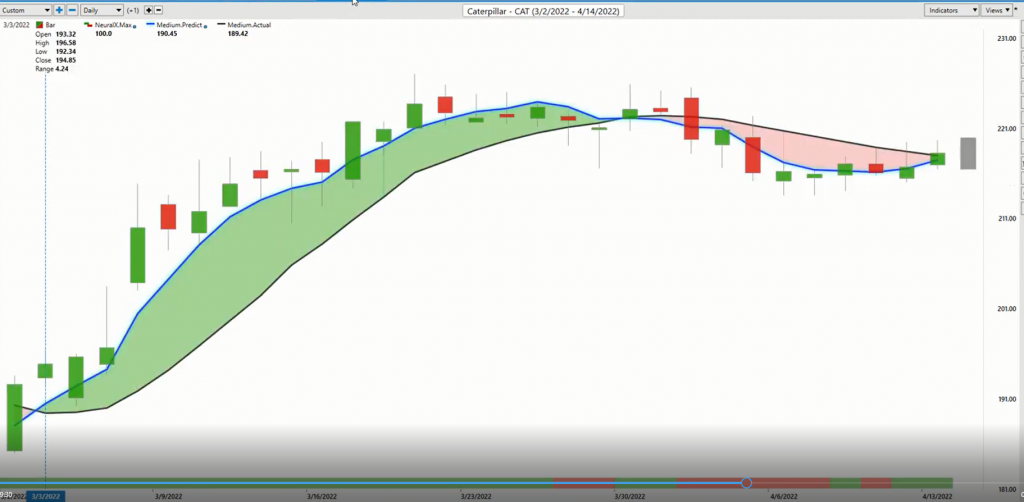
So we had this situation in February 24th and 25th. The market bottomed out, and we saw all these stocks start to move higher, actually with the help of the IntelliScan feature. So because those predictive moving averages are really cutting out the lag time, as soon as that market starts to strengthen, you start to see a lot of markets come through and say, hey, there’s some real strength here. Maybe focus that attention on getting the portfolio long. And so in Caterpillar, that certainly makes sense to do that. Again, we want to make those trade adjustments potentially at these predicted highs and lows. And we’ve already done this, walked this forward, this whole market moving forward here.
But I want to again highlight some of the differences in how these tools can help you, where you see this crossover gets bearish here and there’s a conflict, right? Neural Index is bullish here. It gets bearish again. But the point being is that what’s happening is that this predicted moving average is looking at those intermarket relationships and it’s being weighted, right? If there’s something going on in those relationships that is leading to potentially future prices being weaker, it’s going to weigh that indicator down, and it’s very likely to create crossovers, create bearish signals from your Neural Index.
And you see that when this crossover comes through here, it’s still a couple weeks later, we’re still trading lower. You know, now if we look really closely at the forecast, we do see recently more strength from the Neural Index. These predicted highs and low levels have started to move higher. And certainly it does look like some short-term strength coming back into the marketplace. But why that’s important is because this has now been a few weeks where your action, you really want to make sure you understand that, hey, there’s short-term weakness in this market. Hey, the trend is actually weak here. Be looking for much lower prices and not this market that is in a strong uptrend.
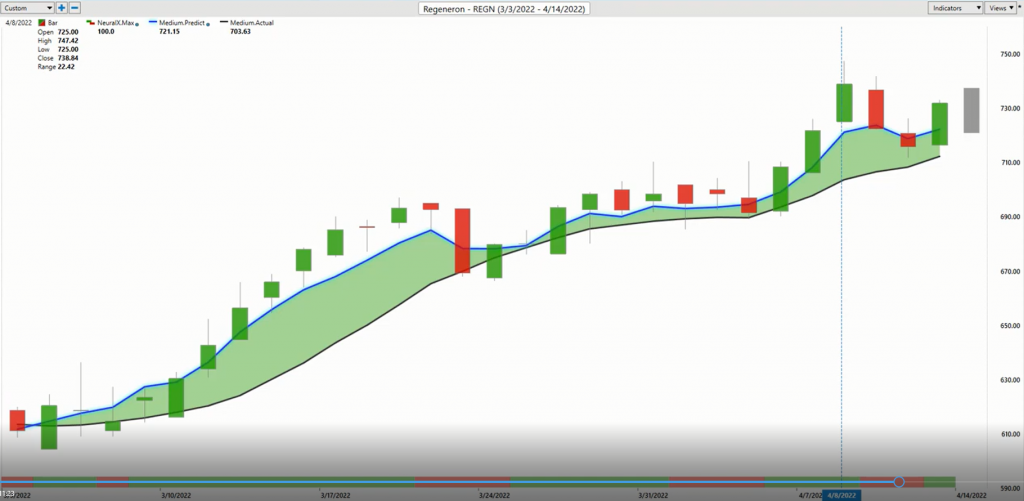
But if you are looking for are those markets that you want to get bullish exposure to the market where it is safer, well, you can still do that, but just do it in a place where the forecasts are much stronger, right?
So here’s Regeneron again, the very similar situation of these stocks that did extremely well coming out of the 24th, 25th of February. And so this crossover moves higher here. But how much of an easier period of trading is it here in Regeneron over that exact same time period that says, look, the blue line is still over the black line. The trend is up. There’s more trend strength here from those trends that started and really rolled through March. And this would likely be a better place to set up positions and look to get that bullish exposure.
So I bring these things in week after week so we can see these updated forecasts and just walk it forward and understand how you might adjust the portfolio, how you might be just getting entire sectors out of the range of ideas, and focusing in on those areas where they’re is that higher-quality opportunity. And it allows you to construct that portfolio, but also manage and adapt the portfolio when these shifts come into the marketplace. Because just like we had the shift in February, we recently had another shift here where a lot of stocks started getting hurt. And we saw the NASDAQ and S&P really pull off. And if you recognize that, incorporate it into your portfolio, it only does things to insulate your overall positions and have you making money on both sides of the market.
So again, we’ll go ahead and leave it there. I didn’t even get to some of the IntelliScan features that we’ll go ahead and touch on next week. But it’s about benefiting off of the quality of these forecasts to help change your trading decisions in the marketplace so that you’re staying very consistent using a tool that’s going to have that accurate forecast, again, regardless of what’s going on in the marketplace so you can spread that risk out, identify numerous opportunities, and manage them effectively.
So once again, this has been the Hot Stocks Outlook for April 15, 2022. Thank you all for watching. Best of luck and bye for now.