


Welcome to the Artificial Intelligence Outlook for Forex trading.
VIDEO TRANSCRIPT
Hello everyone and welcome back. My name is Greg Firman and this is the VantagePoint AI Market Outlook for the week of October the 25th, 2021.
U.S. Dollar Index
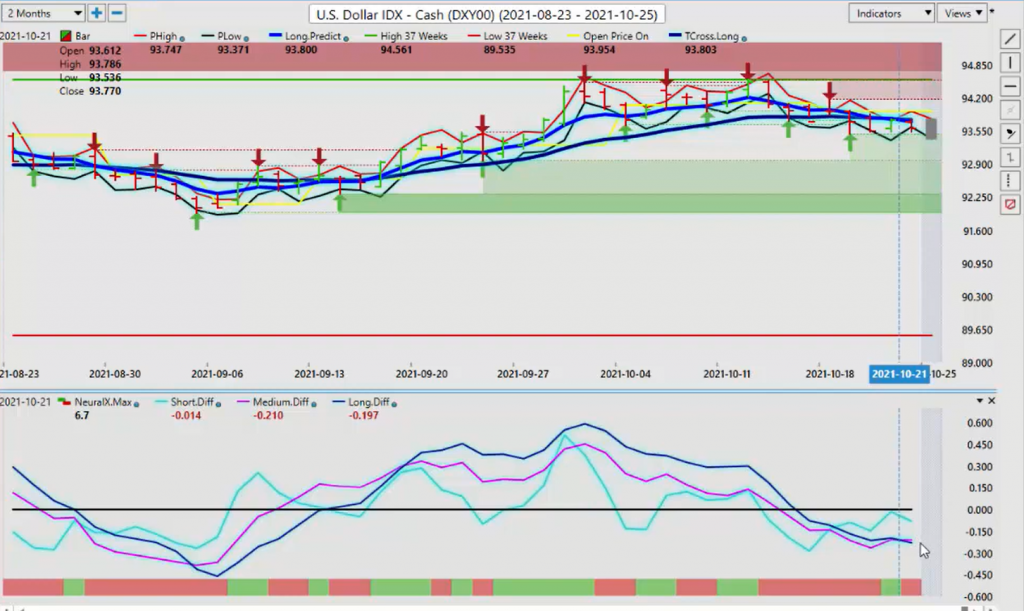
Now to get started this week, we’re going to begin with the US dollar index, but first let’s look at the indicators we’re using this week as we mix things up a little bit here. We’ve got our 52-week look back that’s been modified to 37 weeks. We’re using bars, not candles. We have our long-term crossover in this particular case. But as you can see, I’m using the long-predicted without the simple moving average. We’re using the predicted short, medium and long-term differences with, of course, the very powerful neural index. Our point in time to identify the weekly opening price, our predicted high and predicted low are triple MA crossed, but again, we’re going to mix it up a little bit this week and we’re going to use the T cross long, which I often talk about as a major support level by itself, without the T cross short or the medium.
And of course the very popular verified support and resistance zone. So as we can see, what we’re using here now is the long predicted, an excellent daily pivot for entry points. We’re using the T cross long to identify the primary directional bias, the current directional bias. Now, again, if we look at these bars, we can see that the T cross long has contained the dollar index the entire week, but at the same time, the verified support levels have contained the downside. So likely what we’re doing is getting ready for a bigger break here. So identifying those key levels on the T cross long is 93.74. Now the breakout point of 93.50 is still intact. On the dollar index, we can assess that we hear in this particular case, we are using the medium-term crossover against the long-term crossover. Right now the medium-term predicted difference is telling us that the medium-term trend is weakening to the downside and a reversal is imminent.
That’s what we’re looking for from this. Now the neural index needs to be on board with this. Currently, it’s not. So when the neural index turns green, the MA diff crosses and starts moving up. At that point in time, we would be looking for the dollar index to break above the long-predicted at 93.74 and the T cross long at 93.78. Now this takes out the simple moving average on the long-term crossover, and it removes the shorter-term indicators on the triple EMA cross. It’s a different trade setup, but it’s very easy to do in your VantagePoint software. We’re simply clicking on the properties here. You can see that the long-term crossover when we look at that long-term crossover, the actual moving average is removed. On the triple EMA cross, I have simply removed the short and medium-term crossover, right there, and I’m using strictly the T cross long to identify the primary trend.
So again, when we look at the structure using bars, here we can see what we would be looking for for the dollar index is for it to continue to make new lows and not break above the previous day high. Now that’s not really happening is it? When we look at the high of 93.78 on Friday and 93.78 on Thursday, but you can see that we didn’t make a new low on Thursday or on Friday. That, combined with the medium-term crossing the long-term predicted difference suggests, again, that it is entirely possible that a reversal on the dollar is imminent. We’ve also discussed seasonal patterns or seasonalities and monthly patterns. In most case, the dollar sells off mid-November to the first week of January. The dollar sells off as money moves offshore, but the monthly cycle we’re seeing the dollar selling off around the 20th of the month.
That’s what I discussed in last week’s weekly outlook, and then showed multiple other periods going back in previous months when the dollar is sold off at the same time. So we have a rough idea when the dollar is going to sell off around the 20th, but we also can see using the predicted differences that the dollar is usually strong around the beginning of the month. And we use, again, that MA diff cross signal presents itself yet again, as we start moving closer to the first week of November. So dollar longs are not off the table by a long shot here, guys. And the VP indicators are already picking up on a potential trend reversal.
Gold
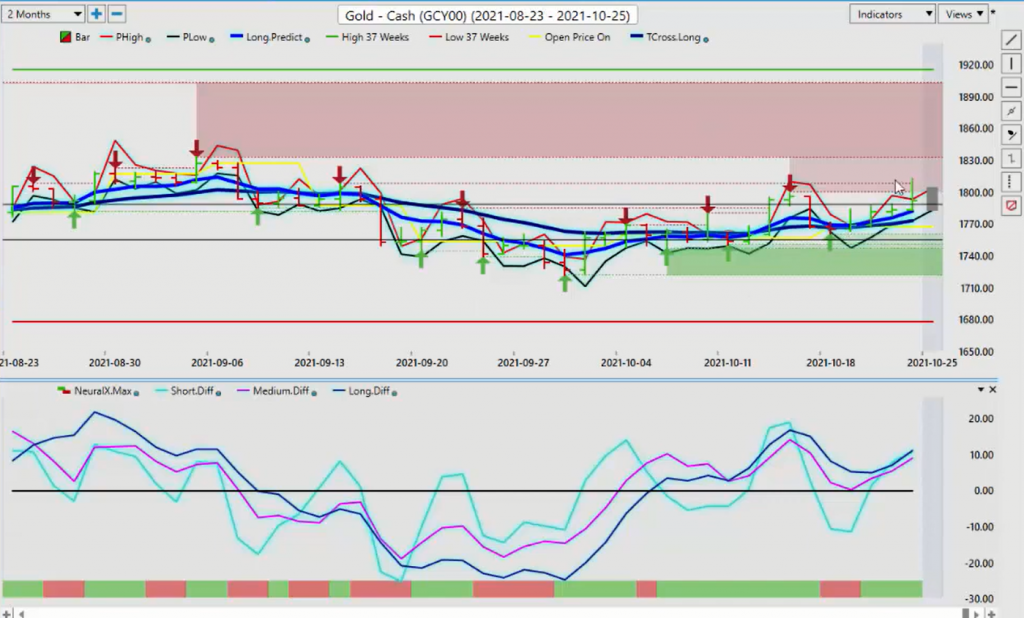
Now, when we use that same methodology and we apply it to gold, when we look at gold here, gold is advancing. But again, the real resistance level that we need to watch here is 1833. Right now, gold is unable to close above 1800.
You’ve got some bulls coming into the market here, but again, when we look at the T cross long and the long-predicted, we know exactly where the levels are. We’ve got the long-predicted at 1781, where we can assess we’ve had buyers come in on Thursday and Friday. And then we have the T cross long, which is our major support level at 1772. The predicted differences are saying that we still have a little bit more upside, but I would be very, very cautious on longs here between the current level and 1833 as again, gold means firmly below its yearly opening price at 1904. And we have very few buyers in this particular channel. So what we would be looking for here this coming week is watching the neural index very closely from going from green to red, down here, and the predicted difference is starting to roll over down, or a breach of the long-predicted or the T cross long at 1781, respectfully, and 1772.
S&P 500 Index
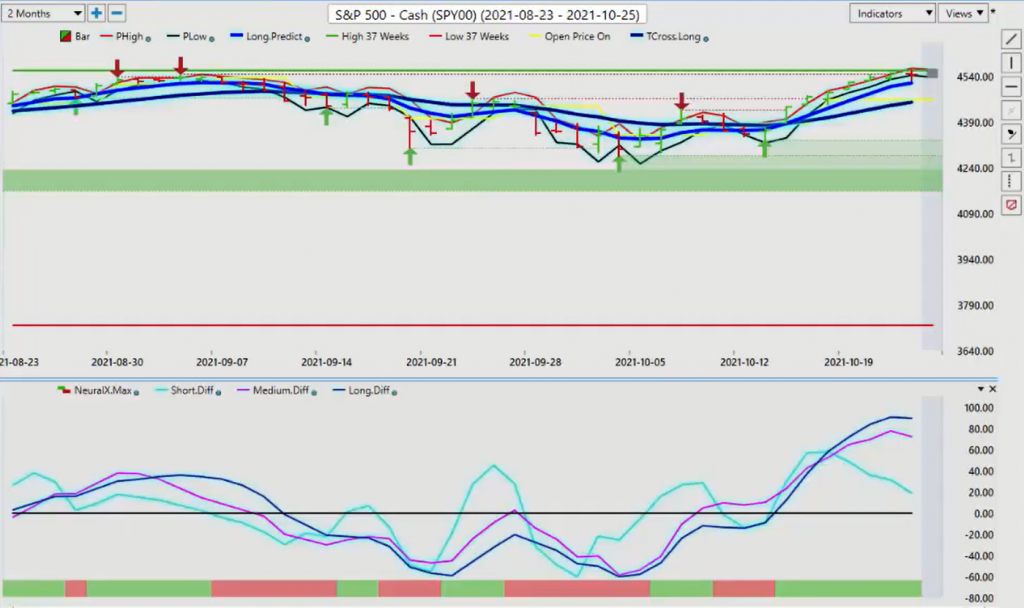
Now with the global stock markets, the NASDAQ and the S&P 500, we do a comparative analysis on these two. And once again, we’re setting an all-time new high. Now, when we’ve done this, each time we’ve had a significant pullback right afterwards to the T cross long. That’s at 4455. Now our long predicted this dark lighter colored blue line is the long predicted. That’s what we would use on a day-to-day basis, 4517. If we break that, then we would target down to the T cross long at 4455. This simplifies the process here, guys, by looking strictly at the predicted moving averages and using them as pivot levels to warn us when the market is getting ready to go lower. So while the S& P 500 still looks decent, our NASDAQ trade from several weeks ago, it looks to be struggling a little bit here.
So once again, we look at these bars very, very closely to see if we actually are still advancing, like they’re telling us. So in actual fact, we didn’t make a new high, really maybe a little bit on Thursday, but on Friday we did not. And we broke down below Thursdays low. That again can be a huge warning sign based on price action that we may have a problem here. Now, we also have the medium-term crossing the long-term predicted difference with the neural index. This particular trade setup warns us that there could be problems next week.
NASDAQ Index
Now FANGs, the FANGs stock earnings, I believe, are out next week. This is more of a broader presentation on the stock indexes, but those earnings are absolutely going to affect the NASDAQ and the S& P 500. So keep an eye on that.
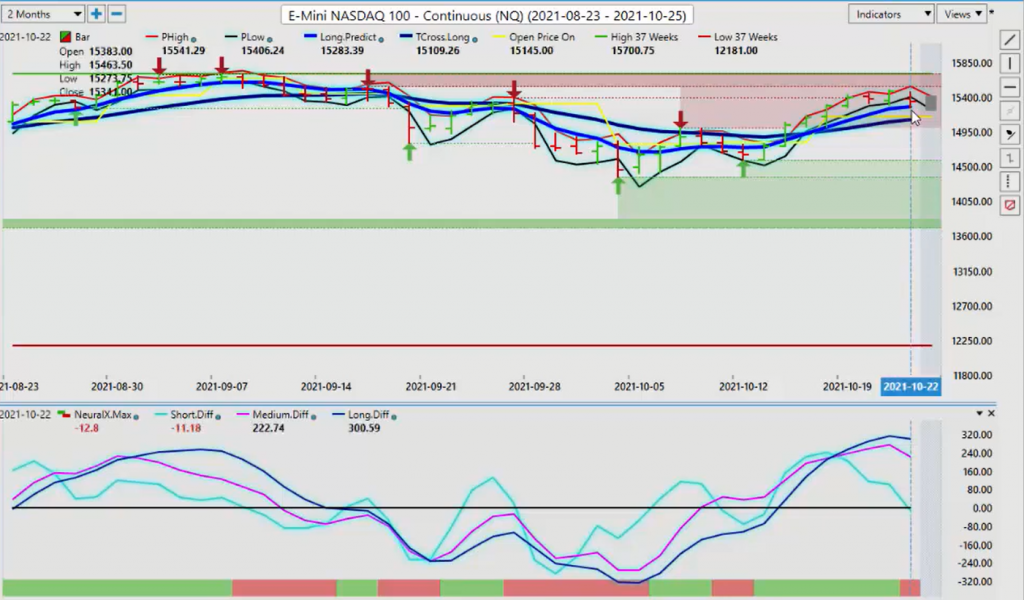
But the main thing is we’re looking for the market to continue to advance. If it’s truly bullish, then we will make a higher high. And the way I would look at it, and I think probably some of your other analysts look at it the same way, I’m not looking to breach the previous day actual low. So right now, that is a concern for me. When I combine it with these powerful VP contrarian indicators that are saying, look, this trend may not be what you think it is. So again, we will watch the two main levels that you want to keep an eye on this week. The long predicted at 15,283 and the T cross long at 15,100. But if we get solid earnings on those FANGs, then the NASDAQ will continue to advance, but there is going to be some real choppy trading conditions going into next week.
Crude Oil
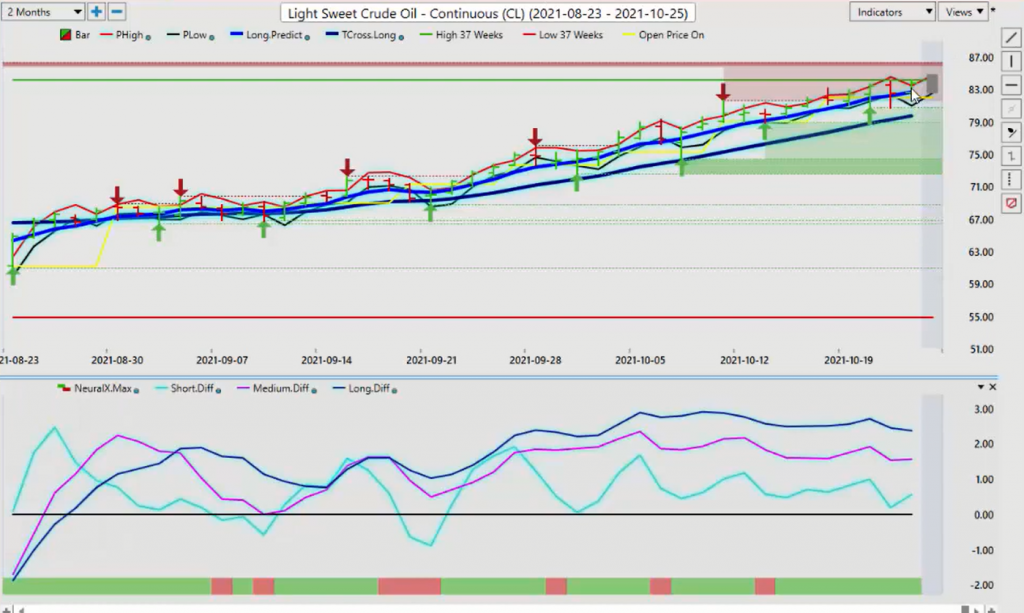
Now, when we look at light sweet crude oil, once again, we look at the structure of the market. We have the predicted highs and predicted lows where the VP predicted highs and predicted lows have been very, very good this past week. But we’re starting to break outside of the VantagePoint predicted low. And we’ve done that two days in a row. And that’s a little concerning. Then when we look closer at Friday’s bar, it warrants further examination here. What the bar tells us is that we didn’t really, we had a high of 84.22, and then on Thursday’s bar, we had a high of 83.96. So I think we agree, we didn’t put in a new high. Now the low point is 81.76, where this one is 80.79. So I don’t think it’s cause for panic just yet. But when we look at these predicted differences, again, we want to make sure we’re interpreting them properly.
And these are moving sideways. And slope of that angle is warning us that, look, we’re losing a bit of momentum here, so we’ll continue to monitor this. But again, there is still a pending energy, potential energy crisis. China’s still going after, anything that’s energy based, China’s buying. So that should keep oil contracts firm. But again, we also want to keep an eye on those global equity markets, more specifically the S&P 500. If it starts to pull lower and the NASDAQ drags it down, chances are that oil could follow it. That is the inner market correlation that we want to be mindful of.
Bitcoin
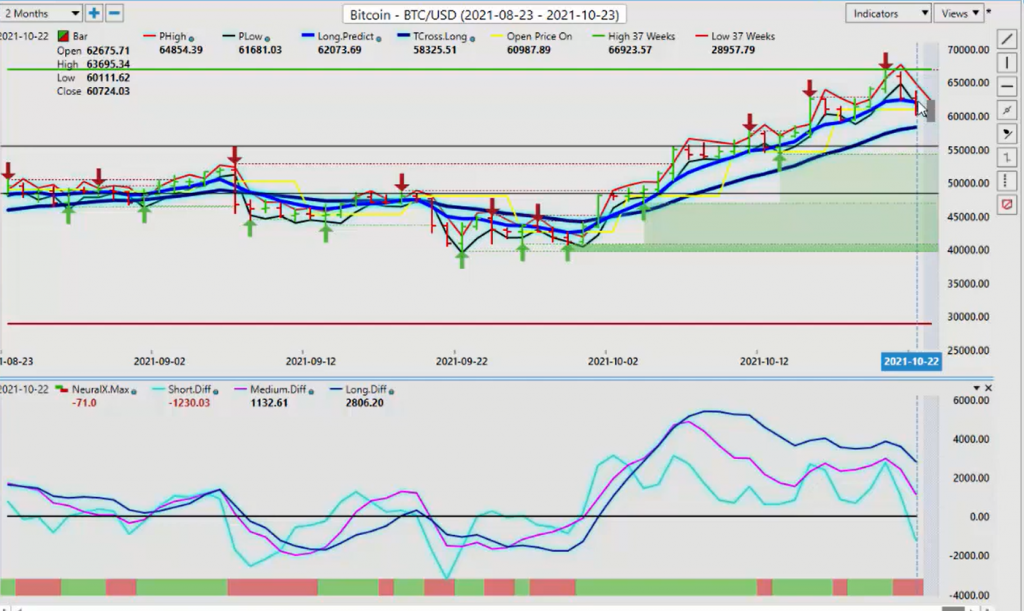
Now, when we look at Bitcoin, once again, I’ve been a strong advocate from early 2018 that that’s it. I’m not interested in shorting this thing. I’m looking for buying opportunities. We put in another all time high here, it’s advancing. But again, nothing goes straight up and straight down.
If we look closer at these bars, we can see that we’ve made a new high, and we didn’t go below the previous day low. We did that, again, on the 19th, we made a new high and we stayed above, we did not breach the previous day low. Then we look at this on the 20th. We’re still good. But then on the 21st, we’ve got a problem. We did not make a new high and we did breach the previous day low at 63,555. So this is warning that we’re correcting lower. It doesn’t mean that Bitcoin is done, and we’re going to just sell off. We’re going into a period of known US dollar strength, which is likely having some of the bulls here back off a little bit. But the T cross long at 58,325, this is the level we want to watch to begin the week.
The predicted differences are dropping the neural indexes down. So after a very big couple of weeks, it would be perfectly normal for Bitcoin to retrace. But you’re looking for the same pattern for a reversal that we can see with zero lag. Again, we don’t make a new high here. We breach the previous day low. And then on Friday, we take a much deeper move lower. You would be looking for the exact same thing here for a reversal higher, where we move down, for example, in this bar right here, then the next bar, we go slightly above the previous day high, but we don’t reach the previous day low. That ultimately leads to a rally here. So again, keep an eye on price and the verified zone. We have additional verified at the support low of 54,317, but again, Bitcoin still has potential for additional upside, in my respectful opinion, once we get through a period of known dollar strength.
Euro versus U.S. Dollar
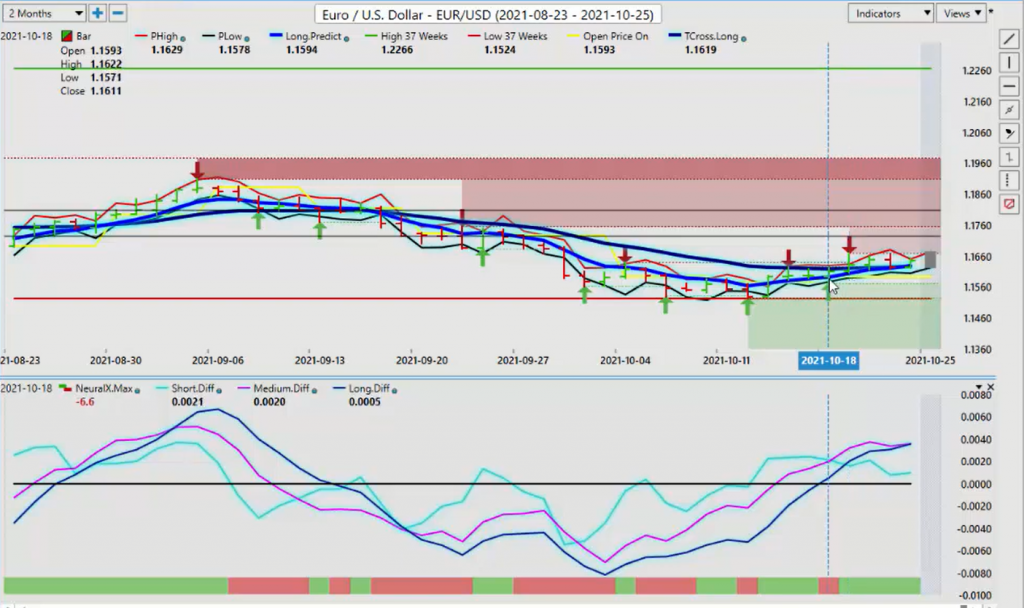
Now, when we break it down into some of our main Forex pairs that we’ll review for next week, the Euro/US remains basically stagnant between the verified resistance high at 1.17. And we’ve got a verified support low coming in at 1.1571. Now, once again, you can see that when we break outside of the VP predicted high, we often retrace right back inside of it and then stay inside of it. So the false break higher, making it look like it’s going higher, only to turn around and slip back within the daily range. Now my concern here is that on Friday, we did not make a new high. We didn’t break down below the previous day low, but you can see the actual strength of the medium-term trend and the long-term trend using the predicted differences.
That gap is starting to narrow. So when that neural index goes from green to red, we should be ready to go here, right, D back to the downside. I would anticipate by the middle of the week, the end of the week, that the Euro potentially could come under additional selling pressure. We want to watch that MA diff cross very closely to see if it can, again, if it can cross, then this resistance between the 1.17, basically 1.1670, and the real big resistance, which is coming in at 1.1755. It’s extremely unlikely at this particular point that the Euro is going to retrace to that level.
U.S. Dollar versus Swiss Franc
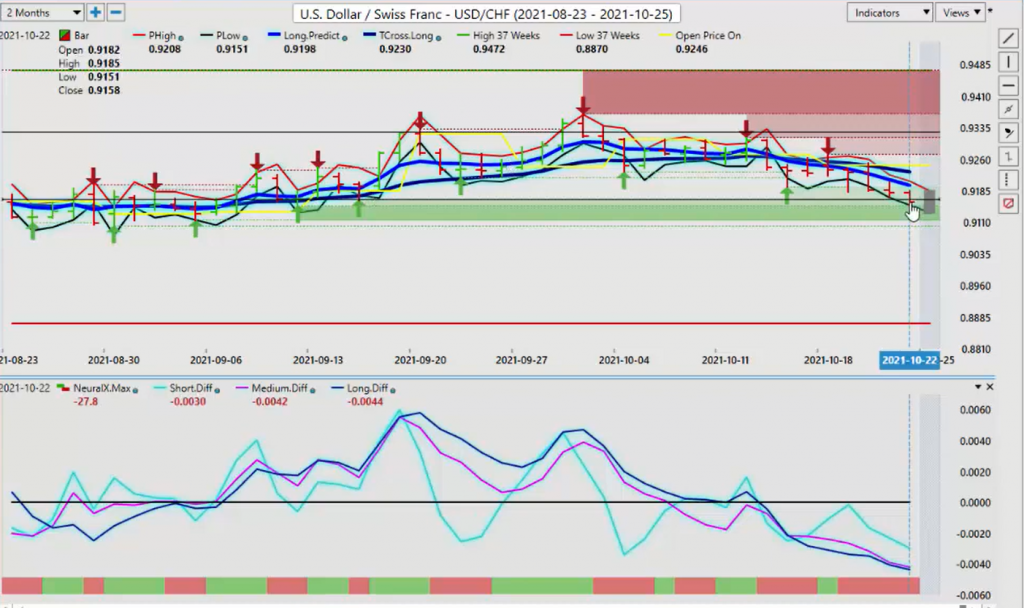
We would need gold prices, very close to that 1833 mark. Now if the dollar is getting ready, if a turn in the dollar is imminent or it’s coming, then that would suggest that US/Swiss franc is going to turn also.
So here’s what we would look for as currency traders, futures traders, and even as stock traders. We can assess here that we’ve made a big move down. The very next bar we were traced about 50% of this particular bar, but then made a new low without breaching the previous day high. We did the same thing on Friday. So it’s still moving down. What we’re looking for is the very second that this stops making a new low, and it breaches the previous day high, that will warn us that we’ve got a reversal. These predicted differences are already prepping us that that could be getting ready to happen. When that neural index turns green, we’ve got very, very heavy support down here between 91.50 and the overall primary bottom coming in at the 91 level, I believe we may have some buyers coming into this level. Just keep a very, very close eye on the dollar index.
Because if the dollar index turns, the first two pairs that will go with it will be US/Swiss franc, and this pair, the dollar/yen.
U.S. Dollar versus Japanese Yen
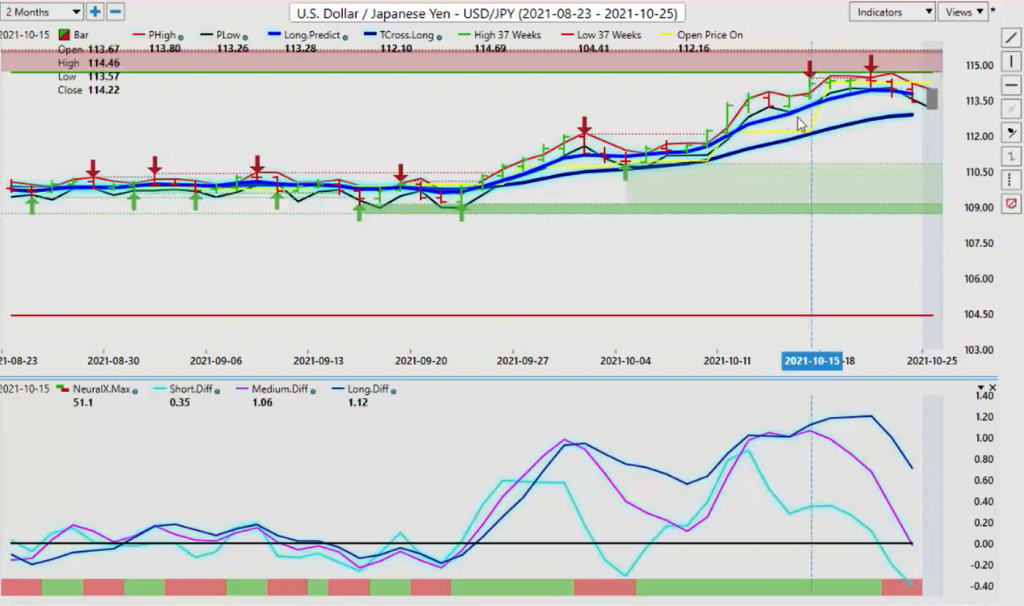
So the dollar/yen again, having a big rally up here. Once again, the power of that MA diff cross, the pink line crossing over the blue line, combining with the verified resistance high that’s at about 114.46, we start stalling out here. It’s very important to watch these bars. You can see we’re not making a new high. And then we breach the previous day low. Now this trend really started to accelerate when those predicted differences started pointing down with the neural index. So again, when we look at the structure of the market here, we have a high rate here. But the very next day, we don’t have a new high and we breached the previous day low.
That led to a very nice sell off in Friday’s trading that I was doing with my own direct client base. And I said, okay, I think we’re getting ready for a corrective move and we are likely coming back to the T cross long, which is coming in at 112.90. So our focus this week is to see if this is just a corrective move back down to the VantagePoint T cross long, or if we’re getting ready for a bigger corrective move. I respectfully submit that this level, as long as stocks remain firm, then the dollar/yen is likely to hold.
British Pound versus U.S. Dollar
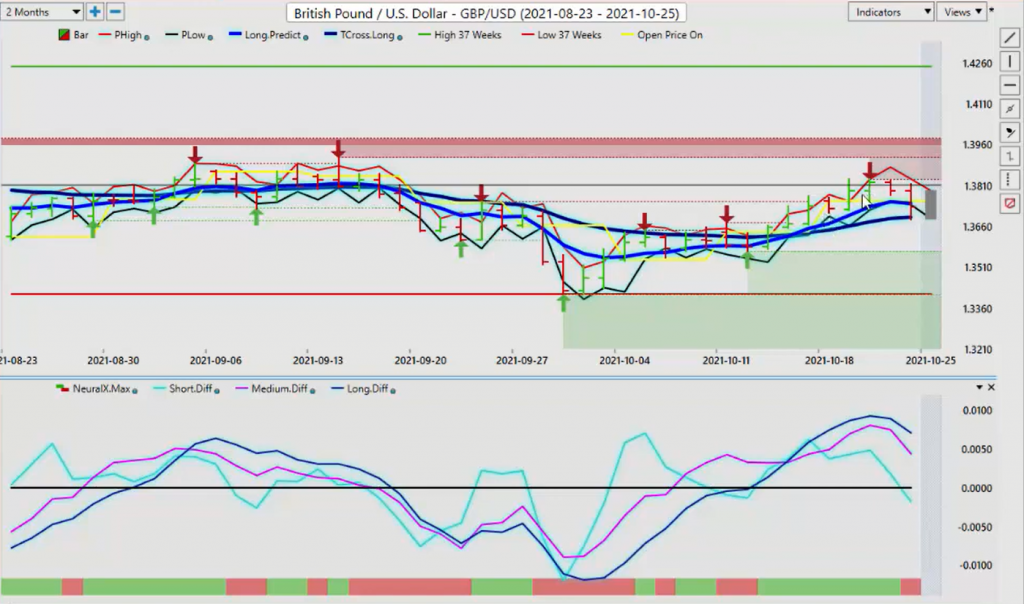
Now with the pound/dollar for next week, once again, we see a very similar structure here that we’re making new highs going up for the bulk of the week, but on Thursday we don’t make a new high. Now we didn’t reach the previous day low, but on Friday we did, you can see, we didn’t make a new high here.
And we broke the low of Thursday’s trading session. That took us all the way down on Friday to the VantagePoint T cross long at 136.93. So this is the line in the sand for us, guys. We’re looking to see if we can break down and hold below that T cross long, the predicted differences are rolling over to the downside. Our neural indexes turn red. It certainly looks at first glance that the pound is in trouble. But what we’ve talked about here and in the VantagePoint live training room is these Monday, Tuesday reversals. So if the pound takes a big rally up on Monday, the probability on Tuesday, it’s going to get crushed. So be mindful of that. We have this verified resistance high 138.34. This is proven to be very, very stiff resistance up here, not to mention the additional resistance up towards the 139 and 140 level.
So again, the T cross long is the one we want to watch. The long-predicted here, which is this blue line, the lighter color of the two blue lines, we have actually closed below that at 137.45. So when we look at the predicted high for VantagePoint on Monday, between 137.90 and 138.34, certainly cannot be ruled out for a potential level to set shorts.
U.S. Dollar versus Canadian Dollar
Now, as we look at the US/Canadian pair, as I’ve moved through some of these Forex pairs, once again, you can see how effective the VantagePoint software has been using the predicted moving averages. In this more advanced strategy, using just the predicted, moving average, not the black line, the simple moving average. When we look at the blue line by itself, we can see that the market has been in constant contact with this blue line acting as a reversal or pivot point in the market.
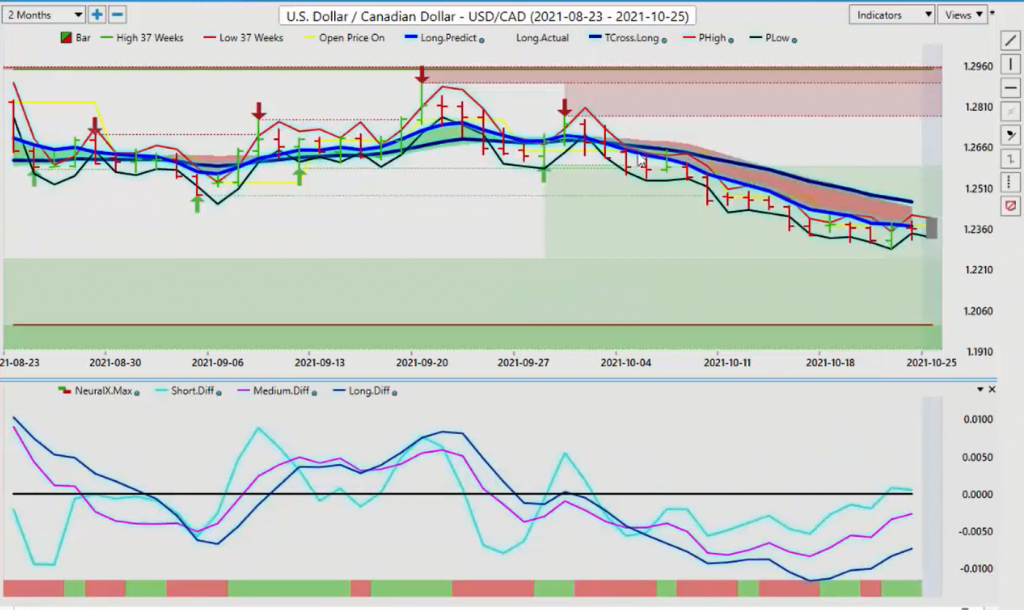
Now, my concern, what I’m seeing right now, is there’s two things. Number one, we did not make a new low on Friday and we breached the previous day predicted high. So I can draw that on there for training purposes. And you can see, I can put that right across there, like that. That we poked above the actual market high of 123.83. Now we didn’t close above it, but still we’re not making a new low below 123, the low from Thursday’s coming in about 122.88. So I would argue that that is a very significant level for this Forex pair next week, 122.80. Once again, just a possibility, a scenario that I’ve seen is that US/Canada crashes, and it goes lower on Monday only to completely reverse on Tuesday. I’ve seen this too many times over the last 20 years to even list it here.
So again, watch that level rate here. But if we can close above the VantagePoint long predicted at 123.68, at the very minimum, it’s going to bring us back to the T cross long at 124.59. And you can see how I’m using these levels. Let me just drop this down, I’m making sure everybody can see it. We’ve got our long predicted right here, and our T cross long. So our long predicted is color-coded by that blue line. And our T cross long is color coded by the dark blue line, making it very simple and saying, okay, if it’s below this, it’s a sale. And if it’s above it, it’s a buy. For a trend reversal, we need to get up into this area up here. So that’s what we would be watching for potentially going into next week’s trading. Now between the two pairs Aussie/US and New Zealand/US I’ll stick with just Aussie/US for this week so I won’t bore you guys.
And what we look for is, again, this is a classic reversal that potentially is in progress. We’re moving higher and making a new high, but we’re not breaching the previous day low. We do it again on Wednesday. Everything looks good. Then on Thursday, well, it kind of looks good, but not really. We made a new high, but we also broke down below the previous day low. That’s a huge warning sign on a price action basis that, look, I think we have a problem here. So then we look at Friday’s bar and we can see that on Friday’s bar, now we no longer made a new high, but we also broke down below the previous day low.
Australian Dollar versus U.S. Dollar
This is, again, a warning sign that we could be getting ready, the sediment in the Aussie currency, which would directly affect the New Zealand currency, that could be getting ready to shift.
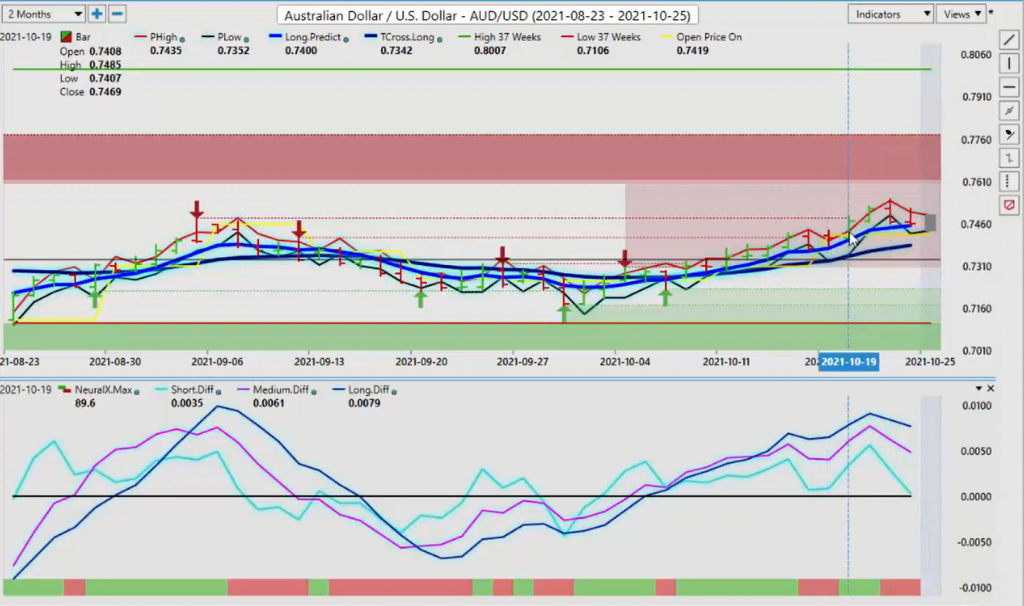
So what do we look for as VantagePoint users for that? We look for a breakdown and close below 7451, and for a sentiment or medium-term trend reversal, we’re looking for a breakdown below the T cross long at 7382. This methodology applies to all markets, whether it be stocks, futures, commodities, currencies, it’s all done the same way. And when we look at these indicators, our predicted differences, measuring the crossover points without actually having to look at them and say, okay, the medium term crossover is struggling a little bit here. That pink line’s pointing down. The blue line is doing the same thing and the neural index with the correlation to 31 other markets is saying, look, we have a problem. So if we were to look at that even closer, and we bring in the actual market details, if that Aussie does start to tank, which markets would follow with it?
Well, when we look at that, we could say, okay, well, as long as it’s going up, these are all good. But these are markets that potentially could go down if the Aussie sells off. These different stocks, we’ve got different futures contracts. We’ve got very interesting there, right? Even natural gas, not a strong trend. But it also could mean that these 10 markets could be getting ready to go up. Again, the pound/Aussie, the US dollar/South African Rand, Kellogg stock could be getting ready to move. There’s a 69, almost a 70% inverse correlation to the Aussie. So the Aussie tanks, well, that’s a positive for Kelloggs. What about the leverage bear gold miners? Well, maybe? The cross payer Euro Australia, right? That could be getting ready to turn around. Forest products, Domtar. So this is what the basis of inner market technical analysis is, is seeing things before they happen, not after. So with that said, this is the VantagePoint AI Market Outlook for the week of October the 25th, 20-


