


Welcome to the Artificial Intelligence Outlook for Forex trading.
VIDEO TRANSCRIPT
U.S. Dollar Index ($DXY)
Hello everyone and welcome back. My name is Greg Firman and this is the Vantage Point AI Market Outlook for the week of October the 24th, 2022.
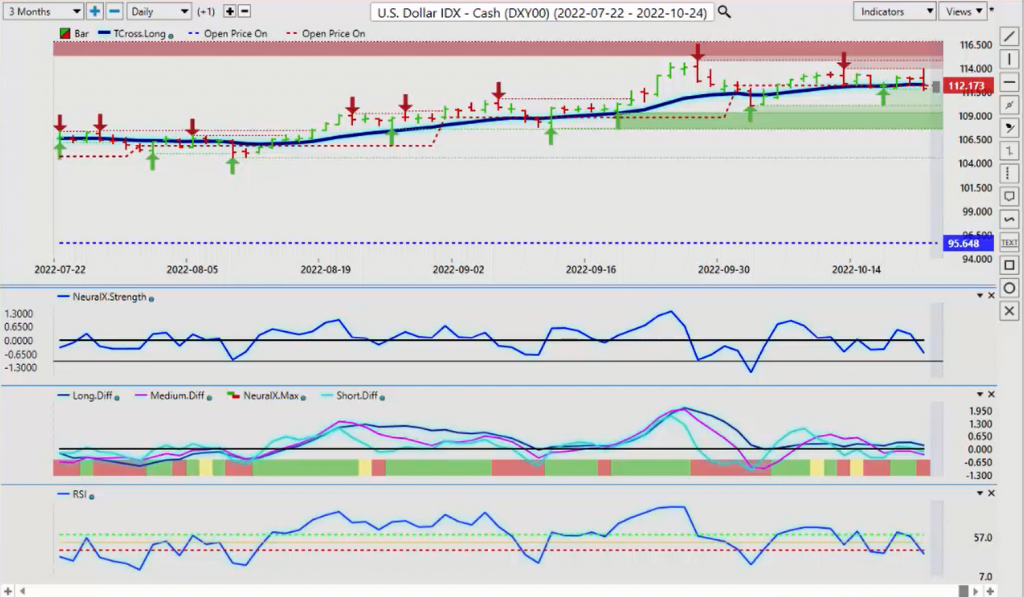
Now, to get started this week, we’ll begin where we always do, with the very important U.S. Dollar Index. Now, the dollar coming under a little bit of selling pressure this past week with a lot of rumors swirling around about the Fed pausing, the Fed not hiking as much. The Fed has not said anything like that. These are rumors from the media. The Fed has said they are going to hike 75 basis points in November. They’re not saying they’re pairing back. What they did say is that they’re not going to hike at a rate of 75 basis points forever and that immediately triggered some dollar profit taking and we’ve moved slightly lower. So, the immediate direction for the dollar to begin the week is likely to the downside. But, that, too, is likely very limited. We have additional verified support at 110.05. I would look for a possible test on that, assuming that we can break down below the immediate verified low at 111.77 and stay below that particular level.
Our neural index strength is down. We have an MA diff cross and momentum is building to the downside with the predicted RSI. Now bear in mind that we do have the ECB announcement this coming week and in most cases the dollar weakens a little bit ahead of the ECB on Thursday, so this is likely not a long-term moving the dollar simply corrective the rumor sell the fact on the Euro based around the ECB right decision on Thursday.
Gold
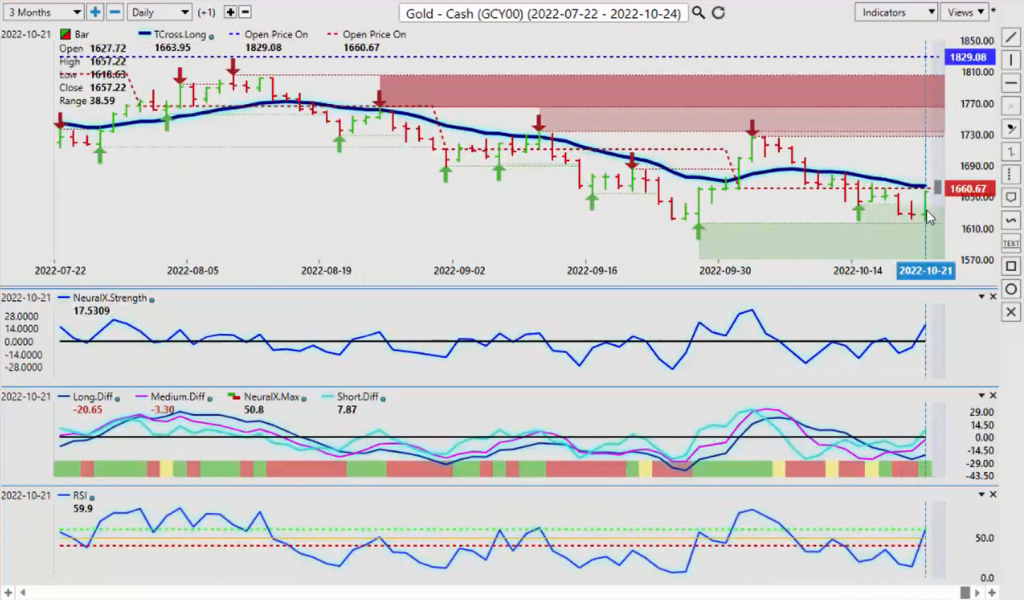
Now this is giving some life to gold, but again we’re still holding below that critical T cross long 1663 were still firmly below the yearly opening price, well down on gold contracts on the year.
Notice a lot of signs of life here, but we do have an MA diff cross that’s to the upside. Now, the MA diff cross serves two purposes. Number one and tells us to stop selling down here near this board verified support low, and that we are correct in higher in an overall downtrend which is indisputable. We’re below the yearly opening price of 1829; we’re below the monthly opening price, and we’re below the Vantage Point T cross long.
Now one of the ways that I would respectfully submit that this can be played, that if there is a gold breakout, what we can do is put a limit order, a buy limit order just above 1663, say around 1670, 1671, because once we want to be close above that T cross long gold should extend at least back towards the… I would argue the 1700 mark, but I also don’t expect gold to turn into a large uptrend. Remember that if the market is below 1829, the gold market is below 1829, it’s difficult to say that it’s bullish when we’re down this much on the year. So, again we will watch the verified support low, but I anticipate that, that will hold this coming week.
Crude Oil
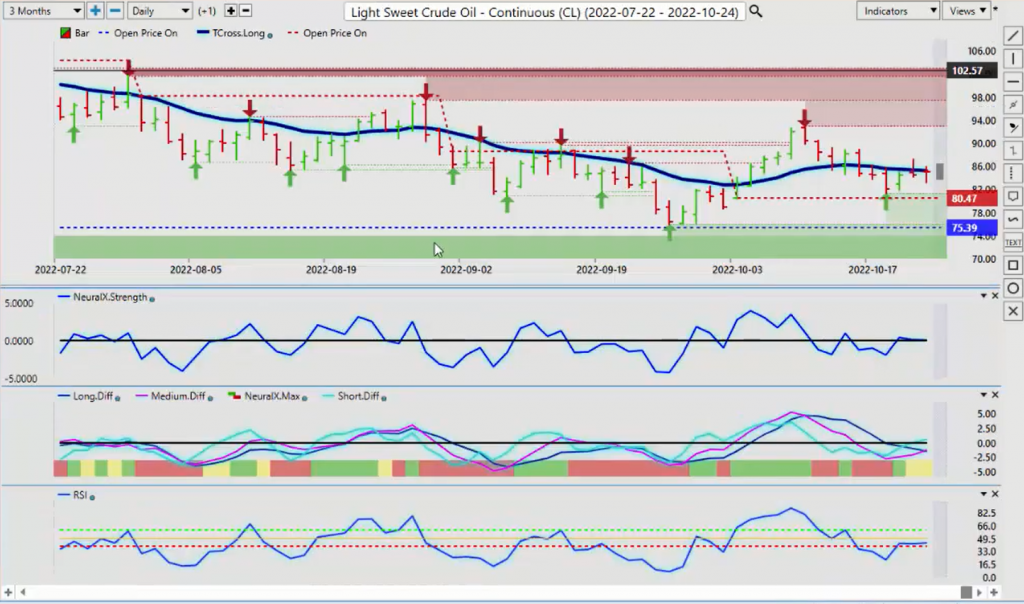
When we look at light sweet crude oil, oil basically just moving sideways, but as you can see, the yearly opening price and the monthly opening price at 8047 were stacked. These are stacked up underneath price providing that very strong support level, we’ve got a mixed signal here, but in MA diff cross, it looks like it’s about to complete. This could be another warning sign that we’re going to see some dollar weakness from Monday through Thursday next week. But again, that would likely be short term weakness because the dollar remains in a firm uptrend. So for now, the monthly opening price at 8047, I believe is a reasonable place for longs. And just make sure that your stops on any trade are below 7539.
Bitcoin
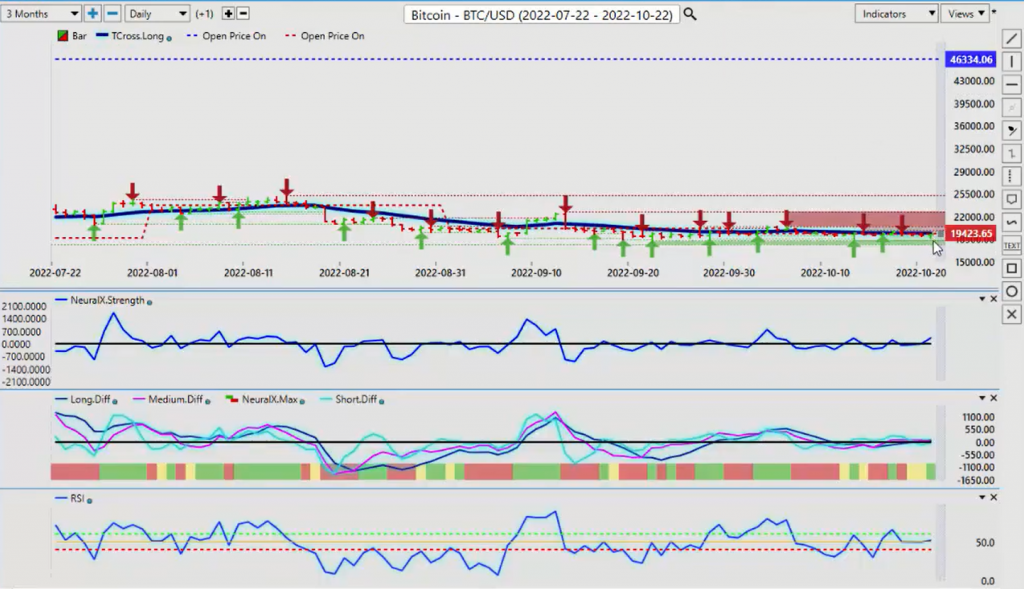
Now, when we look at Bitcoin, Bitcoin remains dead flat waiting for confirmation that the stock market is going to turn. Obviously, we don’t have that, so Bitcoin remains flat at 19,423 but it’s actually holding up quite well. Now the main indicators are basically just running flat sideways, we need a catalyst to either send the stock market higher or send it lower, and bitcoin will follow. So if the doctor pending move on the dollar is to the downside the short term, the short term move would likely be to the upside on the S&P 500 when we piece this puzzle together.
S&P 500 Index
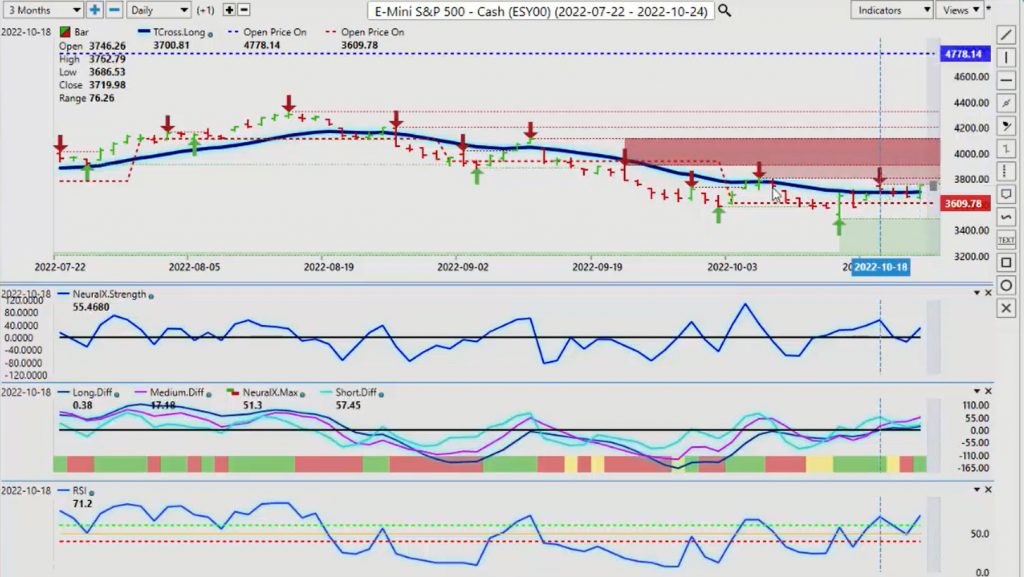
So, if we look at stocks, we can see here now that we’ve closed above the Vantage Point T cross long, but we’ve got two verified resistance levels. One high at 1762, but this is the big one here in my respectful opinion. 3806, we need to clear that if we have any shot of getting back up above 3907 and now that is possible but overall when we look at the structure, it’s always good to look at the long-term picture before you take a short term trade.
So if I back this up and I look at this over the last several years and I were to use this and gauge the market, the S&P 500 over the last five years, you can see that this is the first year in the last probably 10,12 even 15 years; that the S&P 500 has never been above its yearly opening price and we’ve had a very steep rise. And again this is a stepped formation as we’re going up using that yearly opening price. But this move down is reminiscent of more of an elevator-type move.
So, again, keep a very close eye on the level I’ve talked about for the last several months, which is 3636. We need to get up above that and stay above that level, that June low, and if we can’t, there’s probably more pain ahead for the stock market, okay?
Euro versus U.S. Dollar
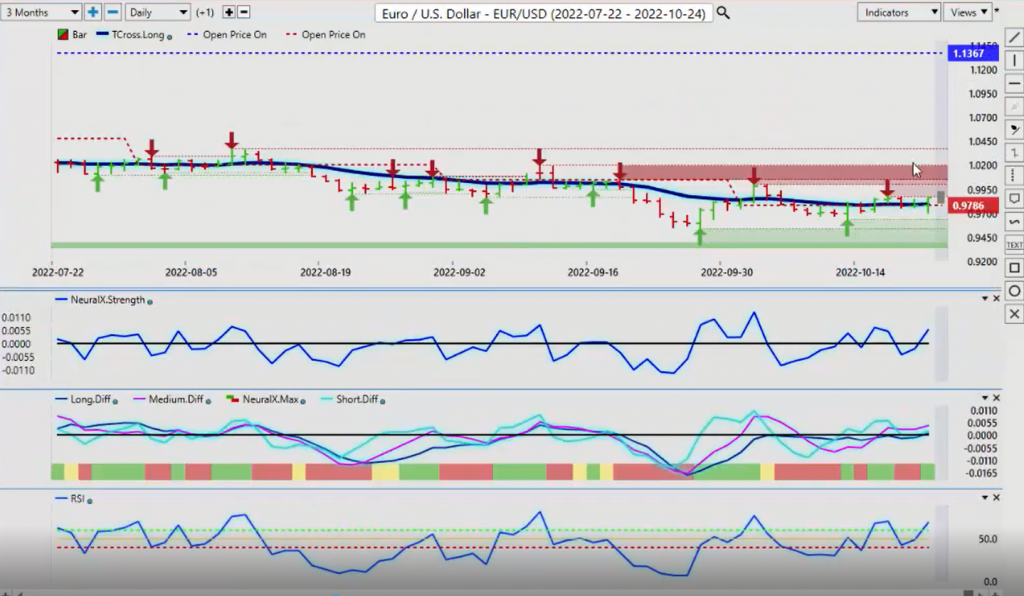
Now when we look at some of our main Forex pairs, the key one that we want to look at this week is the Euro. US, all eyes will be on the ECB so we’ll keep a close eye on that. They are going to hike. Excuse me, but it’s more about the…
I would argue it’s more about the statement than it is about the actual hike. The hike is a given. Where are they going from here? What does the European economy look like? In my respectful opinion, nothing has changed on that front. So the Euro is likely to make some gains next week until Thursday or Friday, and then it will likely resume its very strong downtrend. You can see we opened the year at 113.67. We are down huge on the Euro’s still. So the lower after we get through the ECB I would anticipate the previous lows around 9536 are likely still in play, but for now the initial move on the Euro is likely going to be to the upside, the predicted differences, the short medium and long or above the zero line.
Neural index strength looks good, we’ve closed only one day, but the T cross long 9799, we want to stay above this level the entire week.
U.S. Dollar versus Swiss Franc
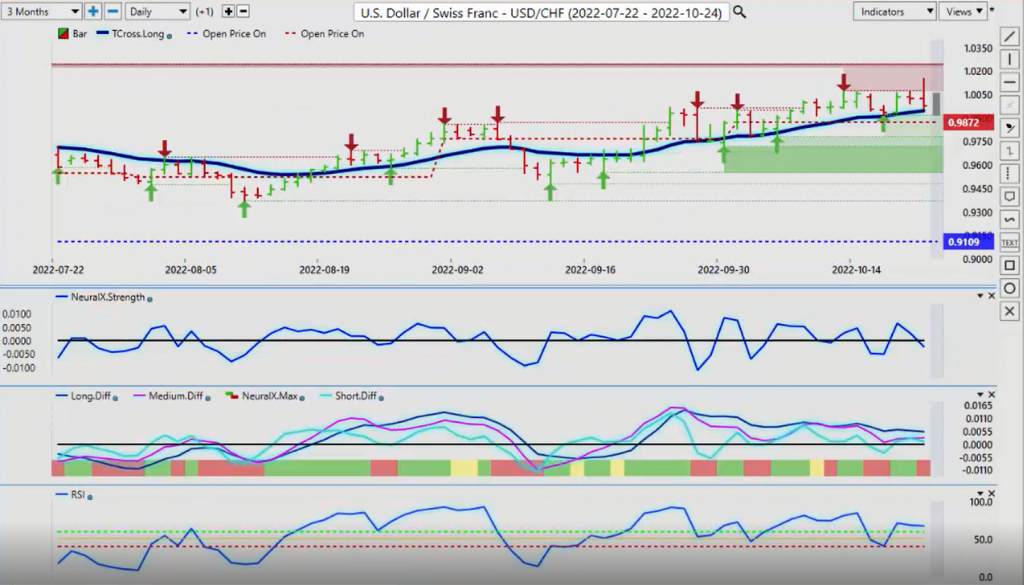
Now if the dollar index drops then we can expect that US-Swiss Franc would actually do the same thing. You that see here that we’ve had a big move up, but it’s always rumors that weaken the dollar, right? And again, you had the markets misinterpreting, in my opinion, what the Fed has stated on Thursday and Friday of last week. All they said was “we’re not hiking 75 basis points forever” and that was enough to send the dollar lower. But is that enough to send the dollar from the longer terms standpoint? I don’t think so.
So, right now the T cross long 9944. Keep a very close eye on that. If we can hold above level, and more specifically the monthly opening price at 9872 then this pair can extend higher. But if we lose 9872, that will confirm the dollars going lower, and then we would likely be moving into the verified low. Down in the lower 97 area.
British Pound versus U.S. Dollar
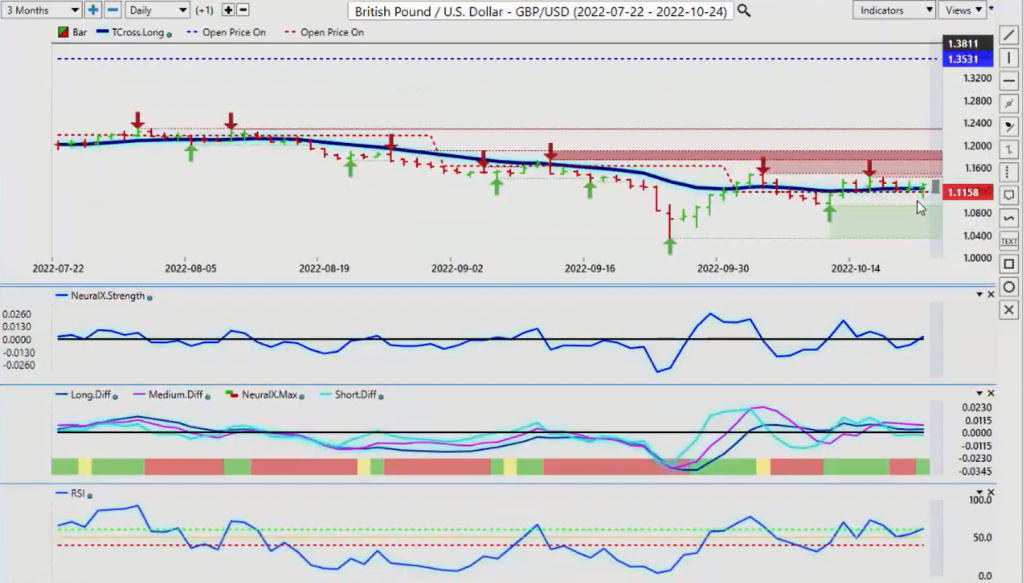
Now, the British pound US dollar for next week, this ones messy guys. My advice is just stand down and wait to see what the UK parliament does next. Who the next leader is. There’re rumors going around. Boris is making a comeback. I can only hope he gets a haircut this time before he does. But, it’s a bit of a mess over there right now. So again, I think the pound is going to move sideways until the downside, until they get this organized.
The verified resistance high coming in at 114.39. That is the level to keep your eye on. On the upside, the resistance points, the T cross long will come in at 112.35. That’s our support level. I would anticipate we’re gonna play both sides of this for the better part of the week.
U.S. Dollar versus Japanese Yen
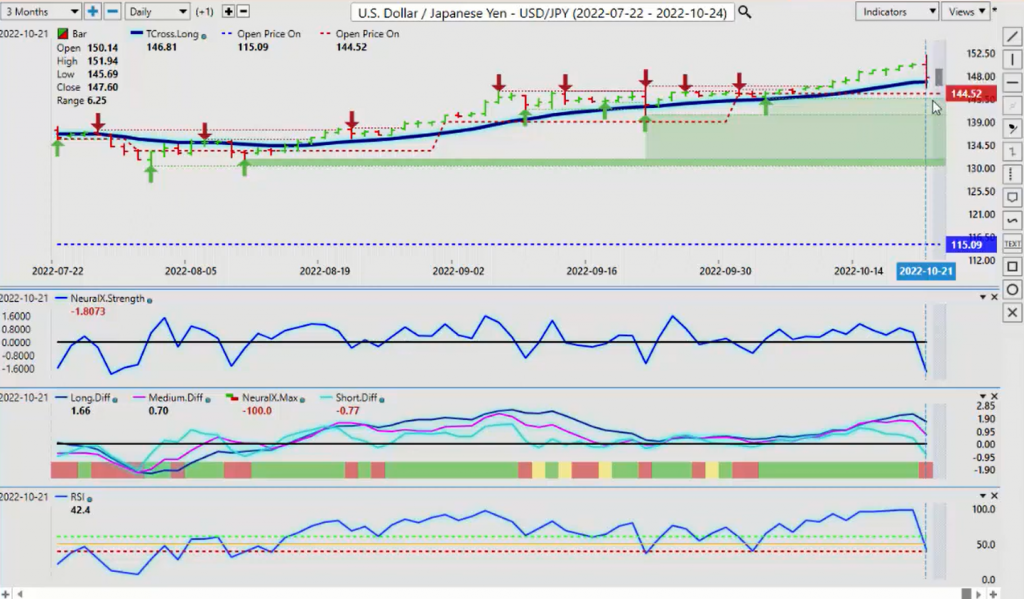
Now, when we look at the craziness, the circuits show around the dollar yen pair. This was expected. And quite frankly, I hope the bank of Japan pays dearly for what they’ve been doing.
So now they’ve intervened in the currency market, and I believe the market is going to punish them for doing so. So they were whining and crying about the Yen was too strong, that they were going to protect the 100 level. They basically intervened, weakened the Yen, but I still until this day don’t understand why they would bother doing that when we knew the Fed was going into a rate hike cycle. That would alone, would endorse the carry trades. So this is a mess that was created by the central bank, and again, my hope is that they are punished for this and the dollar Yen goes to 170 to teach them a lesson. To basically stay, it’s a free market stay out of it. But again, we will see, but I would imagine that the bank of Japan will be on the prowl again next week, watching for any further weakness in the Yen, and they’re going to try and prop it up. So expect to see a very volatile choppy week with this particular pair.
My advice, whenever the central bank is messing around like this, stay out of it. But the monthly opening price is 144.42. The T cross long 146.81. These two levels, if they continue to hold, than the market is simply going to ignore what the bank of Japan is going to do with intervention to weaken or strengthen. Now they want the Yen to strengthen. So again flip-flopping. If they had just stayed out of it, it would’ve probably have worked itself out. Much like the debacle of the Euro Swiss Franc pair, years ago when they pegged the euro to the Swiss Franc at the 120 level, and we all know how that turned out.
So again, be careful with this pair next week.
U.S. Dollar versus Canadian Dollar
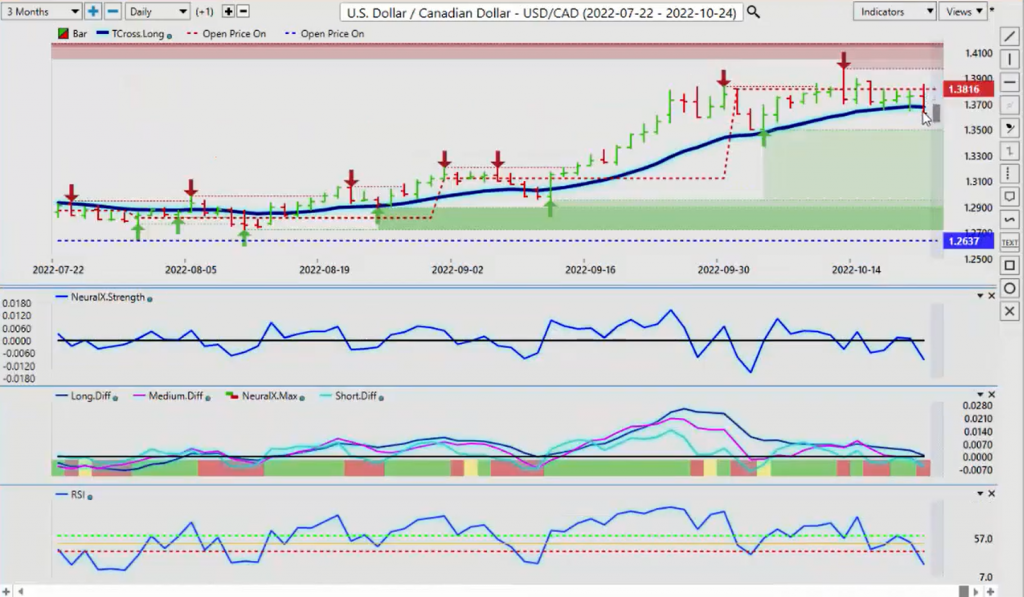
Now when we look at the US-Canadian pair, once again when we look at the US-Canadian pair, it has spent the entire week between the Vantage Point T cross long at 136.62, and the monthly opening price at 138.16. Now the weekly opening price last week, it moved above the monthly opening price, so we have resistance building up here. We did not retest the new high of the year, which is around 139.77. We did not retest that, so there’s a slight bearish bias here.U.S. Dollar versus Canadian DollarNow when we look at the US-Canadian pair, once again when we look at the US-Canadian pair, it has spent the entire week between the Vantage Point T cross long at 136.62, and the monthly opening price at 138.16. Now the weekly opening price last week, it moved above the monthly opening price, so we have resistance building up here. We did not retest the new high of the year, which is around 139.77. We did not retest that, so there’s a slight bearish bias here.
The indicators are pointing down, so if we can stay below 136.78, I believe the US-Canadian pair may have a chance next week of moving lower at 135.01. But this will be dependent on the stock market.
Australian Dollar versus U.S. Dollar
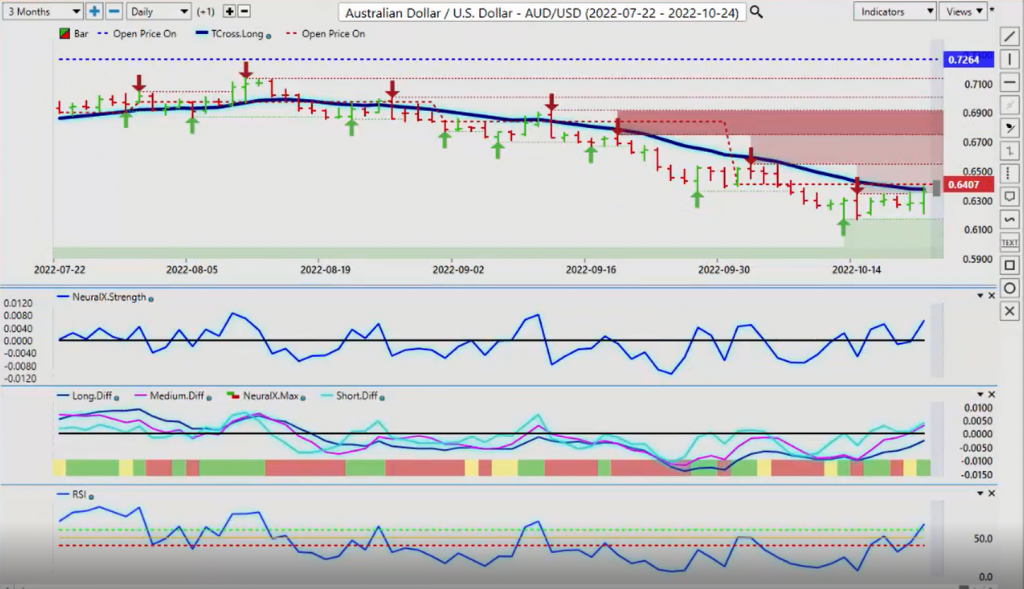
The same thing is applicable to the Aussie. It’s no longer a commodity currency. It’s an equity currency guys. It’s tied to the S&P 500. If the S&P goes higher than Aussie US goes higher. New Zealand US goes higher and US Cad goes lower. But if stocks are going to have a limited rally next week to say, maybe Wednesday or Thursday into that ECB announcement, if they’re going to sell off it will likely be towards the end of the week. So it’s some good possible opportunity here, but keep an eye on this 6407 area.
We can see that, that predicted moving average has slipped below the monthly or opening price, and that’s usually a pretty bearish set-up. But again, it’s going to be dependent on what happens with the S&P next week. Predicted differences are rising. The short medium are above, but the long is still down.
New Zealand Dollar versus U.S. Dollar
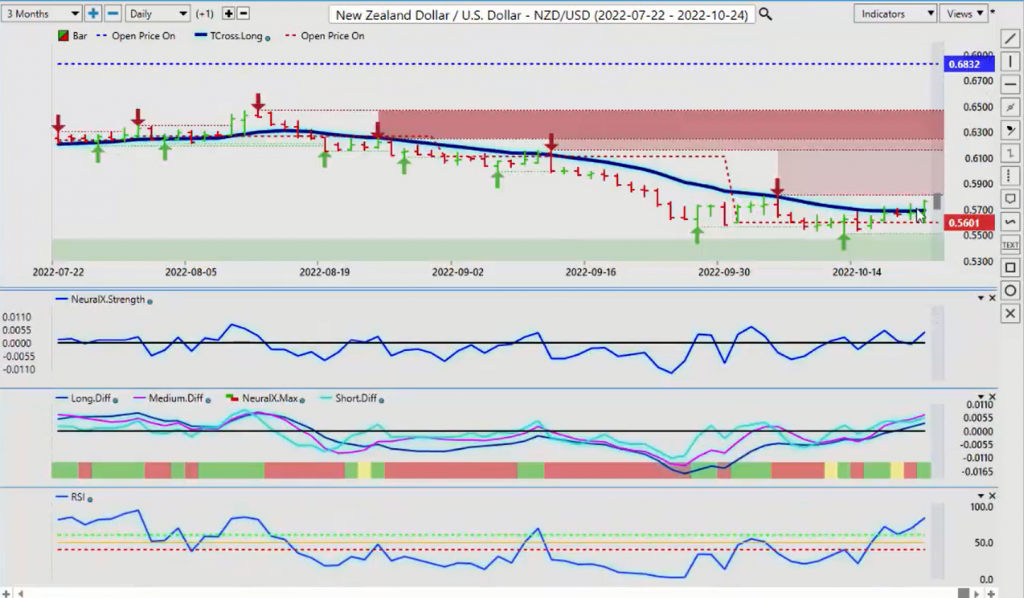
You’ll see the exact same set-up here guys, but New Zealand is slightly stronger. But you can see the congested resistance here or congested support.
When we look at that and do a comparative analysis to the S&P 500, if we look at this congested support around the monthly opening price, to simply confirm the Intermarket correlation between these two, when you look at this on the S&P 500 and bring in that Intermarket correlation you seen that same congested support around that monthly opening price. So it does give hope that stocks can move higher, even if it’s briefly. Aussie could move higher, New Zealand US could move higher, or US Canada could move lower. But all of these trades right now are dependent on that extremely powerful inverse correlation between the dollar and the S&P 500. So with that said this is the Vantage Point AI Market Outlook, for the week of October 24, 2022.