


Welcome to the Artificial Intelligence Outlook for Forex trading.
VIDEO TRANSCRIPT
Hello, everyone. And welcome back. My name is Greg Firman. And this is the VantagePoint AI Market Outlook for the week of May 23, 2022.
Now to get started this week, we’re going to begin where we always do with the U.S. Dollar Index. However, this isn’t the Dollar Index.
Magna International ($MGA)
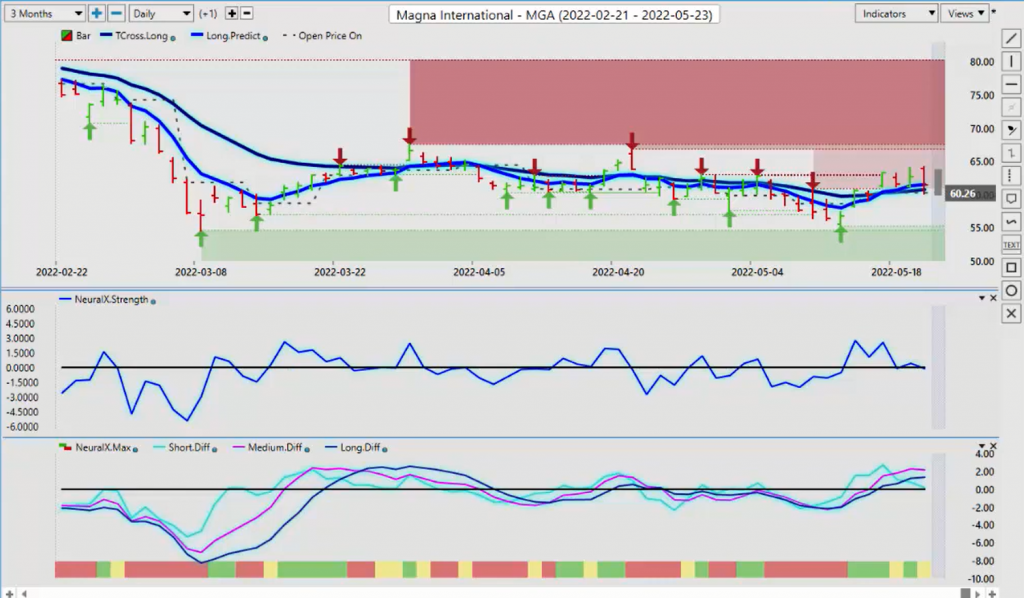
This is Magna MGA stock. Now, we looked at this last week approximately around the same time. You can see that this outlook is being done at 11:25 a.m. on Sunday while the markets are actually closed. This is exactly how we did it last week. I had discussed briefly that the Magna International stock has a very high inverse correlation to the Dollar Index. So again, this is something that we work on, just came off the VantagePoint Live Seminar in Tampa, and these are some of the things you learn at these seminars is direct intermarket correlations.
So last week, again, while the markets were closed, I identified and stated using the correlation matrix and looking at these intermarkets that there’s a very, very high inverse correlation between the Dollar Index and this particular MGA stock. Now, that came up in a stock scan, so I looked at it, and then I always look at the intermarket correlations, identifying 87.36% inverse correlation to the Dollar Index. That allowed me to make the prediction that the Dollar Index itself this previous week would likely not fare very well, providing that this particular stock continues to advance. So if we look at this, we go back, and, again, one, two, three, four, five. So we look at basically this stock, what it did on the course of the week. And again, this is not for the purpose of showing profits. It’s for the purpose of showing the percentage of the move and the fact that it actually did move higher in a percentage, so almost 7% this stock went up.
So when we are able to identify these things, we go back to the Dollar Index and we can see on the Dollar Index, if we apply the exact same methodology off the open or the close, whichever one you want, doesn’t really matter, we just do a quick comparative analysis between the two. And again, this shows us true intermarket correlation. So the 7% move in the MGA stock basically knocked the heck out of the Dollar Index based around that 87% inverse correlation. So again, this is all done while the markets are closed, before the market even started trading for the week.
U.S. Dollar Index ($IDX)
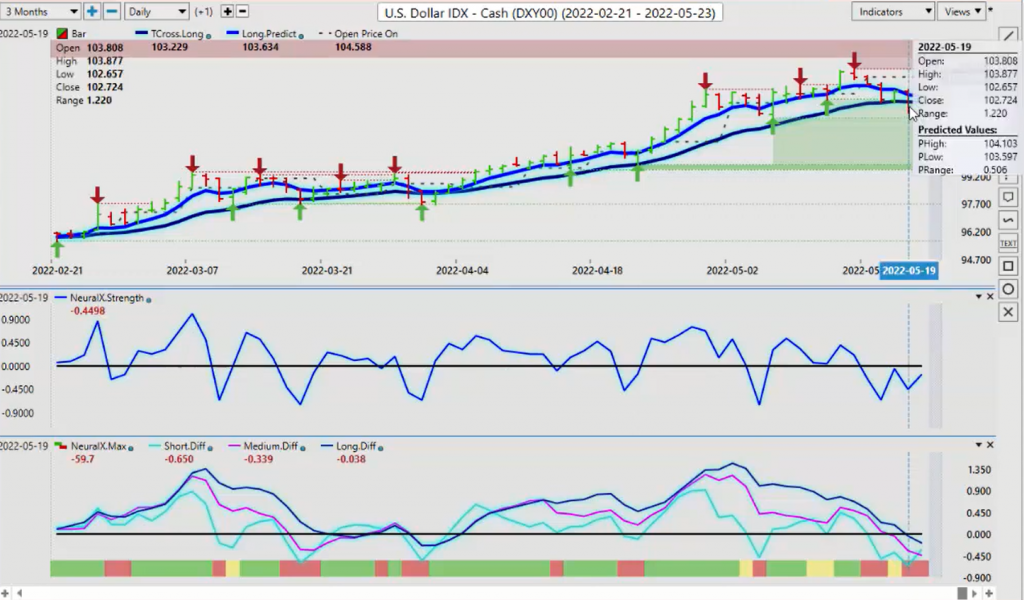
Now when we look at our Dollar Index, we can say that, well, we actually did predict that this happened before it did based around a stock, which essentially the average person would say has nothing to do whatsoever with the Dollar Index, but it actually does. So now with the dollar under pressure, we can look at that comparative analysis and say, okay, well, despite that huge sell-off on the S&P 500 this week, the Magna stock was affected, but not like some of the other stocks. It actually held its ground quite well.
So the Dollar Index, our key level to begin the week is our T-cross long and our long predicted. We have 103.21, excuse me, and 1.0350. So the theory here would be that as long as the market stays below these two main predicted moving averages to begin the week, because again, this is an outlook, not a recap of something that already happened to clarify, where it’s forward-looking outlook. So these levels, right now, indisputably you can see daily the market is coming back and banging into this long predicted at 103.50.
The other thing I will point out too is that even though the Dollar Index is above its yearly opening price, it’s below. The point in time indicator in the VantagePoint software is set to the weekly open. The market stays below the weekly open. As long as it stays below there, then there’s a strong possibility based on the MGA stock that the Dollar Index actually is going to go lower, as long as that one continues to go higher. So it gives us that added layer of confidence going into our Forex trading for the week or even our stock index trading saying, okay, well, the S and P 500 is likely to tank. We would probably all agree with that, but Magna didn’t. So again, if we’re applying that type of technology, we can see that again, as the market crosses over and closes, we hit our T-cross long two days in a row, but on Thursday it was just too much for it, the bulk of the move. But again, it opened right on the long predicted and then straight down.
So for next week, the dollar cycle or the dollar seasonal pattern is winding down. That usually is around mid-May as I’ve discussed in Tampa, at the live seminar and in the VantagePoint Live trading room and indirectly on the video weekly outlook. So once again, we will continue to monitor this to begin the week, but there is still a slight bias to the downside for the dollar, again, just because of interest rates and all these other things. Very seldomly does something go straight up or straight down, and again, there is a strong seasonal pattern attached to this.
To begin the week, our predicted differences are pointing straight down. You can see the short term predicted difference is starting to come off the bottom a little bit, but again, that’s a very short term indicator. The medium and the long term have crossed over the zero line. So when this pink line crosses over the zero line, a medium term crossover took place. When this darker colored blue line crosses over, that’s the long term crossover has also taken place. So there’s a bearish undertone to this, but again, as many negatives as there is for the Dollar Index, there’s still quite a few positives. I’ll continue to monitor this, but again, as long as we’re holding below these key levels of 103.21 and 103.50, then the biased remains again to the downside.
Gold
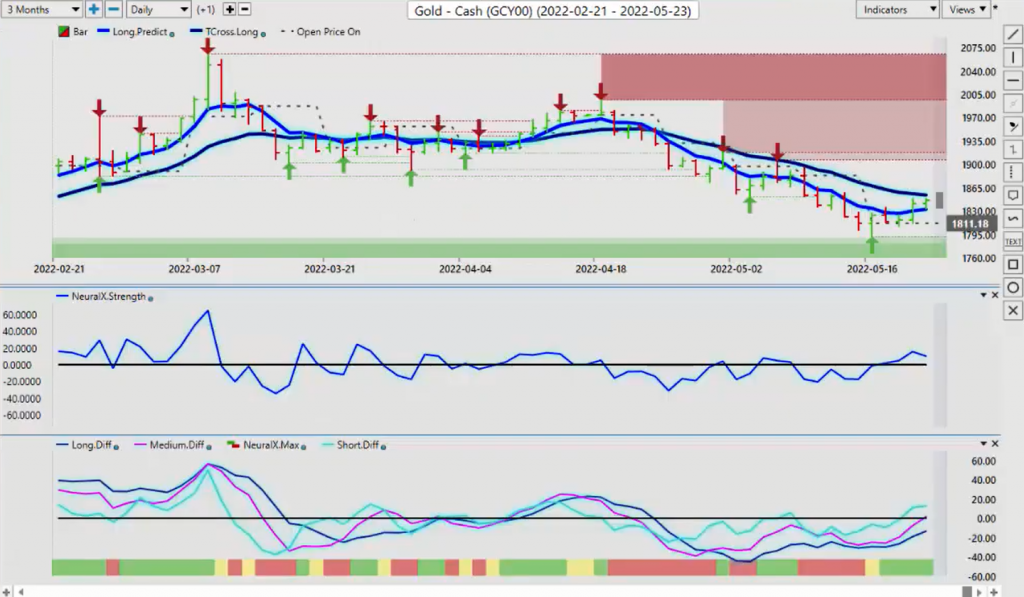
Now, as we look at again, we’ll flip over to gold here to make sure I don’t miss anything this week. Once again, you can see that I think that most would agree in the intermarket correlation world would say that if the dollar’s going down, then there’s probably a very strong possibility that gold’s going to be going back up. Now, we haven’t been able to clear 1854, again, that’s the VantagePoint T-cross long, the predicted moving average, but we’ve held above that weekly opening price the entire week. So the closing price at 1846, gold is going to have its work cut out for it next week, but it needs to clear the 1854 mark, and we need to hold above the weekly opening price if this has any shot of breaking through.
The indicators are starting to roll over positive for gold here, short term, predicted difference, medium term. This pink line crossing this zero line. People often say to me, “Greg, why are you not using the crossover points or the blue line crossing the black line?” Well, to be clear, actually I am using them. I’m using them via the predicted difference. I can monitor this and say, okay, the angle of the predicted difference is up. Soon as it crosses the zero line, I know a medium term crossover took place, but I customize these to use the long predicted and the T-cross longs because they’re very powerful pivot levels.
So once again, if we can clear and get above 1854, then gold may be able to move towards our next target, which would be the verified zone, the high at 1907. But again, rather a tall order here in my respectful opinion in gold. Quick way of looking at another seasonality, as you can see that last year gold pretty much peaked at almost the same level, maybe a little bit higher, 1902. So it would tell me that we are likely moving higher, but as we start to move towards June, June the 10th, gold could struggle quite a bit. Again, this is a quick way of just checking, what did it do last year at this time?
S&P 500 Index
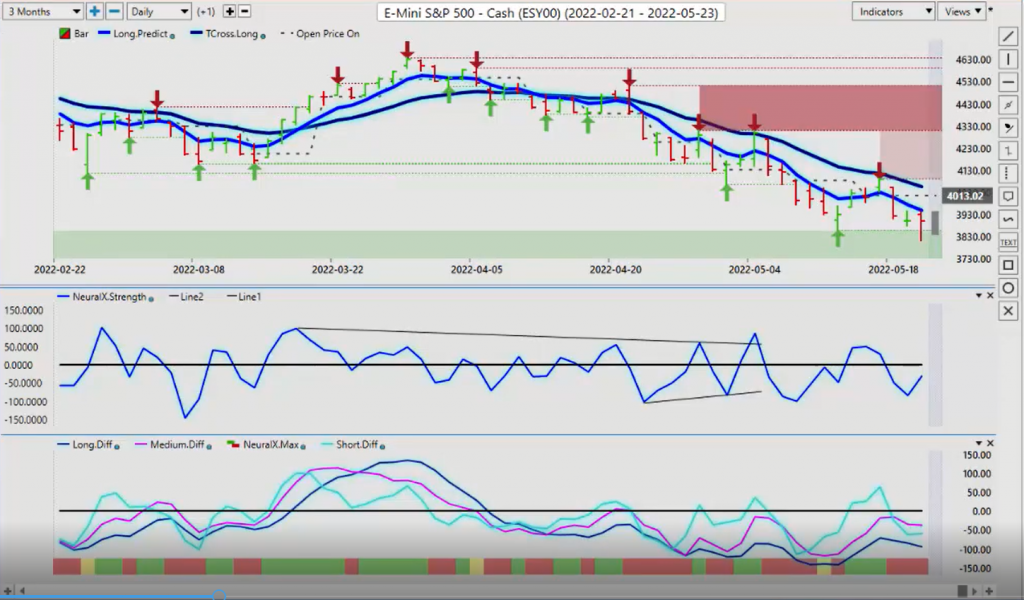
The main question that I keep getting, I’m sure everybody is too, the pundits on TV going on and on every week. It’s bullish. We’ve found a bottom. We didn’t find a bottom. Well, there is a verified zone down here on the S and P 500. That’s coming in at the low of 38.58. Now again, there’s a lot of negatives here for stocks. They’re saying they finally decided to make the call that the stocks are officially in bear market territory. Well, I would argue they’ve been in bear market territory for quite some time, especially when you’re looking at it via the VantagePoint software. I’m not one for going back and saying, well, if you did this on this day, this is what would happen, but each week I’ve discussed this.
We’re below the yearly opening price. We’ve been holding below our VantagePoint T-cross long, and our long predicted. You can see as the market comes back up, it really is struggling with that T-cross long, that was at 42.95. We came up this past week, once again, hitting into that dark colored blue line, the T-cross long down again, but this is Friday trading also, guys. I’m still not overly convinced that we’re just going to crash down to the 2000 mark on the S and P 500. We’ve got room to extend lower, but again, I think there’s going to be a lot of back and forth and any positive news, or if the fed backs off his position, even a little bit, this thing turns around very, very quickly as we’ve already seen on the last couple of weeks.
To begin the week, we’ve got a reverse check mark on our neural index strength that’s pointing back up, but still below the zero line. The main neural index still zero. Predicted differences still below the zero line. So still very much bearish. The key levels that we would have to break to take the pressure off the downside, 39.46 and 40.56. These critical pivot levels will likely decide the next move. If they continue to hold, well then batten down the hatches. We’re probably going lower, but if we can overtake them, then we could have some short term relief coming, and dollar weakness would actually help the actual stocks here because that means the fed is likely backing off his position.
Crude Oil
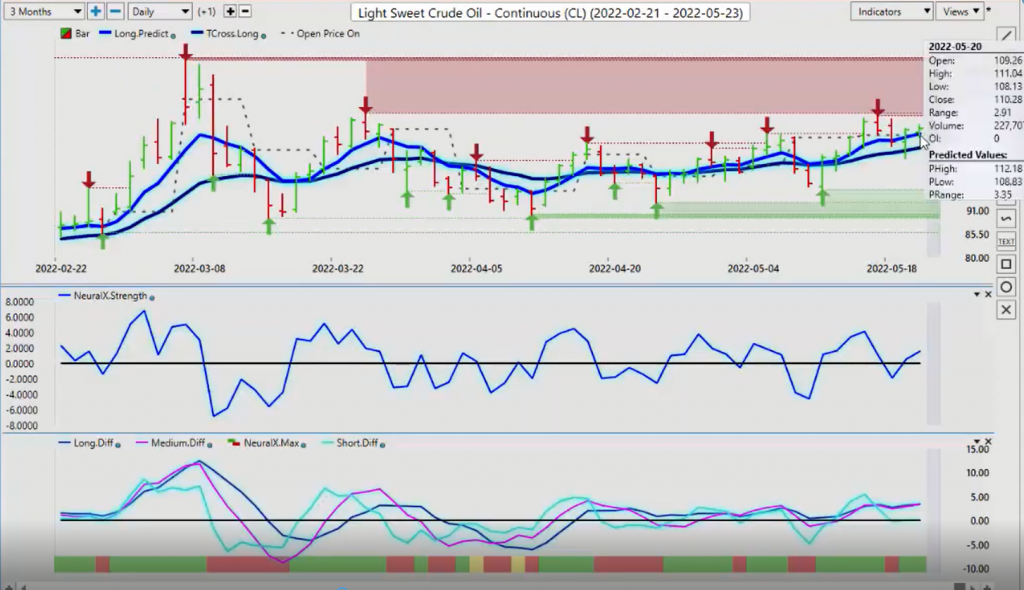
Now, when we look at oil for next week, once again, as I had discussed last week, it’s very unlikely that oil is going to overtake this. I think that the masses are about ready to revolt globally on gas prices. I know I’d be joining the protest, that’s for sure. We’ve got our high up here, the VP verified zone, that’s coming in about, I can’t even believe I’m saying this, $113.80 a barrel. And when we look at that, we’ve come up, had another failure here. So the indicators are still mildly bullish, I would argue. That made me a little nervous too on Thursday that they were buying heavily off the T-cross long at 105, but we’re not getting above this. My view is that somebody’s going to intervene here to knock these prices down.
But again, it is a strong, upward move, but if the fundamentals change with Russia, Ukraine, all these things start to change, you could see this reverse very, very quickly, but our key level to start the week, I have to stay with the primary trend long while above 105.71 here. Guys, as long as we’re above the VantagePoint T-cross long, it is still bullish. We’ve got our neural index strength pointing higher. Predicted differences though, again, a very much indecision here. We have a short, medium and long term crossover, but showing that via the predicted differences. But again, when we look at this right now, there are very much flat. There is a lot of indecision going back to this March 24th bar.
If the monthly patterns remain similar, then one could argue and say, okay, well, seems to be something going on around the 24th of the month here. If it’s going to fail, well, it could be Tuesday, Wednesday, but the one thing I will mention on this presentation, there is a Canadian national holiday on Monday. The oil prices will not be true on Monday. Okay. Your U.S. Canadian Forex pairs, stay away from that one on Monday. The Canadian banks and all the Canadian markets are closed. So again, you’re going to see volatility and oil, and you’re going to see volatility in the U.S. Canadian pair.
Bitcoin
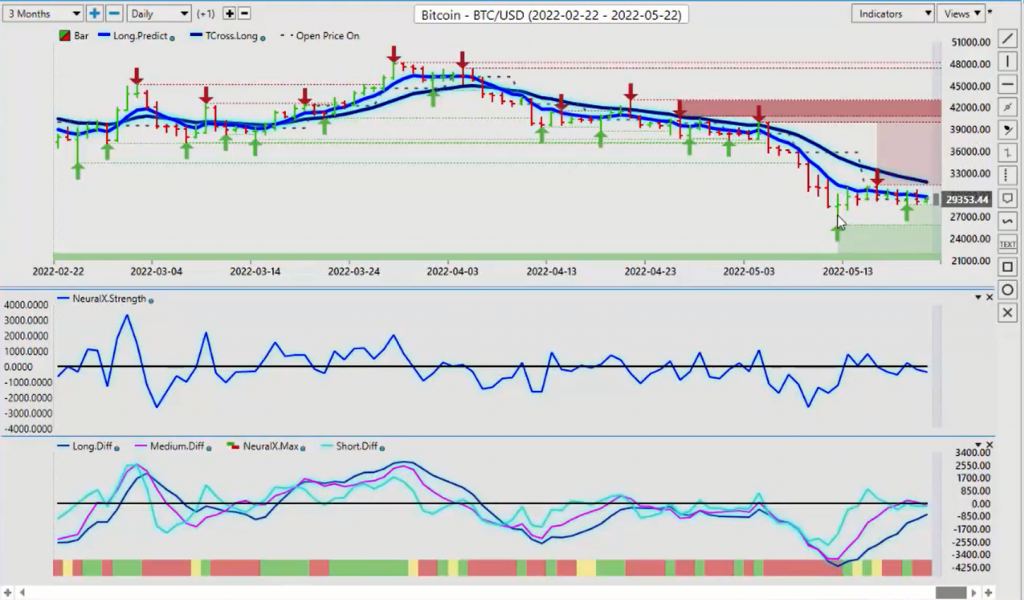
Now, as we look at Bitcoin going into next week, the main thing to understand here guys is that Bitcoin, right now it’s a NASDAQ trade, S and P 500 trade. The correlation is literally 98%. If stocks recover, then Bitcoin is yet another asset class that you can look at purchasing by ETFs, maybe futures contracts, but if stocks do not recover and there is no sign of a recovery, then Bitcoin will move lower with it.
As I mentioned in last week’s weekly outlook and in the VantagePoint seminar in a very successful, interesting seminar down in Tampa this previous week is that while the Bitcoin bears are having their day, and they’re saying, see, we told you Bitcoin was going to go lower. Well, in actual fact, we’re pretty much where we were last year. Aren’t we? It is important to point that out because I do find that these pundits on TV, the news, different websites, they get caught up in very, very short term trading and they can’t see the forest because of the trees.
So when you take a step back, you pull the charts out to the longer timeframe, you say, well, you know what, it’s kind of funny. It was down hard last year at this time too. So we’re not really expecting a turnaround in either stocks or Bitcoin, probably not for another, at least another month, maybe month and a half, if we get some good news, maybe sooner. But again, we’re really not that far off where we were last year in a known seasonal pattern of it moving lower. So once again, when I look closer at this, then the same deal here, guys, you can see that it’s a coincidence if it bangs into this blue line once or twice, I think we would agree. But if it does it 10 times and it can’t get through it, that’s a problem. Or in the alternative, somebody is knocking on the door and they’re getting ready to kick the door down. That’s an analogy I’ve used many times. We’ll watch the first one to get over, which is 29000.707. But if we can overtake the VP T-cross long at 31000.736, I would argue that stocks are in recovery mode and Bitcoin and stocks are likely to move higher.
Euro versus U.S. Dollar
Now with the year, looking at some of the Forex pairs for this week, the Euro enjoying a pretty strong week. But again, if we connect the dots to the MGA Magna stock and the inverse correlation to the Dollar Index, if the Dollar Index is predicting, as I did last week, that the Dollar Index would move lower based around that stock analysis, then in theory that there’s only one way that the Euro can really go here if the Dollar Index is going down. The Euro is going to go up. So if the Dollar Index holds below those levels, the aforementioned levels, then that would tell me the Euro has further potential upside here.
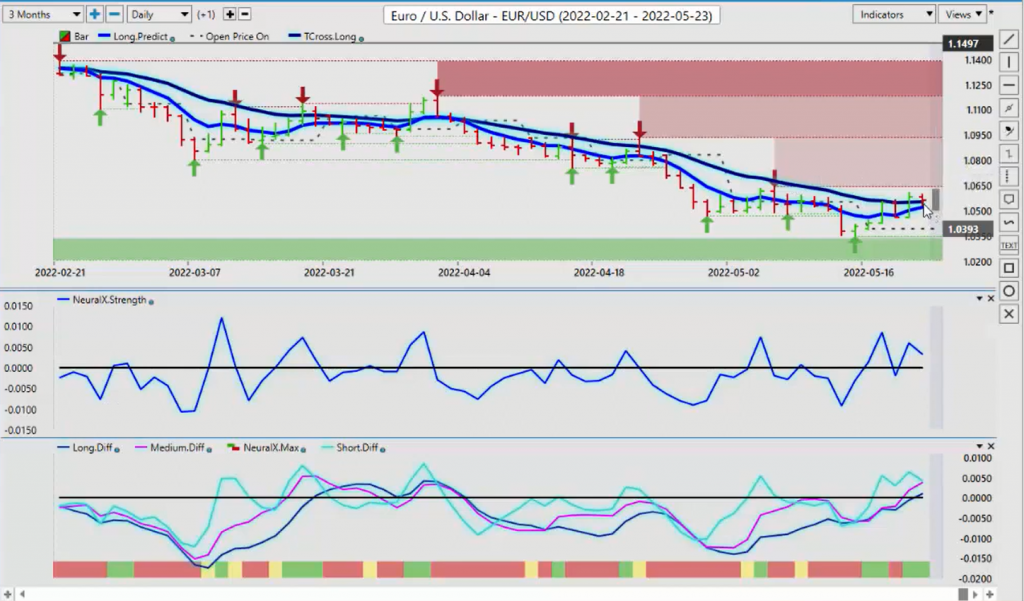
Now, there’s a lot of negatives about the Euro currency and the Euro zone in general, obviously, but that didn’t stop buyers from coming in. Starting with the weekly opening price, we’re holding above the weekly opening price. We’re repeatedly testing that T-cross long, but I would argue here too, that there’s very good two way action on this, this previous week. Very good two way action, both buying and selling. Pick your poison here, guys. But if you’re selling, you’re doing that around this 105.55 area or in this verified zone high at 106.42. That would be in my respectful opinion only the target we need to overtake next week. If we can’t overtake it, then the Euro will fall back down again.
But again, coming off, we’ve got some profit taking on the dollar. The seasonality of the dollar is winding down in the first quarter. There is reasons for the Euro to extend higher, even though it’s clearly in a down trend. Now, the predicted short, medium and long term differences, they’re breaking above the zero line. So everything is pointing higher on here, but one word from Russia and down it goes again. So you really are trading the news to some degree, but I would argue, even with that news, the Euro was moving higher based around the inverse correlation to the Dollar Index.
U.S. Dollar versus Swiss Franc
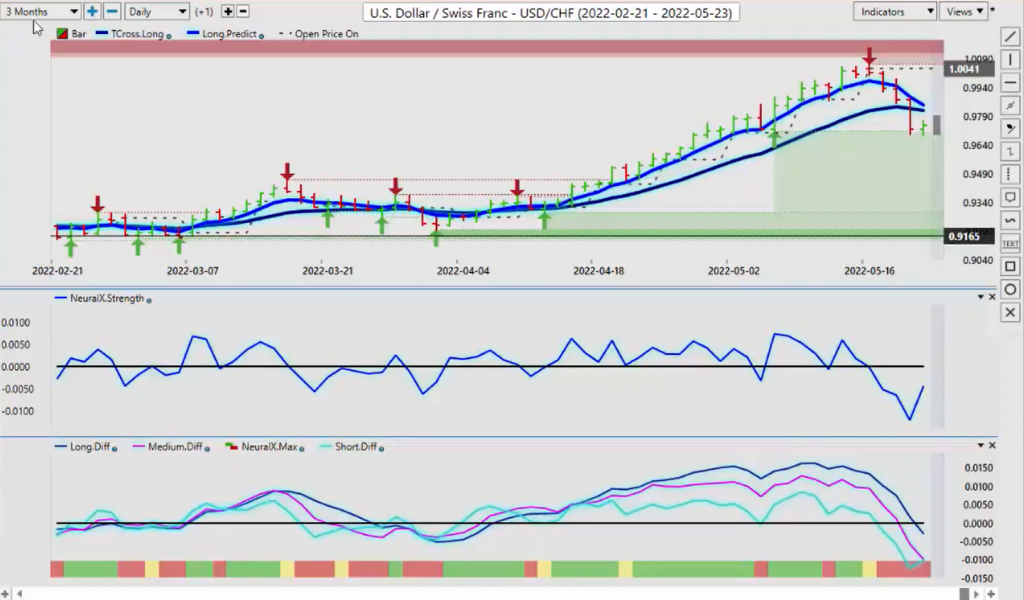
Now, U.S. Swiss Franc, even this one has taken a massive hit this past week. This is a carry trait. So again, when the Dollar Index comes under pressure, U.S. Swiss Franc immediately reacts. So to begin the week on this one, we’ve got two key levels, 98.49, and 1.0041, that was the opening price for the week, but 98.21 and 98.49, excuse me, this is where our key resistance now resides. So if you’re a seller, that’s where you are. If you’re looking at buying this pair, then I would not. I could say you could buy it off the verified zone, but a more ominous signal is pointing down. These predicted differences are looking quite ugly here pushing below the zero line, but I do have a reverse check mark on the neural index strength, which is suggesting, well, we’re going to get some relief, but that’s probably going to be capped around 98.49. And we can see the VantagePoint predicted high for Monday is also sitting close to that area, not on that area, but if you are shorting this, I would be looking definitely towards the 98.49 area.
British Pound versus U.S. Dollar
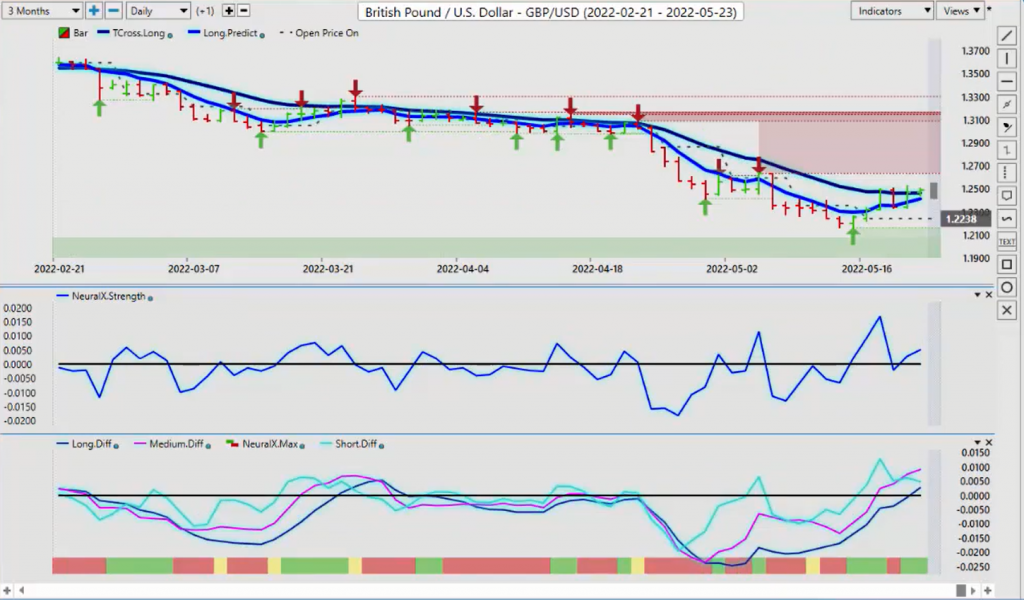
Now with the pound dollar again, a heavily traded pair. We had a pretty snap reversal there this past week. And again, that’s how quickly that if the Dollar Index comes under any kind of pressure, then that can have an immediate effect on Great Britain and U.S. So this is a pair you want to watch very closely. Once again, we look at the pound dollar here and we can see that once again, using these predicted moving average by themselves, by themselves, because I can see the crossovers with the differences down here, pretty strong move, but we’re getting all tangled up in this T-cross long at 124.66. So again, we’ve had a good close here. Well, yeah, I guess we did close over by a few pips, but not a lot.
This pair, if the Dollar Index really comes under pressure, this pair could really make a push here to the upside. It does look like a new trend is forming with the predicted differences, but we need to stay above by Tuesday, Wednesday of this coming week. Remember, Monday’s a holiday that oil prices will affect the pound dollar, but if we can close above this, we should be able to extend higher with the pound.
U.S. Dollar versus Japanese Yen
Now with the dollar yen, once again, the dollar yen is so much distortion with this pair based around the fed and everything else. So once again, we’ve got to be mindful if nothing else of these types of things because once again, the dollar yen is really all over the place. So when we look at it here, I bring up the dollar yen so everybody can see it. Once again, heavy support down here at the low of 126.95. Keep a sharp eye on this area. In my respectful opinion, sell limit orders sitting just below here is not a bad idea because again, a bigger, more ominous signal is coming.
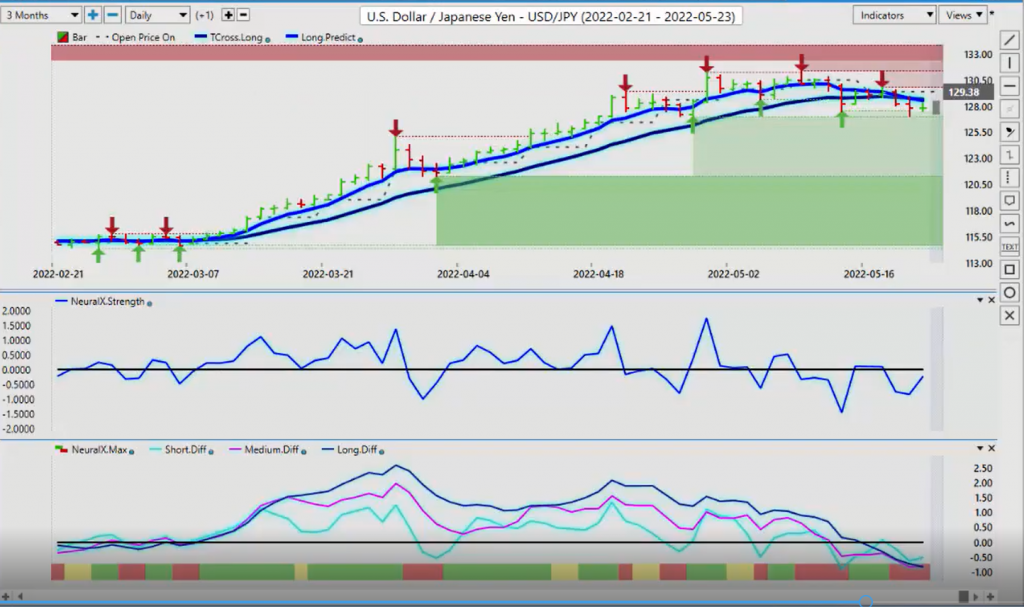
In my view, the dollar yen has no business being up at these levels. Price distortion at its finest. You’ve got the Bank of Japan intervening. You’ve got Russia Ukraine War. You’ve got gold prices potentially going higher. If those gold prices do go higher, the intermarket correlation here, even with the carry trade, would knock this pair lower. But again, I would advise to be very, very cautious with anything around Japan because of this distortion over the last few months. But our key levels to start the week 128.52, 128.68 short while above that area. If we break above it, we close above it two days in a row, then longs are back on the table.
U.S. Dollar versus Canadian Dollar
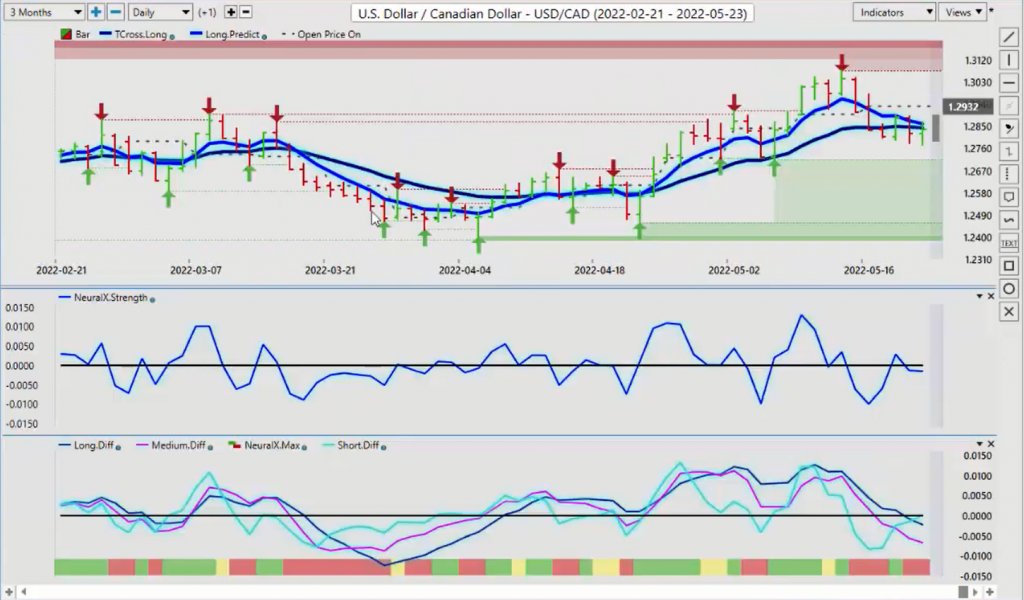
Now with U.S. Canada, once again, we did this one in VantagePoint Live training room. We did this in the Tampa seminar, a lot of fun doing it, the reversal Mondays and Tuesdays, but you can see the breakdown at the beginning right off the beginning of the week, and then we come back up and hit into this long predicted 129.21, as long as we’re holding below these levels minus Monday guys. Again, Canadian holiday, banks closed, oil price is not trading at full volume. Don’t fall for it. Okay. Your real price on U.S. Canada, you will see that by probably 10 or 11:00 AM Tuesday morning. Disregard Monday is my advice because it’s going to be all very, very choppy, all kinds of fake price, but our key levels here again, 128.61, 128.44. As long as we’re holding below that by late day Tuesday, then it should see further downside pressure for the remainder of the week as we move towards a potential target down in this 125, I believe that this low at 127, that we can hit that sooner rather than later.
Australian Dollar versus U.S. Dollar
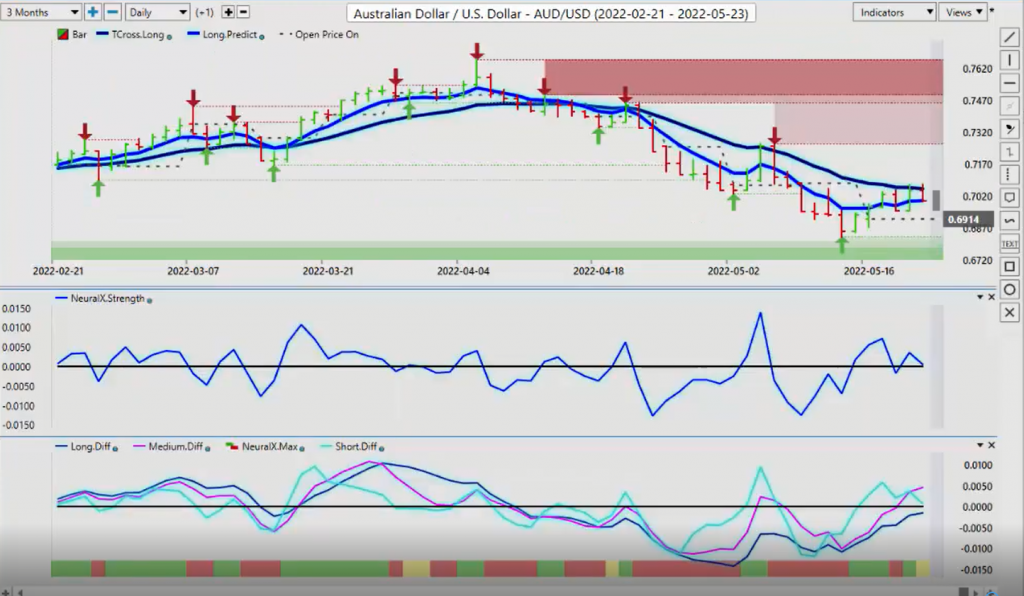
Now, when we look at the Aussie and the Kiwi, very similar, if not identical trades here, but again, you can see the pressure against that T-cross long. If we break through here, then that would signal broad dollar weakness right across the board because then you’ve got the CAD. The CAD’s already moving down there. The Euro’s moving higher, the pounds moving higher, U.S. Swiss. Franc is moving lower. It’s broad dollar weakness, but that could be again, profit taking on Thursday. So we’ll continue to monitor it. But what we do need to do for this coming week is get above 70.53. We get above 70.53, we should have a clean run back up towards the high at around 72.66.
New Zealand Dollar versus U.S. Dollar
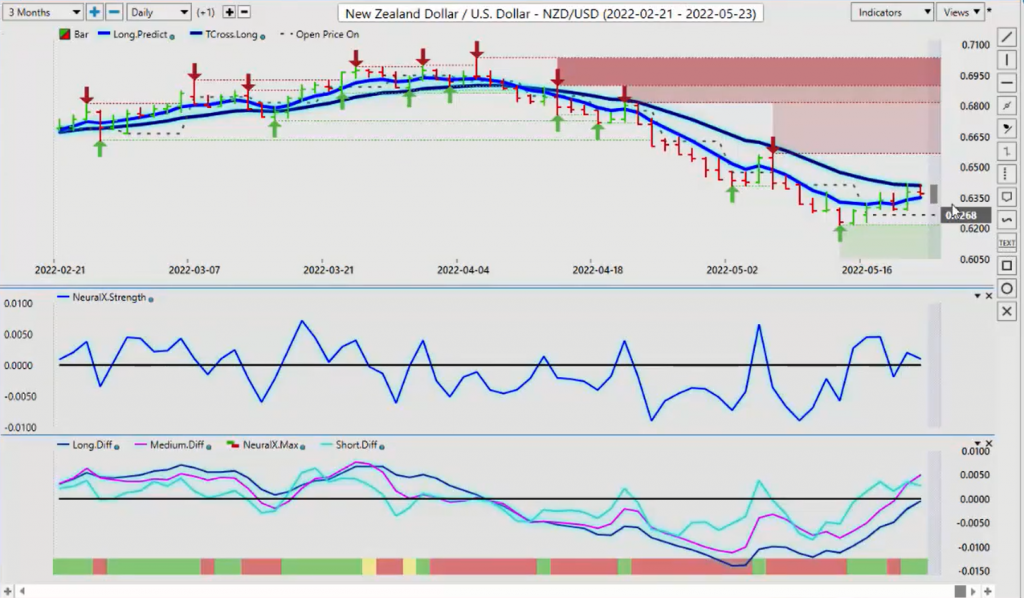
I would advise the same as New Zealand. They’re very, very similar. You can see here on the New Zealand, the Kiwi we’re looking to break through 64.10. We get through that, that opens up the door for again, broad dollar weakness. So holiday short week next week for some of us, but plenty of opportunity in the markets and enough meat on the bone for all of us. So with that said, this is the VantagePoint AI Market Outlook for the week of May 23rd, 2022.