


Welcome to the Artificial Intelligence Outlook for Forex trading.
VIDEO TRANSCRIPT
Hello, everyone. Welcome back. My name is Greg Ferman, and this is the VantagePoint AI Market Outlook for the week of March the 21st, 2022.
Now, to get started this week, we’re going to begin where we always do with that very important US dollar index. Now, the indicators we’ll be using this week, the full list of them here we’ll be using bars, not candles. Our long-term crossover. Our long-term predicted difference along with our medium-term predicted difference, our Neural Index with the Neural Index Strength. Our point in time set to the yearly opening price, short-term predicted difference, a modified triple EMA cross where we’re using the T cross long by itself. And of course the very popular verified support and resistance zones.
U.S. Dollar Index
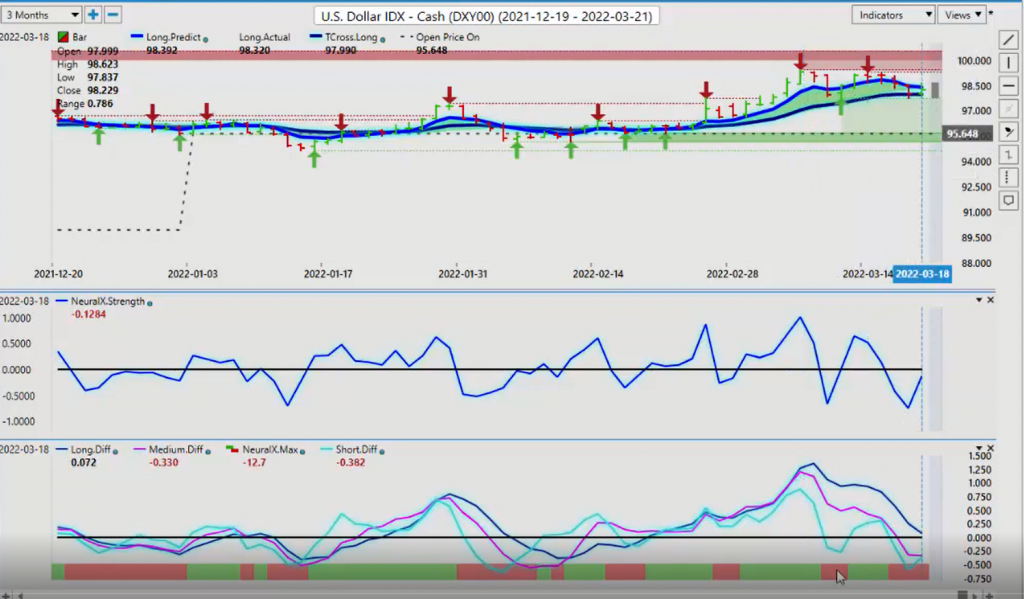
Now, when we look at the dollar, the dollar, the seasonal pattern in the dollar is likely coming to an end within the next week or two, possibly even sooner. Now, we’re holding on the VantagePoint T cross long. You can see that I have the longterm crossover by itself, the blue line, and then the darker colored blue line, of course, is that main support level. The T cross long. We also have a verified support zone hiding in there at 97.71. So all of our support is sitting right here. Now, in most cases the dollar is rather soft in this particular week going forward, but then gain strength again at the beginning of the month. But again, the overall seasonal pattern as identified in here in the VantagePoint software over the month of the better part of February in a very, very strong month of March is likely coming to an end here. Now we’ve got very strong verified resistance that’s coming in at 99.41. But again, we want to watch this support level very closely.
Our predicted difference is down here. Our short-term crossover has taken place, we’ve crossed over the zero line. Our medium-term crossover has also crossed over. Our long-term crossover though has not yet done that. So again, we’ll be watching this very closely, but our Neural Index Strength is saying a little bit of a recovery on Monday, but then likely as we move into the latter part of the week, the dollar is more than likely going to come under pressure. Now, if things heat up again with the Russian Ukraine war, then that would obviously strengthen the dollar on a short-term basis, along with gold. But these would not likely be long-term moves.
Gold
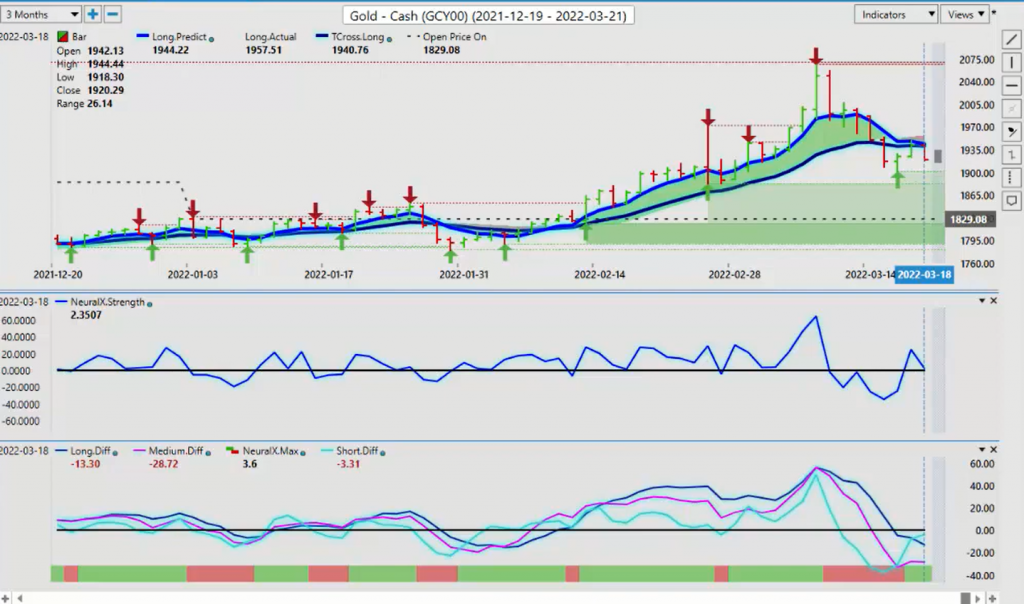
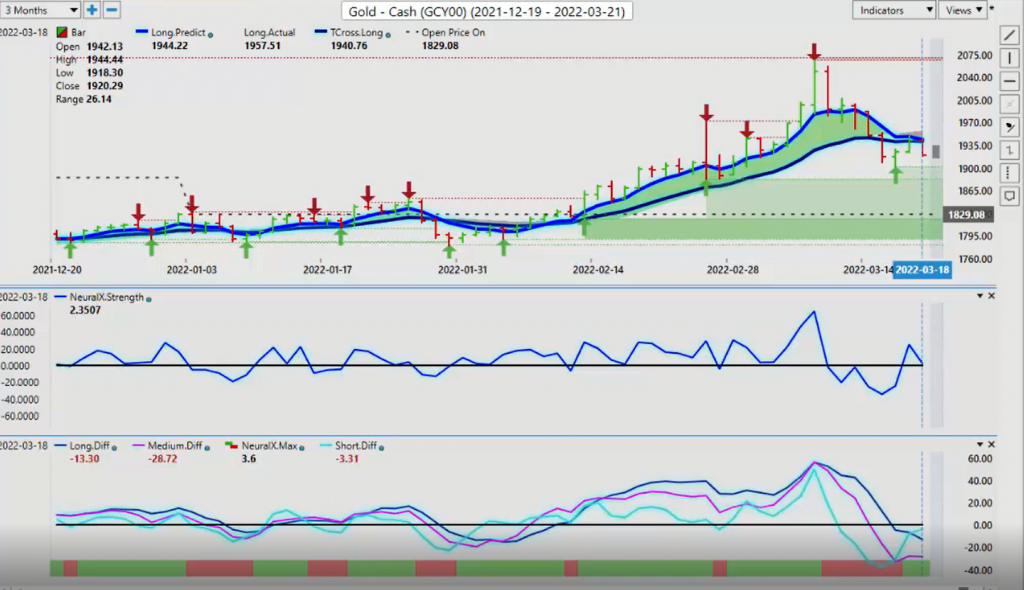
Now, when we do a comparative to gold, you can see that both the gold and the dollar are losing steam here together. Gold, a little bit worse. Now, once again, you can see that this moved actually gold moving lower, actually started happening on March the 8th. We’ve got a large bar. I see this quite a bit. We’ve discussed this in the VantagePoint live training room when, whenever we see a big bar like this, we don’t trade that because in most cases it’s the end of the rally. Now there is a seasonal pattern in gold where it is usually somewhat stronger in mid April through to about July. But this year I think Christmas has come early for the gold traders here with this move, with this Russian Ukraine war. So I believe that this move is the move we would normally see in the month of April and May.
So again, gold really struggling again. Our predicted difference is also here. The pink line represents the medium-term crossover that has taken place to the downside, just like the dollar, the same as the short-term, but in this particular case, this line right here, the long-term predicted difference that tells me there’s also a long-term crossover. So all of our three main crossovers have taken place and now we’re struggling staying above that T cross long. We’re closing below it on Friday. So again, when we look at these support levels now turned resistance, those levels are 1944 and our T cross long at 1940. So all resistance resides right at that particular area with a clear downside biased.
S&P 500 Index
Now, an awful lot of chatter in the market here about the S&P 500 and the overall global equity markets. A lot of people once again, like they were doing a month ago, calling a bottom here and well, I think we need to look closer at that for our stock traders. When we can see right now that it does look very promising for stocks to finally move higher. We’ve got a solid double bottom in place here. I would respectfully submit that this is your major support level. That’s coming in at 4161. But while everybody is spending a lot of time trying to pick a bottom through all of this massive sell off, I think the NASDAQ was down over 20% so far in the year, the S&P 500 around 13%. So again, trying to pick a bottom while this is moving lower in a known seasonal pattern.
Now the seasonal pattern with the S&P 500, usually to the downside usually concludes in the month of April and then, or in the month of March, excuse me. And then April, May June, those are much better months for the stock market. So, as long as we can hold down here, down around this, again, this 4161 level, I think that we can move higher. Our predicted short medium and long-term crossovers have completed. They’re above the zero line. Our Neural Index and our Neural Index Strength is positive. And then we have our long-term crossover. This is a customized crossover where I’m using the long-term crossover and the T cross long. So, as you can see, once again, these predicted differences tell me that a crossover has taken place, but I want to use the long-term crossover and the T cross long as a pivot level because there’s zero lag in that type of setup. As soon as we close above the T cross, the long predicted, then we would move forward and target the T cross long.
So our support level now is in exactly the same spot, pretty much that’s 4346 and 4327. So again, as long as we can stay above that level, then we’ve got a good shot at retracing. But once again, while everyone is trying to say, we finally hit a bottom here, just remember it was very easy to identify the top here. The yearly opening price, the price on open that’s coming in at 4778. And again, we’ve got this major resistance level in my respectful opinion at the high. This is coming in at or about the 4590 area. So I would be very cautious with longs around that particular area.
Crude Oil
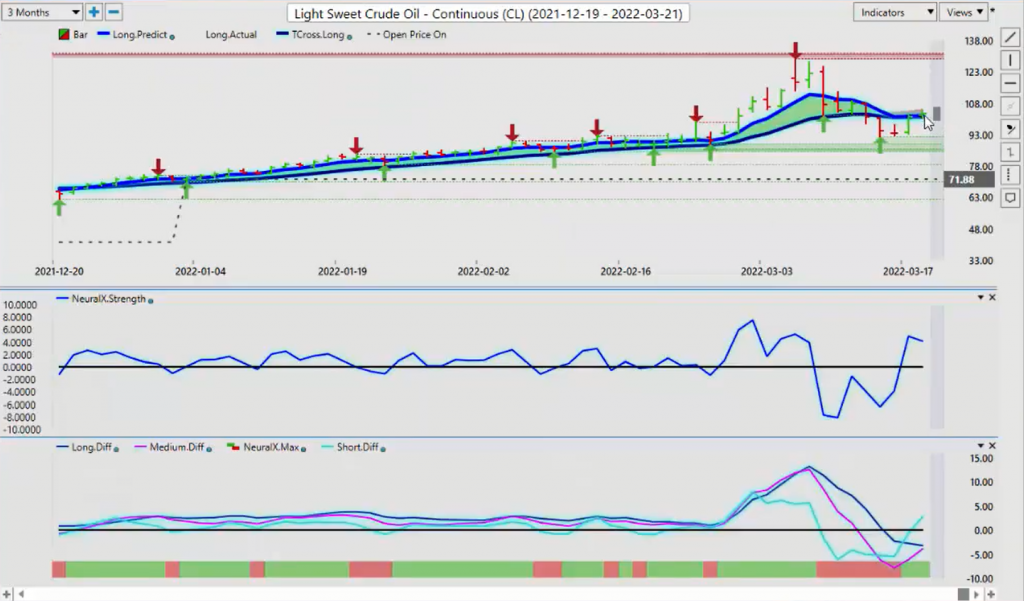
Now, when we look at oil, oil is starting to retreat here. But again, heavy distortion with what’s going on with Russia and the Ukraine. It’s starting to settle down a little bit here. We were not able to hold up above $100 a barrel but we could easily get back up there again. But for now, right now, we’ve got a pending long that is trying to take place here. Now, our short-term crossover, which is this aqua colored blue line, that represents the short-term crossover that has completed. Now, the medium-term and the long-term crossovers have not. They are still down here. So if we can get the medium-term crossing the long-term predicted difference, we could see oil rally back up again. But I think it’s going to start to settle down depending again, on what happens with the Russia Ukraine war.
Bitcoin
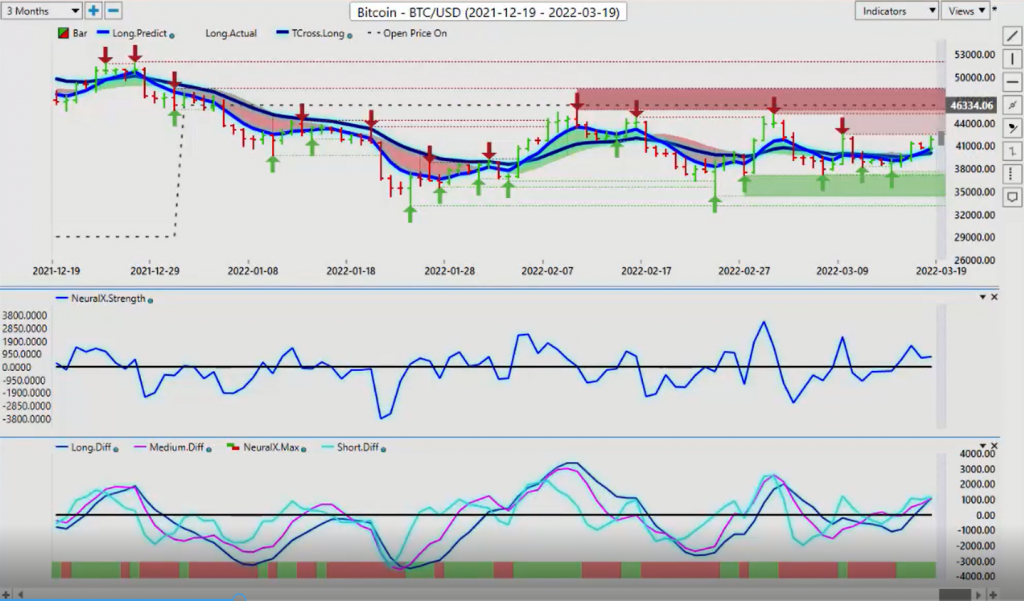
Now, Bitcoin, again, very heavy support that I’ve talked about this. I fully supported longs down in this area. Anywhere down around this 37,000 mark. We’re recovering. Things are looking pretty good here next week for Bitcoin. Our short, medium and long-term crossovers have completed. We’ve got our Neural Index positive, and we’ve got our Neural Index Strength above the zero line. It’s sloping somewhat sideways, but it’s looking much better. Now, our T cross long coming in at 40,000, our long predicted 40,640. So everything here looks good. But once again, that very ominous verified resistance high, that’s currently at about 42,350, but the really big one is up here. And that’s up at the high, which is 45,157. And of course we must get back up and over that yearly opening price if Bitcoin has any shot of returning back to that 50, 60, 70,000 market. And because again, that yearly opening price or the price on open, 46,333, that’s the level we must overtake and the VantagePoint indicators are warning us that we are likely at the very least heading in that particular direction.
Euro versus U.S. Dollar
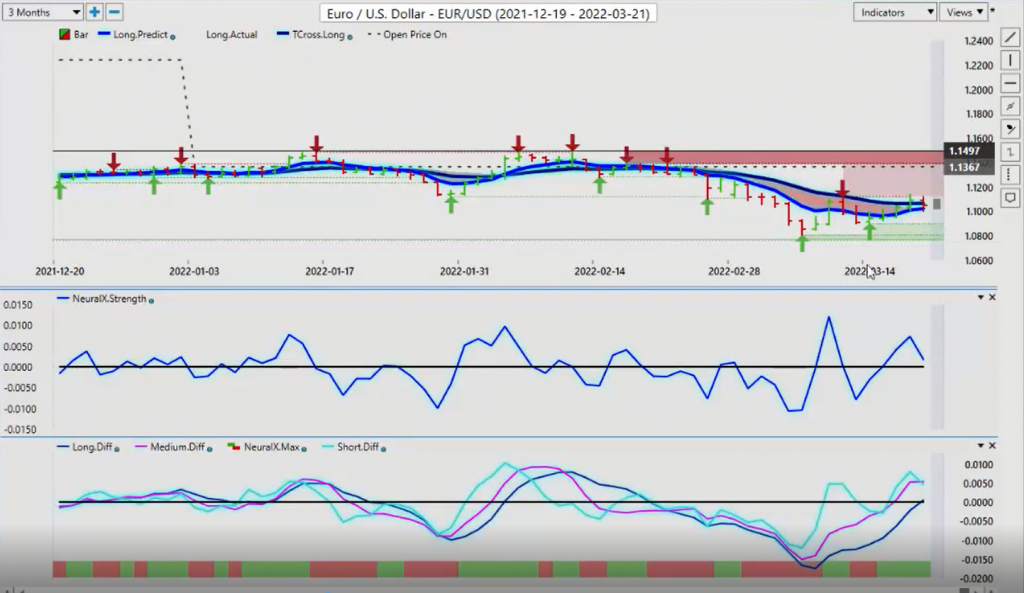
Now, when we look at our main forex pairs for this week, the Euro does have a chance of recovering here. But once again, we must clear the VantagePoint T cross long at 1.1068. Now with broader dollar weakness, which normally occurs after the first week of April anyway, I would expect the Euro to rise this coming week, sink the following week, and then as we move into the end of the month, the dollar to strengthen temporarily again. So the main thing we want to do is watch our indicators. Now, again, our predicted differences are all pointing higher. Neural Index looks good, but you can see the Neural Index Strength. I don’t particularly like that slope of that. That’s warning that we could see an additional failure because we have a verified resistance high coming in at 1.1121.
So between 1.11, for the people that are still looking to sell the Euro down at these maybe overextended levels as a word I would use, then I would be looking at between the T cross long at 1.1070, and that verified resistance high coming in at 1.1121, or for people that are just simply waiting for longs we can actually straddle this thing. And once again, you can put a sell limit order in there and then have a buy stop ready to go at about 1.1150. If we clear that verified zone, then we are likely on our way back to that price on open, the yearly opening price at 1.1367.
British Pound versus U.S. Dollar
Now, with the British pound, we see something very similar, starting to recover a little bit. People are a little disappointed with the bank of England last week. I’m not overly. I think that the pound is from a season standpoint would be down up until about this coming week anyway. But throughout the financial markets from a seasonal standpoint, there’s been a lot of activity around the 20, between the 20th and the 24th of the month across all of these markets. So I would expect that we could still see a fairly decent move on a number of these currencies against the dollar next week. But again, recovering at the end of the month.
So right now the pound is, again, our predicted differences are moving higher, our short-term crossover has taken place. Our medium-term crossover has taken place, but our long-term is still below the zero line. However, once again, this is an alternate strategy that you can use with your VantagePoint software. The long predicted, which represents this dark colored blue line, that’s the one that’s below the zero line, as soon as the market closes above that, you can see what happens here. The market starts accelerating higher, and then in turn it clings to this blue line. So again, zero lag, very effective pivot points, particularly when that you match that with the VantagePoint predicted high and predicted low.
So the predicted low for starting trade on Monday is 1.3117. Longs look pretty good down here. We’ve got a good verified support low. So make sure your stops are below 1.2990. But again, for people that don’t want to get caught up on either side of this, a good straddle point would be above the T cross long at 1.3217, a buy order sitting at about 1.3240. 1.3230. So when we close above the VP T cross long, and we pinpoint that exact level, that gives us, we can sit back and just let the market come to us. And again, that’s just an alternate strategy that you can apply if you want to avoid some of this repeated volatility.
U.S. Dollar versus Swiss Franc
Now, the US Swiss Franc, once again, you can see that this can be a leading indicator for dollar weakness. So that period of weakness on the dollar that I’ve discussed here today, around the 20th… Between the 20th and the 24th of March, the dollar usually doesn’t do that well because we’re, in most cases coming off a significant rally, which of course we have been as I’ve been forecasting this dollar strength for a extended period of time. Basically since about the third week of January because that’s the seasonal pattern. The Ukraine war simply caused an additional strength for the dollar and it may be a bit of a distortion there.
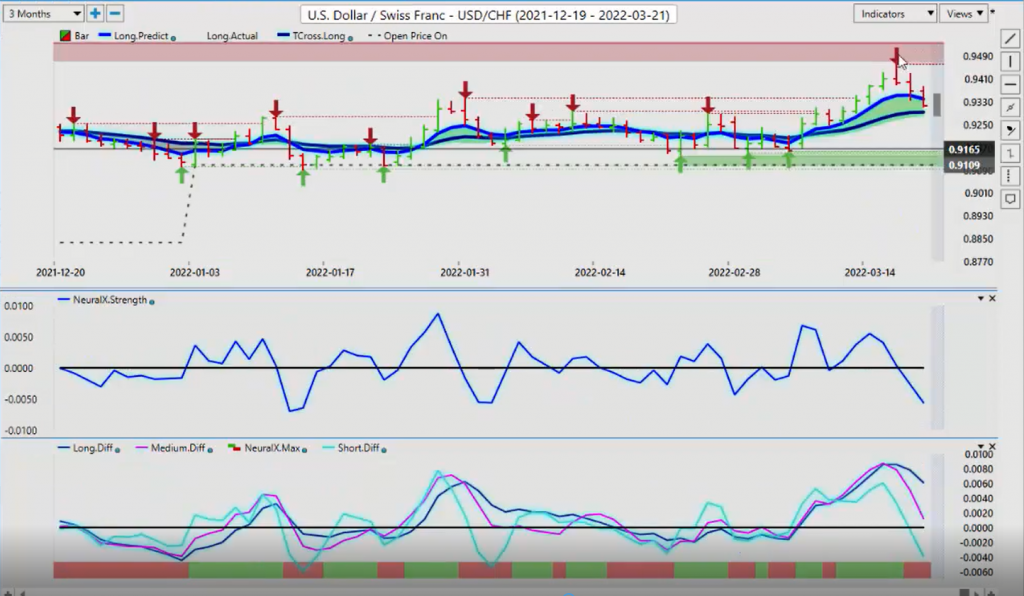
So the Swiss Franc, you can see that money coming out of the dollar here, we’ve hit a high right below the additional verified zone. Our Neural Index Strength has moved lower first. Now our Neural Index is on board. But you can see that our predicted differences, the only crossover in the VantagePoint software that’s taken place is the short-term crossover. The medium-term, which is this pink line and the long-term predicted difference, which represents the long-term crossover. So again, I don’t have to necessarily visually look at the blue line crossing the black line. I can see it in these predicted differences, if and when a crossover takes place when it goes past that zero line. So, our medium and longer term is still holding firm, and our T cross long coming in at .9294. So, as long as we’re above that, the dollar still has some life left in it, which I believe it does until again, probably until after the first week of April.
But we do have the Fed talking again next week. So always be careful of that. But know your levels guys. .9294 is the level you want to see if that can hold. Now the dollar Yen, this pair has made little sense this calendar year.
U.S. Dollar versus Japanese Yen
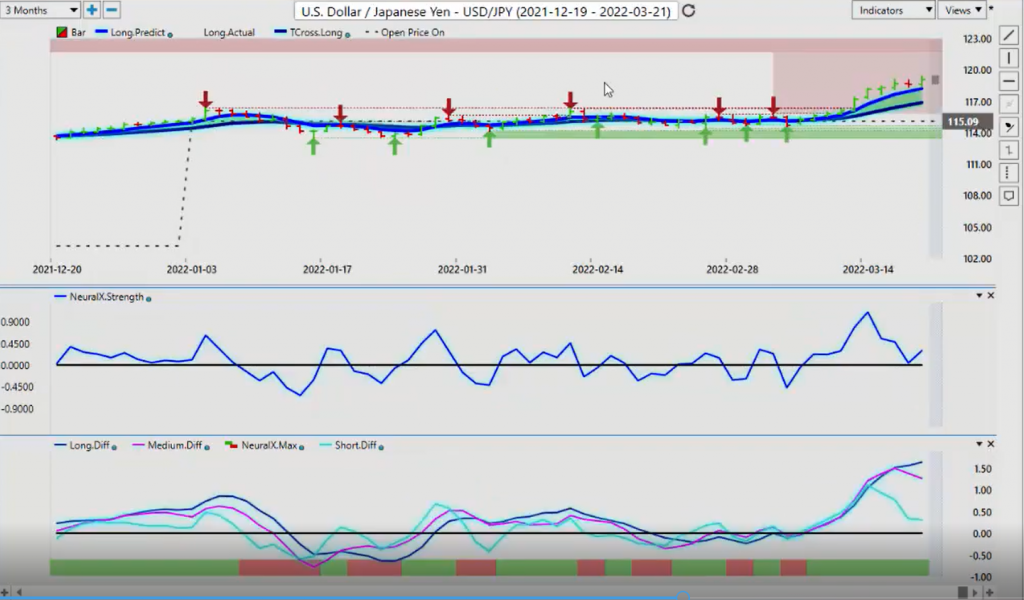
Usually when we have gold prices in the 1900 range, that would put the dollar Yen down around 105, 104. So an abundance of dollar strength in this particular calendar year, pushing the dollar Yen up almost to the 120 level, 119 and change. But as you can see, this is a classic reversal contrarian indicator in VantagePoint. Where this is crossing over here, warning us. The short-term crossover has not crossed over yet. But the short-term we’re losing momentum here. The medium-term crossing the long-term predicted difference, warns us again, we’re losing upward momentum pointing towards potential dollar weakness.
So if we’re looking at places of value to sell US dollars, this could be it. But the carry trade comes into play here because with the Fed hiking interest rates, obviously the interest rate differential between Japan and the US now favors the US. So again, that’s part of what’s pushing this back up. But I think we’re getting close to some relief here where we could see at least a pullback back towards the 116.84, because the… But again, it’s not a blind guess in saying I hope it goes lower. There is a rationale behind that the medium-term trend is weakening against the longer term trend.
U.S. Dollar versus Canadian Dollar
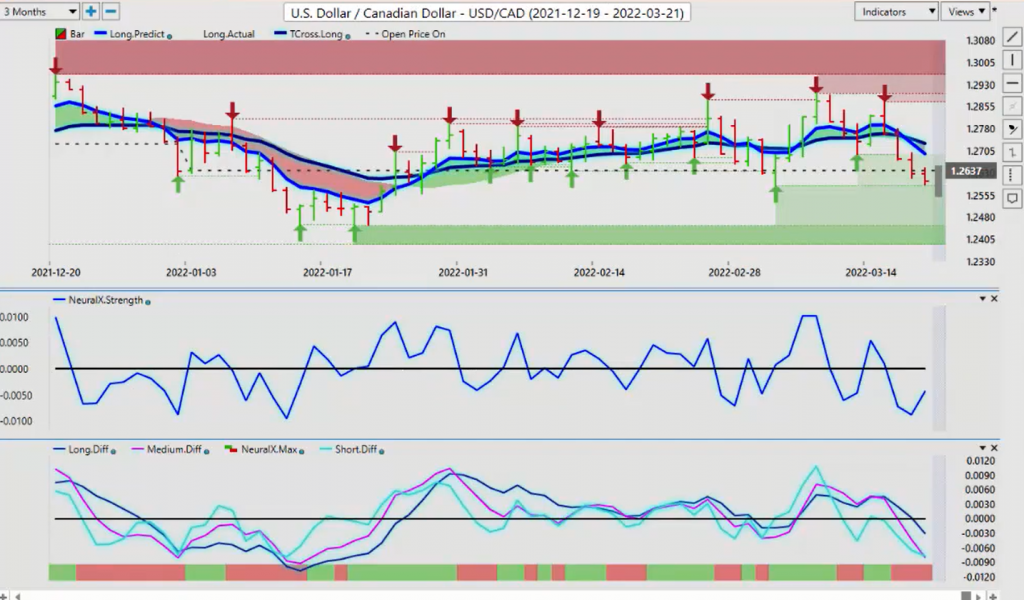
Now, with our three main equity/commodity based currencies, we have actually done this trade multiple, multiple weeks in a row in the VantagePoint live training room where this Monday, Tuesday, Wednesday reversal thing with this pair. So what I would anticipate with what we’ve been doing is US Canada on Monday has been going higher. And when it goes higher over 1.28 or close to 1.29 we put a sell order in late day Monday, and then it reverses Tuesday and Wednesday. So, it’s done that some 300, 400 pips over the last few weeks. So in this particular scenario, this is now a little bit different. We’ve got an actual crossover taking place here. All of our three, our short, medium and long-term crossovers have all completed down. And two days in a row, we are closing below the yearly opening price. Now this will be consistent with Australia US and New Zealand US. They are almost identical trades except Aussie US and New Zealand US up, US Canada down.
So when I’m looking at this right now, what I would anticipate, or what I would hope for is what we’ve been doing for the last several weeks or several months is watching it rally up on Monday and then sell off on Tuesday. So this would be, I suspect it’ll be reverse this week. We’re looking forward to rally up past the VP predicted high or around that area at 1.2651, then we would look at that long predicted as a pivot area. So the short level is between 1.2650 and 1.2695. Then we would look forward to reverse on Tuesday and Wednesday.
Australian Dollar versus U.S. Dollar
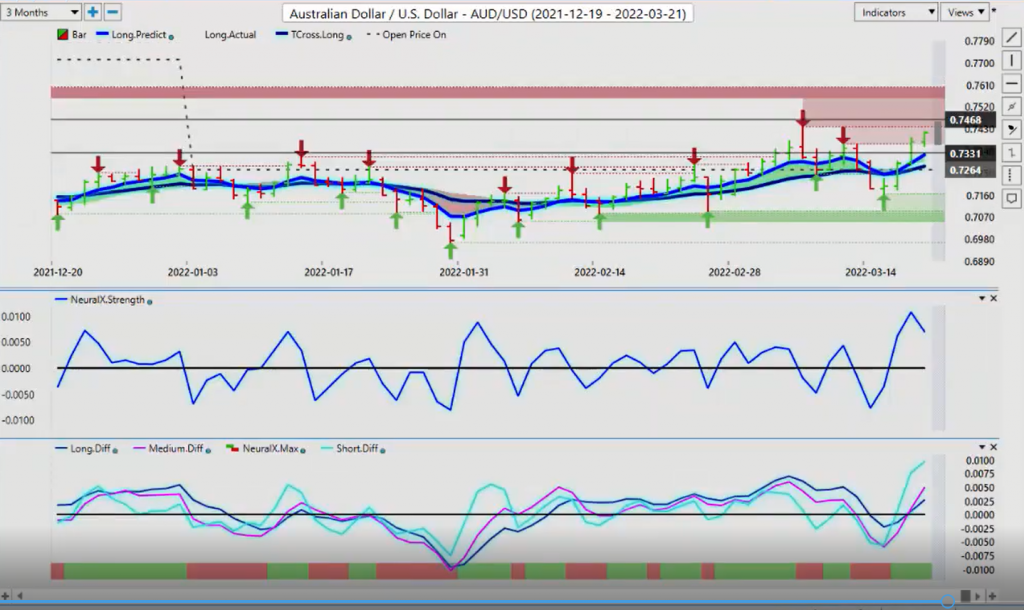
Now what we need with the Aussie, the New Zealand and the CAD, we need global stock markets moving higher. Or at least the US, the S&P 500, the NASDAQ, we need them recovering to support shorts on US Canada, longs on Aussie US, longs on New Zealand US. But these pairs are more specifically Australia US and New Zealand US. They seem to be benefiting if commodities go up and they benefit if stocks go up, it seems to be almost a win-win for those two pairs, which is strange.
And US Canada is in that. So we would look for further shorts this week provided we stay under the VantagePoint T cross long at 1.2729. Now, speaking again of the Aussie US, once again, we have cleared the yearly opening price, that yearly opening price or the price on open as identified in the VP software, .7264. Long while above that area. That’s a very easy way to say it. Now we have our T cross long which is also crossing over the yearly opening price that’s coming in at .7278 and the long predicted at .7324. These are buying opportunities down to this particular level. Now, we still have some very significant resistance up here, but once again, you can see, not only do we have a short, medium and long-term crossover to the upside, but our medium-term trend to the downside is weakening significantly suggesting that a bigger move to the upside may be coming with the Aussie currency.
New Zealand Dollar versus U.S. Dollar
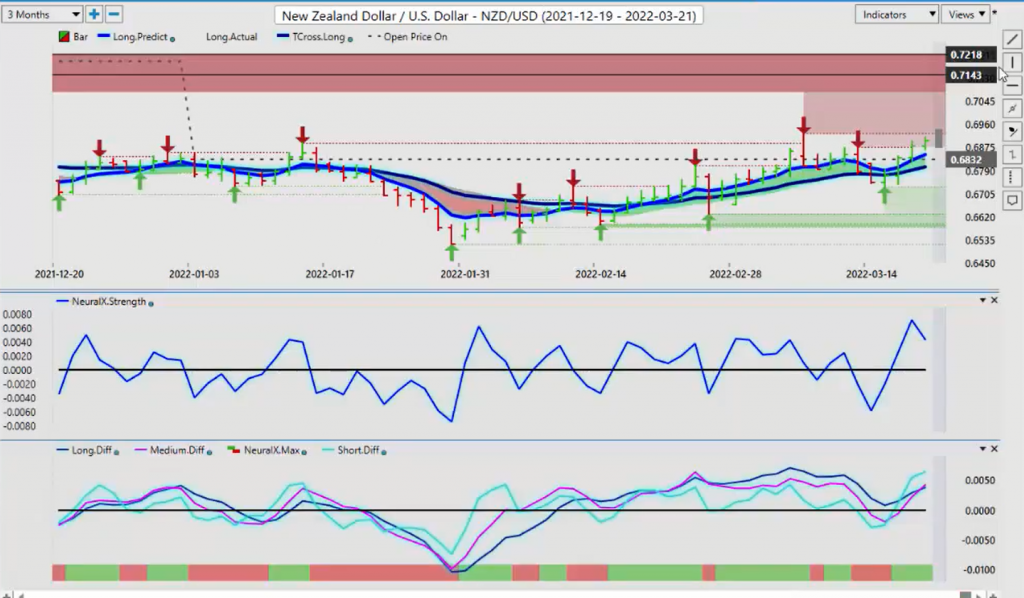
Now, the New Zealand currency will likely follow that, but maybe at a slightly slower pace. But you can see that the same thing is happening, but our T cross long has not penetrated the yearly opening price. But in most cases when it does at this time of the year, this is another signal of US dollar weakness is pending, or it’s coming. Can I put it to the very specific hour and minute? No I cannot. But I can put it to within the day or within a week that we’re at the end of the seasonal pattern in dollar strength. So again, we will again have another volatile week ahead, but with that volatility, certainly we will see opportunity.
So with that said, this is the VantagePoint AI Market Outlook for the week of March the 21st-


