


Welcome to the Artificial Intelligence Outlook for Forex trading.
VIDEO TRANSCRIPT
Hello, everyone, and welcome back. My name is Greg Firman, and this is the VantagePoint AI Market Outlook for the week of March the 20th, 2023. Now, to get started this week, we’ll begin with the SPYs.
SPDR SPY $SPY ETF
We’ll have a quick look at this just so we can have a better understanding of what’s actually happening here. Again, when we’re talking about annual returns, we can look at it from a rolling calculation standpoint or a rolling performance. But we want to be careful how we’re doing that, because as I was talking in last week’s presentation, that that can often be very misleading.
So when we look at this from one year ago, back when conditions were considerably different, the Fed hiking at an unprecedented level throughout 2022. So the relevance of going back to March 16th, 2022 is highly questionable. Because again, if we go back two years and we look at this, we could say, “Well, it was down 20% originally. Now it’s only down less than 10, so we’re moving in a different direction slowly.”
So when we come back and we bring it into current pricing, then we can really see what’s actually going on, as I discussed last week. Once again, when we look at the annual return here, it’s important that we use the proper point in time, the yearly opening price. The yearly opening price on the SPYs or the S&P 500 both remain positive on the year. Very, very good buying opportunities this past week as per last week’s weekly outlook. Because again, this is an outlook, not a recap of something that’s already happened.
So right now, we are failing on the SPYs at the TCross Long, 396.22. We haven’t been able to break through that. So we are going into an extremely volatile week with the Fed, which will probably be a make or break week for the dollar, for the S&P 500, for gold, Bitcoin. From a number of different markets. But again, when we look at this from last week, we were able to assess that first of all, the S&P 500 is not down 10% or 9% on an annual basis. It’s actually positive now by 1.98% when we looked at this last week, using the very, very important year to date to determine the annual price, again, you will get a very, very different number. We’re down 6.77% from the top this year, but we still remain positive on the year. We’re yet to turn negative on the SPYs.
We further last week, identified major support at 348, and what I had suggested at that time is that we can straddle this particular level. We would buy at the yearly opening price or the annual returns, because again, we can’t say something’s bearish when it hasn’t turned negative on the calendar year. If we go back one year and use a rolling performance, so to speak, of this, the picture becomes very muddy. Because again, when we look at this as we did last week, we can see that we haven’t made another low from essentially October, about October the 13th of 2022 when the Fed started to back off these rate hikes.
Since then, we have been making new highs. But again, to keep this momentum going, I think we need the Fed to back off these hikes, but we’ve also got the potential of a recession coming. So the main thing here, guys, once again, very, very important that we’re using the proper levels. We can use the monthly. Here, you can see I’ve got the yearly opening and the monthly opening price. This entire past week, the market has been trapped between the monthly opening and the yearly. There’s enough meat on the bone, guys, here for everybody. If you want to sell, then you sell up near the TCross Long or the monthly opening price if you want to buy. And stick with again, this primary trend that’s pretty clear to see, that basically back here, on October the 17th approximately, we’re yet to get back below that area.
So over the last six-month period, you can see that even to where we’re at on Friday, we are not down anything. We’re actually up 12.56% from the lowest low that we’ve seen, which we have not repeated for almost seven months now. So again, very important that we’re doing accurate analysis on this. If we look at the numbers now from last week, using the heat map, not surprisingly, they turned positive this past week. So you’re up 1% on the five-day period. The one-month is still down. But again, this is a rolling performance calculation. Those dates are rolling forward, which very often can be very misleading in price. And again, the six-month up 1%. And on the year to date, using the same yearly opening price that I do, bar charts using, we’re up 1.98%.
So again, these are the things we want to make sure we’re looking for in our trading, and not confusing it with rolling performance. Because again, it can actually, as you can see, can be a lagging indicator. It can present a false narrative. All these things can actually happen. So when we look at the SPYs or the S&P 500, you’re going to see basically the same thing. So now if we come into our main intermarket correlations, if you remember several months ago, I had actually talked about this in great detail, that my view is that ultimately I would look for Bitcoin to break away from its direct intermarket correlation to the S&P 500 and the global index.
This past week, we have seen exactly that. The S&P 500 has been moving higher, but the dollar basically has been doing the same thing. The SPYs, you can see the SPYs and the S&P 500 are virtually the exact same trade, but they both turned considerably positive based on the analysis in last week’s AI weekly outlook. Because we looked at the proper annual numbers. We looked at, and I explained the rolling performance and where that way of gauging performance needs to be taken with a grain of salt. And you must match it to a current chart, or again, it can be very misleading.
So when we look at the dollar from this past week, we can see the dollar index this coming week will be determined, its fate will be determined ultimately by the Fed. The Fed has clearly pinned himself into a corner this time with, I believe that there will be more, as I said in last week’s weekly outlook also that I believe more banks are going to fail. We’ve got two more now. So we’ve got a total of three, but I believe more will come. And because of this, it’s more likely than not, the best you’re going to get is 25 basis point hike, and you might get none at all. Because again, an interesting point is if a month ago is if SVB, if you applied the same stress test to them, they actually would’ve passed. Isn’t that frightening in itself? So how many other banks are going to come forward now? So this is why I think the Fed will likely back off, but he may not.
The dollar index for next week, 104.40. You can see the dollar was down the entire week because again, the dollar is struggling here. We’re starting to again, slip below that monthly opening price or that yearly, well, the monthly opening price in the dollar. You can see the entire month of March, we have not been positive on this. So again, we have to make sure we’re understanding that in order to buy something, we should have some kind of open interest here, which we don’t. So right now, the yearly opening price is the only thing holding the dollar up, and it’s just barely. We’ve closed out 103.68 right on that. But again, this red line up here at 105.09, we are basically more, we’re 90%, 95% bearish on the month based on that monthly opening price. And again, the VantagePoint indicators, they’ve been syncing for basically the last seven trading sessions.
Our MA diff is week on both, but we are getting a buy signal on the S&P 500.
Bitcoin
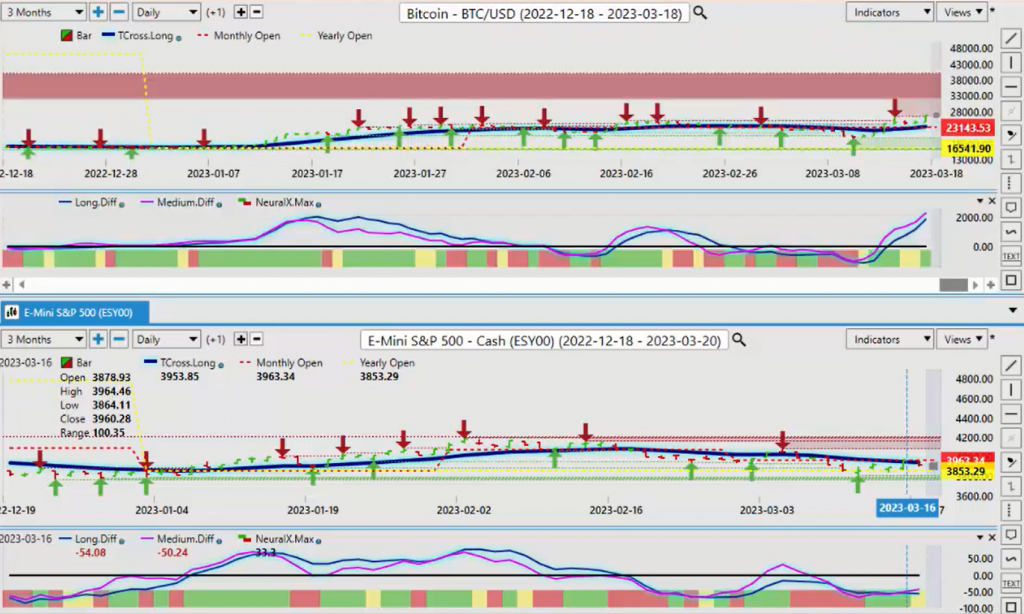
So if we cross-reference this now to Bitcoin, which I’ve been a very, very strong advocate that this is not a scam, that Bitcoin, there is something there. So again, when we look at the stocks basically recovering last week is, and still holding positive on the year, just barely. Bitcoin is grossly profitable on the year. So again, making sure that we’re doing the numbers, gauging the performance properly. And we measure Bitcoin’s performance in this calendar year using the year to date. Because again, all the books are reset on a year-to-year basis from January 1st. January 1st to December 31st is what I will normally use. I will look back at three months and six months, but I will disregard those performance numbers if the charts don’t support that theory, which they don’t in a lot of these cases.
The dollar hasn’t made a new high for seven months. The S&P 500 SPYs haven’t made a new low six, seven months. So when I look at this right now, it’s important that facts matter here, guys. Bitcoin is up 64% on the year as we’ve got 1.98%.
NASDAQ
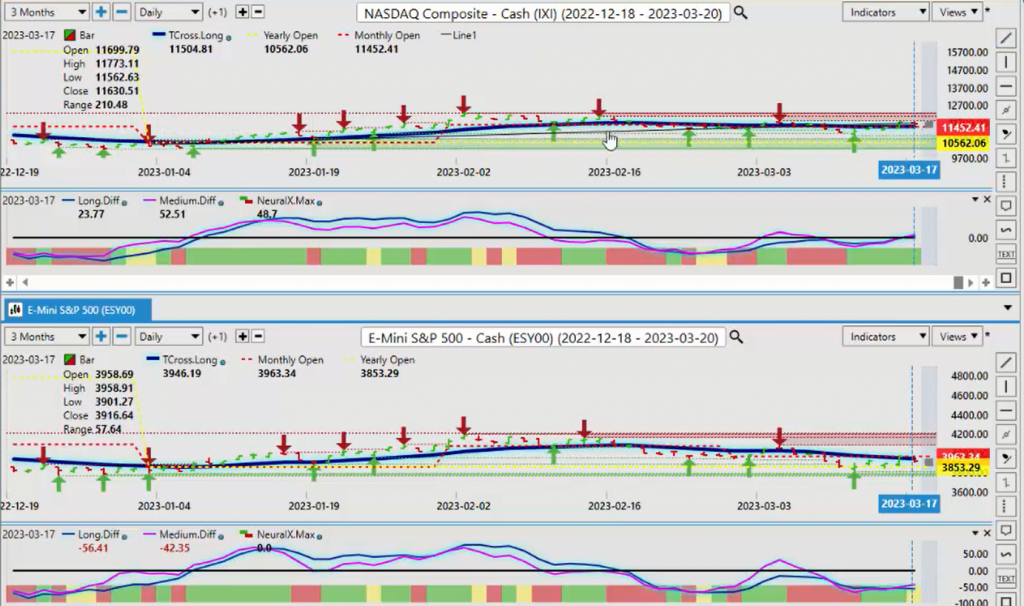
When we look at the NASDAQ, I believe that Bitcoin is the only thing helping the NASDAQ out here, but the NASDAQ is actually slightly more positive than what the S&P 500 is at one positive 1.9% annually. Again, very important that we’re using those proper numbers there. So when we look at this again, when we look at our NASDAQ on the year, the NASDAQ is performing much better up 11.58%. So these are the things we want to make sure that we’re looking at, right?
Volatility Index ($VIX)
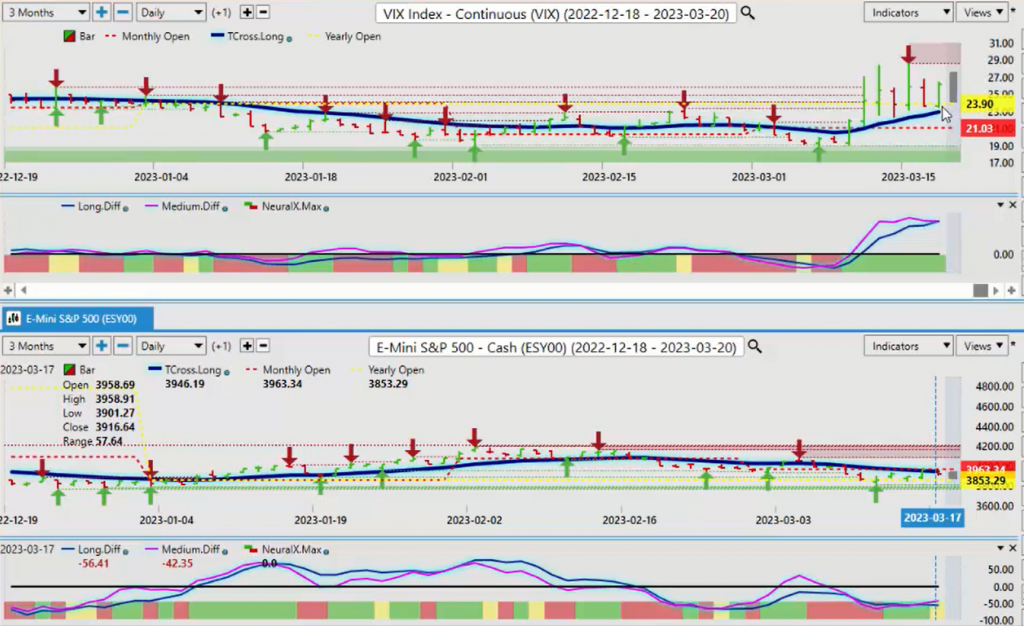
If we look at the VIX, the VIX is where I feel we may have a problem recession-wise, because now, the VIX has come up strong, cleared its yearly opening price above 2390, and if it stays above that, that is going to hurt the SPYs. It’s going to hurt the NASDAQ, it’s going to hurt basically all of them. It’s really going to hurt the DOW. As you can see, it’s taking the brunt of this, but again, it too was starting to recover last week.
Russell 2000
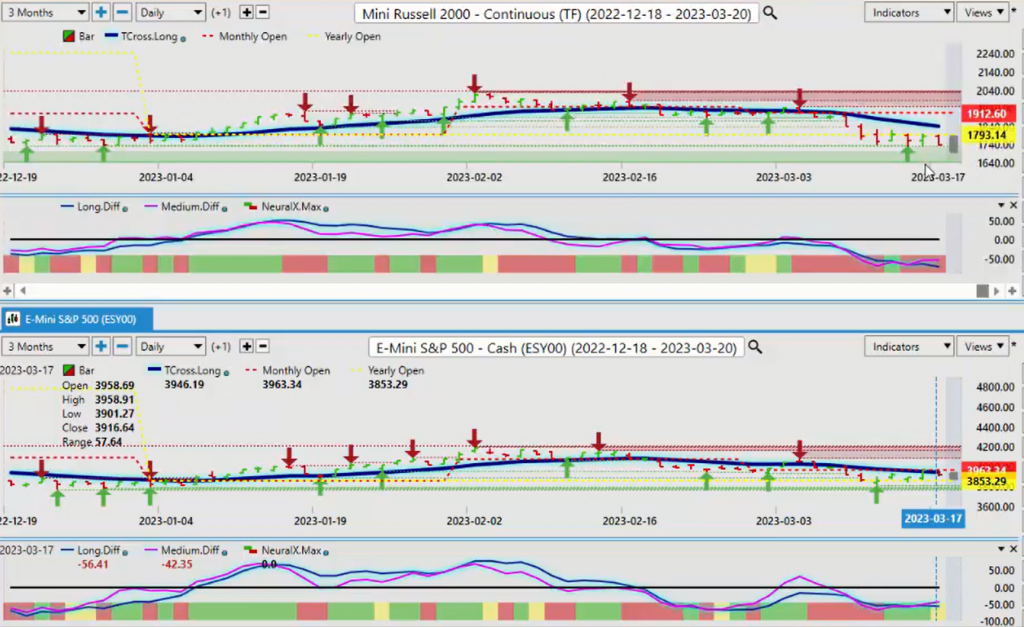
So the Russell 2000, no. Right now, I would argue the Russell 2000 and the Dow Jones is virtually the same trade, and the S&P 500 and the NASDAQ is virtually the same trade. So where does that leave the European equity markets? This is something we want to look at. The European markets are now under heavy selling pressure. So again, if we look at the Nikkei, it too is underselling pressure.
Nikkei 225
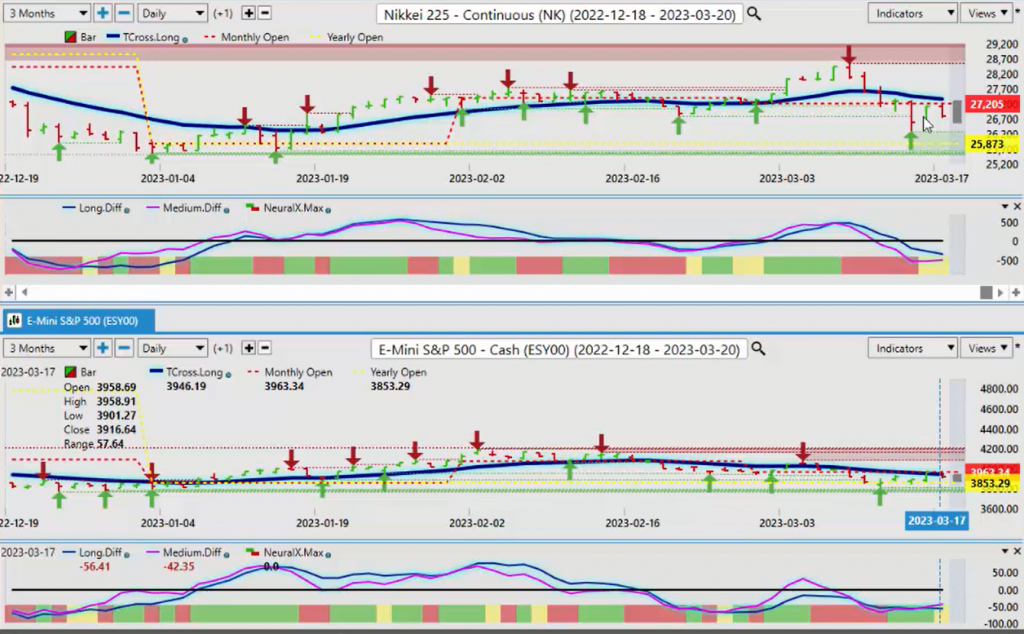
So you can see that money is moving back into the US equity markets. They’re getting nervous. Because you’ve got the ECB, I don’t agree with their hike on Thursday one bit. And the stocks in Europe clearly didn’t like it, right? So again, if you take that same analogy and the Fed backs off on Wednesday, or you get a dovish hike of 25 basis points, and then we’ll see are data-dependent. If we get one of these again, then it’s a dovish hike, then that should boost stocks up. But if it’s 25 basis hike and they suggest that they’re not stopping at that, they’re going to continue with that, then again, that’s very dovish for stock. So this is what we’re dealing with here, right? As long as you understand the fundamentals behind this. But again, right now, the dollar and the S&P are basically just moving a little bit sideways here, both near their respective annual or yearly opening prices.
So a trending move here is close, and again, in most cases moves like this don’t favor the dollar. If we remember last week, I also talked about seasonal patterns, that the dollar is almost always strong in the month of February and part of March, and then it backs off in April as gold starts getting stronger through its seasonal patterns. So again, when we cross-reference this, it’s important that we’re looking at intermarket correlations, seasonal patterns, and the proper annual numbers using the yearly opening price. We can certainly, again, look back and see, but again, you can see the lag in using rolling performance like that with rolling dates. Because again, this was all somewhat negative last week. And now the five-day, the one month, the three months and the six month are catching up to the current price, which is the year-to-date price.
The books are closed on 2022, guys. The Fed, no matter what, is not hiking like what he did in 2023. So a lot of 2022 should be wiped clean from the books. It was an unprecedented event, is what it was. So again, I can cover a broad set, a broad market by splitting the screen and looking at these direct intermarket correlations. So when we open up a different portfolio and we bring in some of the additional markets, then again, we want to make sure we’re looking at everything here, guys. Intermarket correlations, all of these things.
Bitcoin versus U.S. Dollar
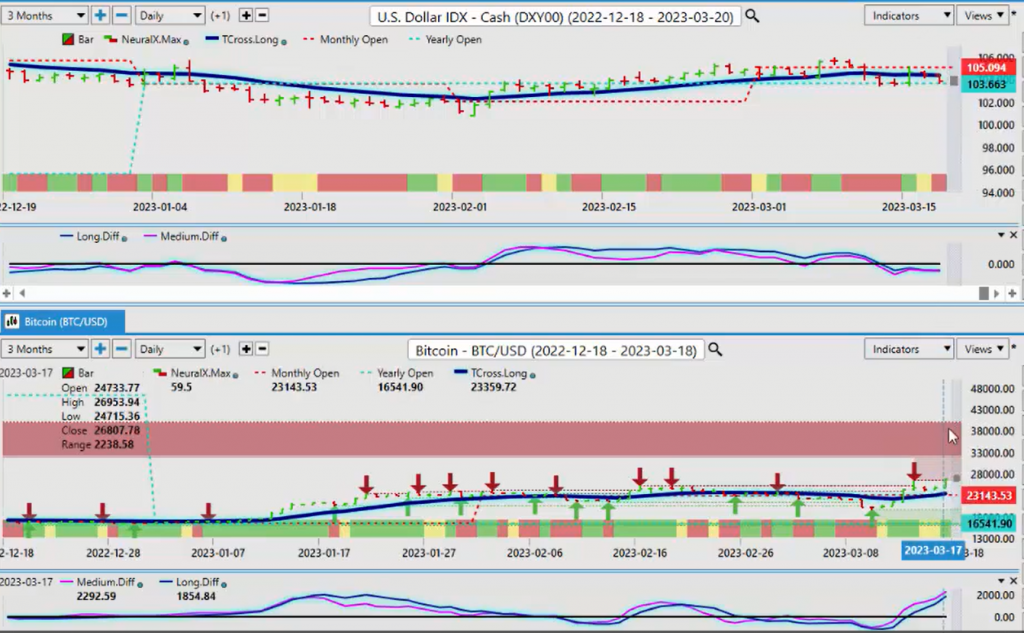
So again, when we look at how Bitcoin is performing right now, particularly against the US dollar, you can see the inverse correlation as the dollar starts to tank. Money has been consistently moving into Bitcoin this entire past week. Bitcoin’s support for next week will be 23,359. Long while above that.
Our yearly opening price, again, we’re up 64%. Look how many pundits told us, “Bitcoin’s a scam. Don’t buy Bitcoin.” There’s very little factual information to support those statements from Warren Buffett, Munger, some of these people, because again, the charts don’t lie. The numbers don’t lie. 10-year annualized returns in Bitcoin, well over 200% annualized returns. But again, when we look at the dollar, the dollar is not down and out by any means yet. We’re holding above the yearly opening price, but it’s trapped, as again, you can see as this chart’s being zoomed in, the dollar is never been bullish in the month of March, to be perfectly blunt. Again, we’ve only closed above its monthly opening price twice, and it couldn’t hold. And then it’s gone down again. But it’s got that support from the yearly opening price coming in at or about the 103.66 area holding it up.
The indicators are moving flat. So when we switch these charts now, I can take the Bitcoin and put it back up here. Then I can go to my dollar index, and we can look at this from a 4X standpoint. So what I’ll do is create a new horizontal tab group so we can see. Now we’ll put Bitcoin against the dollar this way. Same thing, just an inverse correlation.
Australian Dollar versus U.S. Dollar
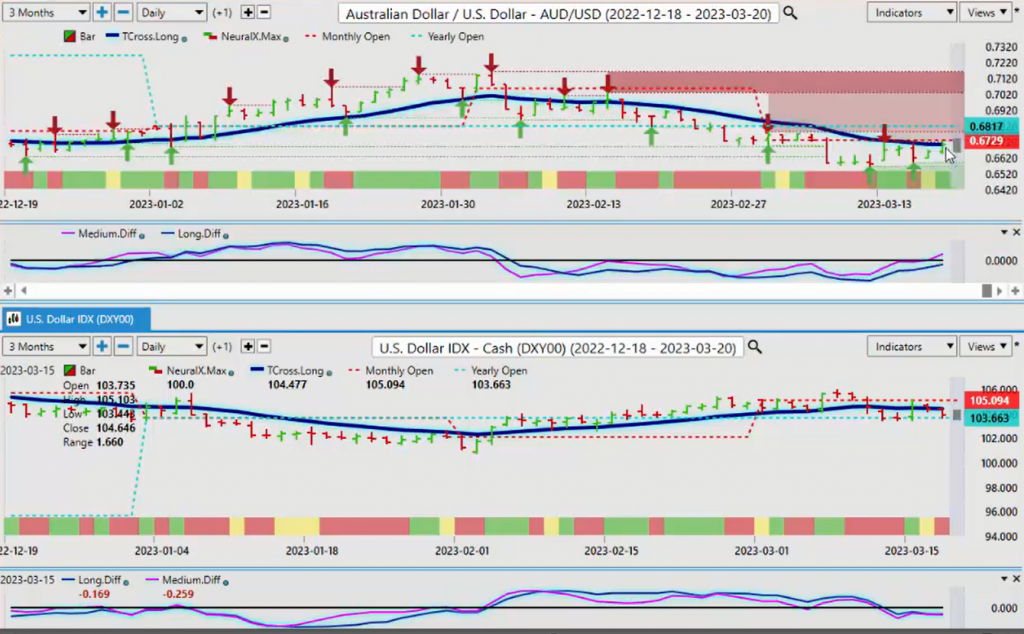
So when we look at the dollar right now against the Aussie, the Aussie currency for next week, we’ve had a recovery here, but the monthly opening price at 68.17, the yearly at 67.29, this is providing very heavy resistance for this particular pair. So for next week’s trading with the Fed and everything that’s going to be going on, always remember your intermarket correlation and your key levels. We need to get positive on the month here, and weren’t not. We really have not been positive on the month in the Aussie, we’ve been below the yearly opening price.
Once again, when we’re using our yearly opening price or we’re looking at annualized pricing, we’re using the current calendar year, is what we’re using starting on January 1st. So right now, the Tcross Long contains the Aussie. But again, for us to get any kind of real momentum, we’ve got to get these predicted differences above that particular zero line.
Gold
When we look at gold against the dollar, you can see that this is an basically what I would argue is a pretty much a known seasonality. Like last year, even with the Fed rate hikes, we still had a good gold rally, that seasonal pattern, into the middle of April. So the similarities between this last year’s chart and this year’s chart is really quite something, to be perfectly honest. If we go back two years, we see that same seasonal pattern that went into, I would argue, the end of May.
That’s normal for gold also. If I look at a three-year period, gold didn’t back off at all. It flattened out right here, but then it started on a tear again. So we’re four for four here, guys. Does it now seem like a big surprise? So imagine somebody telling you, “Don’t buy commodities, don’t buy gold.” Or “Don’t sell dollars.” It doesn’t really make a lot of sense, does it? When the charts are not supporting that. So once again, when we break above the VantagePoint TCross Long on March the 10th, that’s a trigger point. But we looked at gold, guys, last week. In using our heat map, I can bring it up again if you’d like, just as a quick recap. But once again, gold made its move, was already bullish to going into this. So if we look at this over, once again, price performance, we can see exactly what’s actually going on here.
The three-month, the five days up 6%, the one month is up 7.84%. The three-month is up 10%, the six month 18%. And the all-important, the most important one you should be looking at the annual, but the proper annual starting from January 1st, we’re up basically a crazy amount here, almost 9%. It’s no Bitcoin, but it’s pretty good. So again, when you’re looking at the proper numbers, things are much easier. We don’t want to be using lagging tools to manipulate price. That’s never a good idea. So gold right now, in my view, is overextended, because we’ve moved a considerable distance off the TCross Long. The TCross Long area 1878. I would think we would start to move back towards that pre-vetted on Wednesday or Thursday this week. I forget which day he’s on. But the further we move from the VantagePoint predicted moving average, the more likely we’re coming back to it.
U.S. Dollar versus Swiss Franc
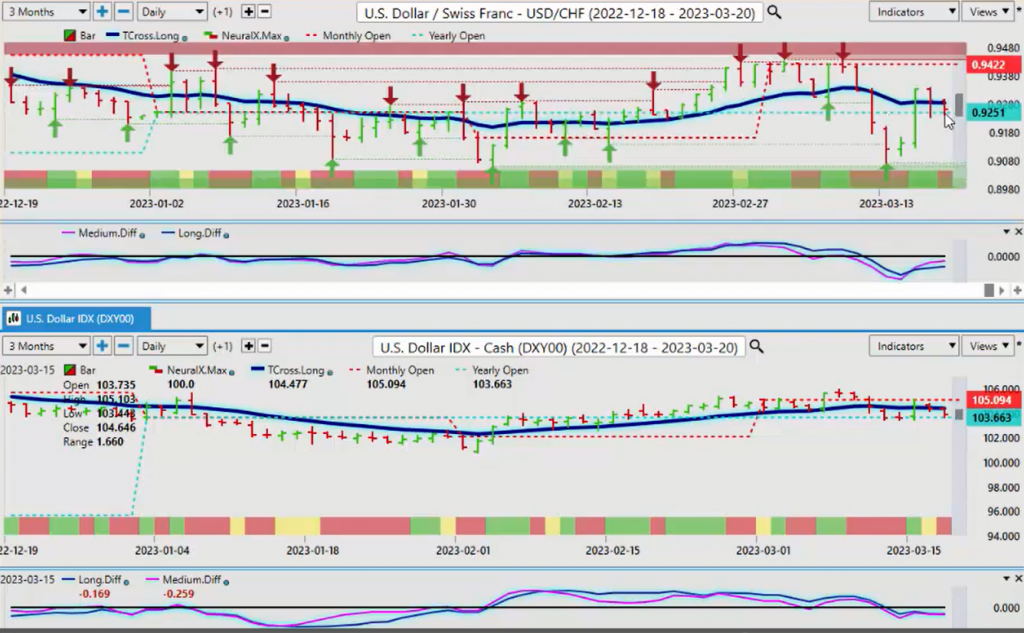
So again, keep a close eye on that. But once again, last week when I talked about the dollar, with the US Swiss Franc, the chart, US Swiss Franc has recovered when the US dollar index recovered to some degree, but they’re both basically failing at the same point. The VantagePoint TCross Long, this one is at 9284. But all of these trades are based around what’s happening with the Fed, the dollar index.
So when we look at the Mexican peso, we haven’t looked at that one closely. Is this possibly a leading indicator that’s telling us that the dollar’s got one more bout of strength? Well, I would argue the dollar always strengthens in the first week of the new month. You remember last week, when I had stated that the probability that the dollar is soft this past week is about 90%, because the pattern is almost every month, the week after the non-farm payroll number, regardless of the payroll number, the dollar weakens. Dollar demand dries up and it dissipates, and then it starts to recover towards the end of the month into the first week of the new month, which would be April.
So it’s perfectly normal for the dollar to be down for a few weeks here, and it could be the Fed may put a nail in the dollar’s coffin. But again, we haven’t made any new highs on the dollar anyway for months now, months and months and months.
U.S. Dollar versus Japanese Yen
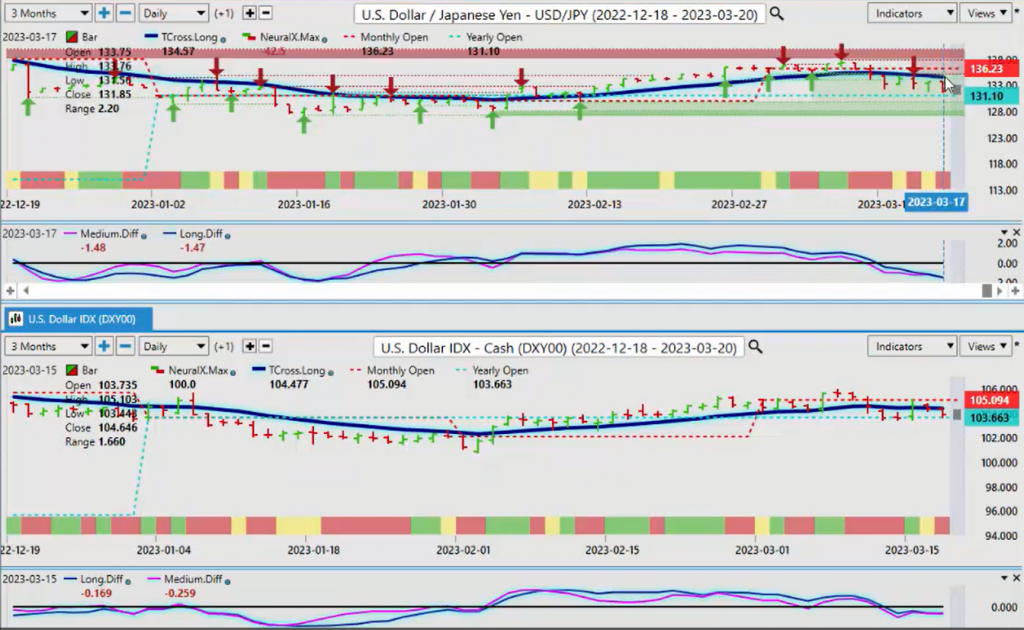
So the dollar yen, when we talk about flight to safety, we’ve got a flight to safety here happening now. The dollar losing ground against the lowest yielding interest rate currency out there, guys. Bank of Japan is still negative rates. This by definition is the carry trade. Buy this dollar and sell the Japanese yen. The interest rate differential between the two countries. So right now for the yen, the TCross Long that’s coming in at 134.57. The VantagePoint indicators remain negative on this particular pair, but some strength can’t be ruled out going into the Fed announcement.
But for now, again, we’re watching that yearly opening price very, very closely. 131.10. But much like the SPYs and the dollar index and all these things, to dispel some of these rumors and myths, the dollar yen has struggled to stay positive on the month. It’s been negative 80% of the month below that monthly opening price as the dollar index has been below its monthly. So again, using a tool like the point in time from VantagePoint, the monthly, the weekly, the quarterly opening, then it gives you some idea what the buyers and sellers and who’s really in control of this. So as you can see in the month of March, the sellers are in control of one of the weakest currencies. They’re buying one of the weakest currencies out there, the yen, and this is again, a flight to safety.
This is what they’ll do. They’re moving into Bitcoin the same way. But right across the board, we can see dollar weakness here. Right across the board is suggested in last week’s weekly outlook. But that pattern is very repetitive every month. And I first noticed it using the VantagePoint software in the Long predicted in the TCross Long. Now I play it every single month, other than months, like August and December, periods of known dollar weakness, particularly December.
British Pound versus U.S. Dollar
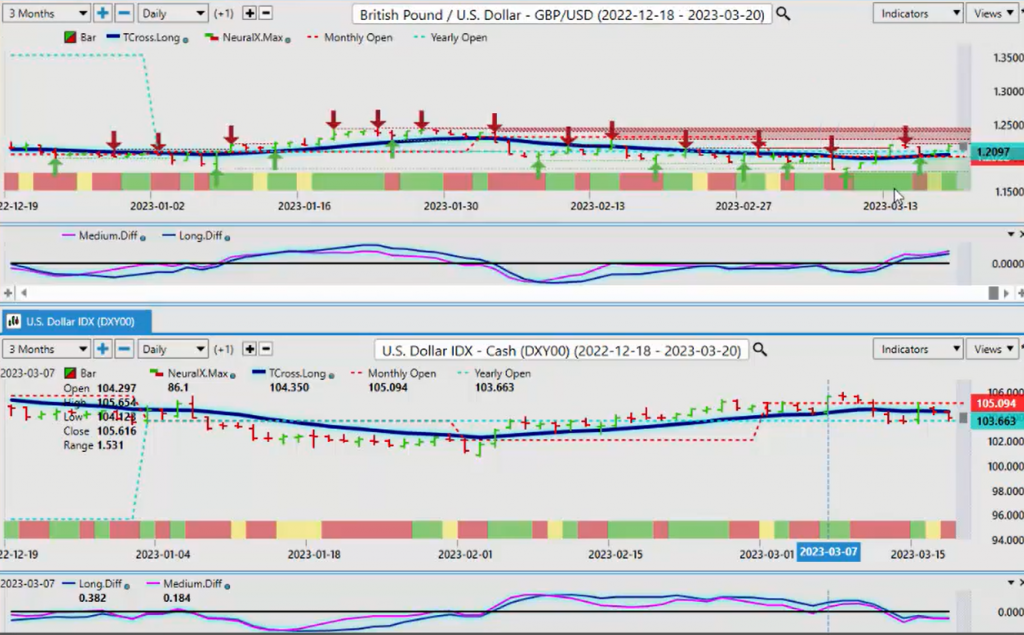
So the British pound US dollar for next week are TCross Long 120.54. We need to hold above this level in order for this to extend. I believe that the Fed could kill the dollar on Wednesday. It’s very possible. It’s going to be an interesting balancing act. But the main thing is, once again, the pound is positive on the month. We just need, and it’s positive now on the year too.
So again, the yearly opening price coming in at 120.97. Indicators in VantagePoint, the Neural Index is positive, the predicted difference is positive. So it looks like we can extend here.
U.S. Dollar versus Canadian Dollar
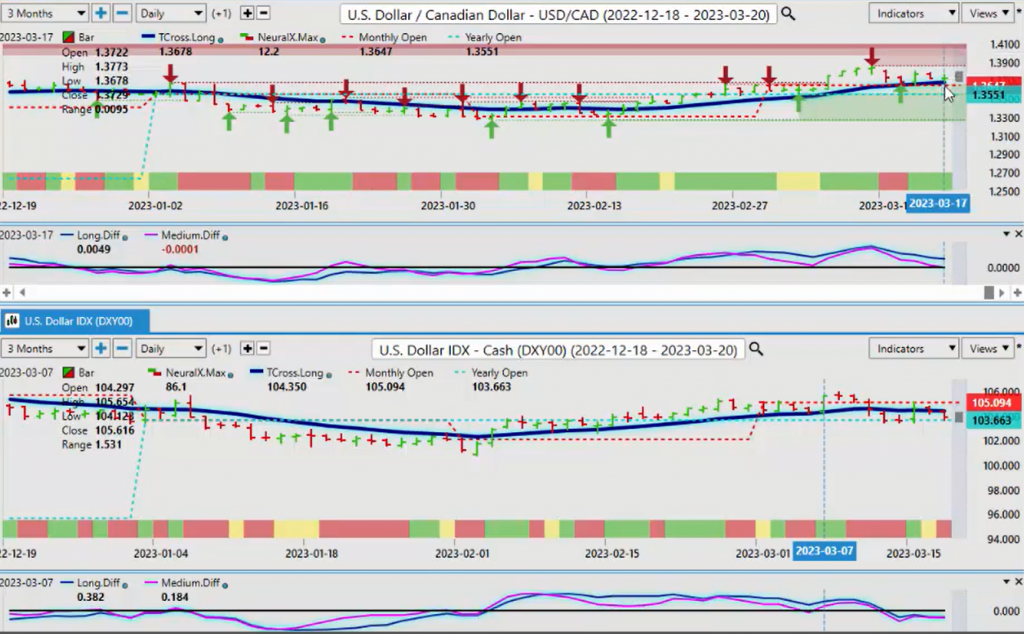
Now the US Canadian. If oil prices, Canada, this particular pair are yearly opening 135.51. The problem we’ve got here is this, plummeting oil prices. So the oil prices, first of all, again, never really positive on the year here, guys. You can see that that yearly opening price at 80.73 has repeatedly contained price action. The retracement points have been the same back to the yearly opening price, and down we go. Now we’ve come back up to it on March the seventh and March the sixth, and we’ve come down even harder. On top of that, we’ve broken out of this channel, low coming in at 72.64. So this points to a recession here, guys. And last time I checked, you don’t hike rates in a recession.
So the Fed really is going to have some problems. But if oil keeps plummeting, then the Canadian dollar could still lose ground against the dollar. The Canadian dollar could lose the ground against the US dollar, excuse me, regardless if those types of commodities like oil continue to drop. But again, the Canadian dollar will follow the equity markets. The Aussie will follow the equity markets. The Kiwi also will follow the equity markets. Now the Kiwi is holding its ground somewhere above the TCross Long, but still below the yearly opening price. So we are going to have a very, very volatile week next week as everybody tries to predict what this Fed is going to do, and how he’s going to get out of a mess that he has created. So with that said, this is the VantagePoint AI Market Outlook for the week of March the 20th, 2023.