


Welcome to the Artificial Intelligence Outlook for Forex trading.
VIDEO TRANSCRIPT
Hello everyone and welcome back. My name is Greg Firman, and this is the VantagePoint AI Market Outlook for the week of June, the 27th, 2022.
U.S. Dollar Index

Now to get started this week, we’re going to begin where we always do with that very important U.S. dollar index. Just a quick reminder that no recommendation is being made to buy and sell currencies or futures contracts. These videos are for educational purposes only, as outlined in the disclosure document that I would remind everybody to review. Now, again, looking at the dollar index going into next week, this is pretty straightforward. Either the dollar is going to sink or the dollar is going to swim. We have a major support level here that I’m identifying, the T-cross long. We have been repeatedly hitting this level all week and we are not making any new highs.
Now, when we first look at this, we can see that that VantagePoint T-cross long 103.89, we’re having another week close in the dollar. So when we break this down and we look at it on the monthly, once again, this 105 level is extremely important. The dollar must break through here but as I’ve stated, my view is that the fed has got this wrong. Hiking, excessive rate hikes is not the answer to curb inflation. This is not at all the way to do this. Again, when we look at this right now, the dollar index, really struggling at 105. We’ve repeatedly failed on there at, more or less, the exact same time we failed last month. So we’ve got our 75 basis hike, the dollar spiked higher, and then down it goes again. But once again, in order for the dollar really to confirm that it has any long term gains here, we have to break through that.
So when we look at the previous week, we’ve held below the weekly opening price. We’ve repeatedly testing the VantagePoint T-cross long. It’s just a matter of time now before either it breaks down below here or that support level holds and we go higher. The main thing is that we identify that level and we know how to trade it. So the primary indicators from VantagePoint are neural index and our neural index strength are both pointing lower. We have a medium term crossover. You can see that the medium term, this pink line, is the medium term predicted difference has crossed the zero line guys. So is the short term. They have both crossed lower. The long term crossover has not crossed over yet, but it’s still pointing down. And again, the MA Diff cross warned us that this move on the dollar is not what it appears to be. And this came at almost the exact same date as last month.
So once again, the retail traders pouring into U.S. dollar longs. That is historically proven not to be a great trade here guys. Now, again, that doesn’t mean that the dollar can’t go higher but in order for it to go higher, these indicators have to turn around. But the very first thing we need to look at is if we can continue to hold next week above 103.89. If we can’t, then the pound dollar will continue to extend higher, Euro U.S. will move higher. U.S. Swiss Franc lower, Aussie U.S., New Zealand U.S. Because you have to understand one thing here, guys. The primary basis of the Forex market is we’re either buying or selling U.S. dollars. VantagePoint has been clear that buying U.S. dollars is not been the best play over the last week or two. So again, we will continue to monitor this level.
Gold
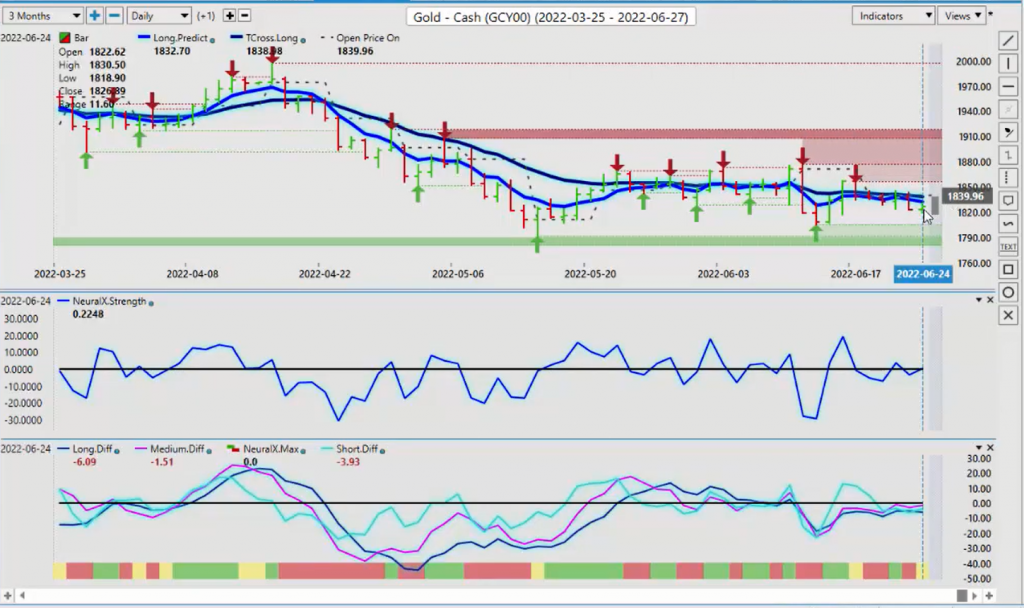
Now with this dollar weakness, gold’s still unable to make a move higher. Now, once again, there’s a known seasonality here, guys. In usually around the end of June, beginning of July, that goes right through until about September, October in gold prices. Now our neural index strength is pointing higher, but our neural index is yellow. We’ve got a caution. So our predicted differences are below the zero line, but they’re running flat. So once again, our T-cross long, 1838, this is the level we need to overtake. That is the primary move.
So for Monday’s trading, the way I would look at this, the predicted low is that at the 1818 mark, I would still be a buyer there as long as these two support levels are holding. We’ve got a low of 1805, and this is the one we really want to keep our eye on, which is 1791. If these two levels continue to hold, then longs are still viable, pending dollar weakness. So again, the stocks are recovering a little bit. I’ll talk about that more in a second here. But for now again, there still is that strong seasonality with gold that I would not disregard.
Now, when we look at going into Bitcoin here, once again with Bitcoin, I’ll gently remind everyone that it was one year ago that these powers that be that have told us that Bitcoin is a scam. Bitcoin is weak. Bitcoin is all these different things. And I’ve heard this almost every year at this time. And predominantly we go into a fairly substantial rally that starts around mid-July, and that runs through here until you can see until about September. Then we have one of the stronger rallies of the year, which is middle to end of September running through into November. So again, I would be cautiously optimistic that Bitcoin is about to recover. But these same pundits that tell us what a scam Bitcoin is and all these things, I’ve heard it all before guys. So I’ve heard it for the last 10 years.
Bitcoin
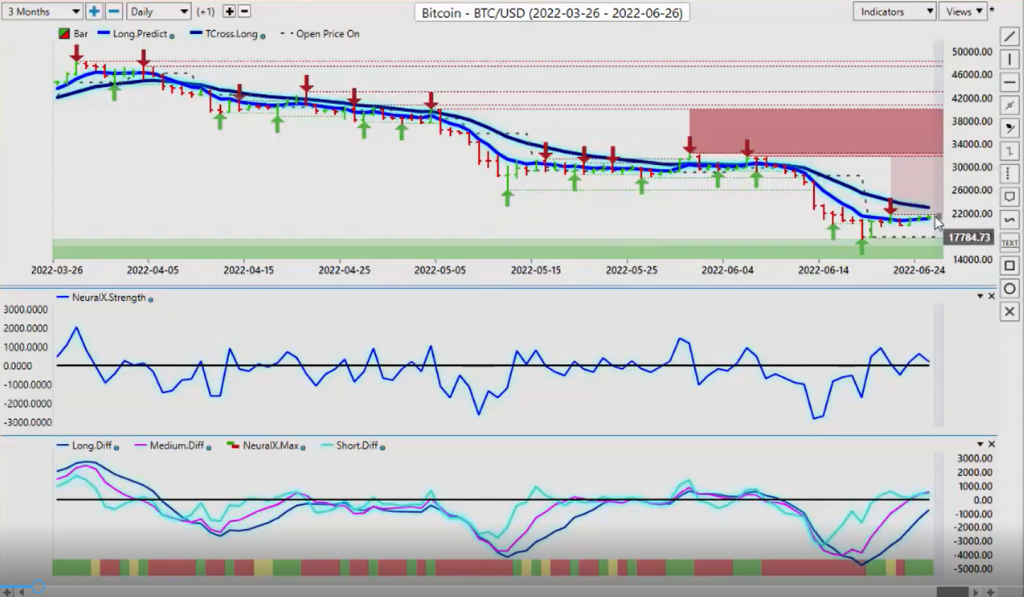
Meanwhile, Bitcoin annualized returns are 240% per year, a better investment than the stock market, than the commodity market, than a lot of markets. But again, I find it interesting that the same people that are telling us that we should be long the U.S. dollar under no circumstances should we be short the U.S. dollar. These are the same people that were telling us not to buy Bitcoin at 1,000, at 5,000, at 20,000, at 40,000. All the while, Bitcoin doubling in price while they’re telling us that this doesn’t work. So right now, I would be watching Bitcoin very, very closely here guys, because we’re just not… I would argue that we have a potential bottom forming here. That would be around the 28,000 mark, but we still need to get above the VantagePoint T-cross long at 22,901 in order for longs to continue to be viable here or if that seasonality is going to kick in.
But I would in turn strongly argue here, guys, that, and again, these pundits that are telling you Bitcoin was a scam. See? We told you. So that’s just false. That’s about as the strongest fake news you’ll ever hear. Because the same people as the stock market has crashed similar amounts over the years, 60%, 50%, 60%, 70%, they’re telling us we should buy on a dip. So my point being here that if the Bitcoin or the S&P 500, excuse me, moves higher, that will fuel a Bitcoin rally. If the NASDAQ moves higher, that too will fuel a Bitcoin rally. So there’s multiple trades attached to this. But for now, we have closed above the T-cross long to finish the week, but maybe even to finish the month. But I will remind everybody that last month, the exact same time we saw the same thing.
S&P 500 Index
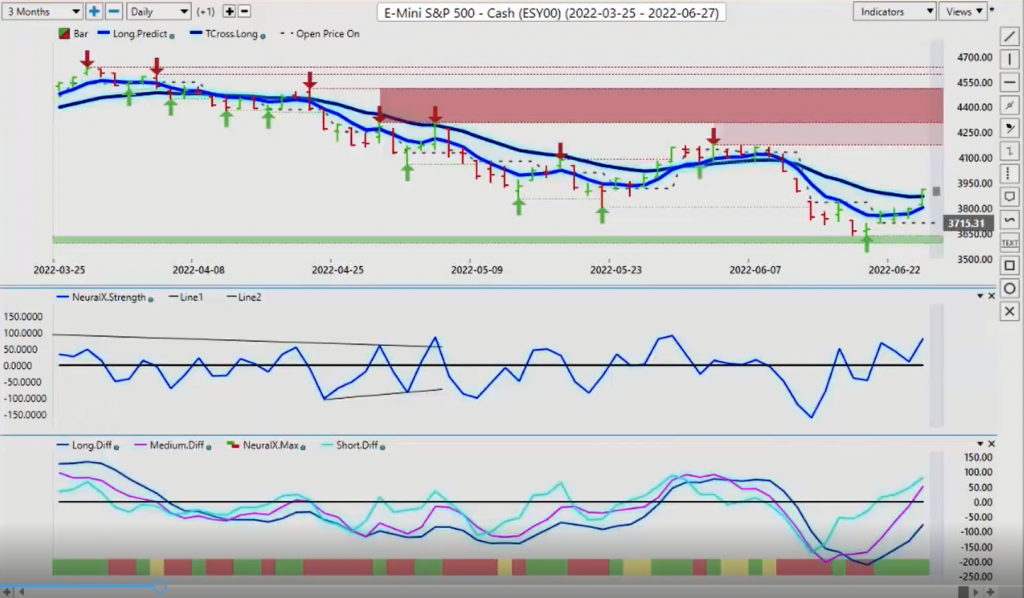
Now, I think the fed is in a bit of a different position here now, potentially a very different position. So again, I think they’re starting to backtrack a little bit, the same pundits that are saying the fed should be hiking 1% or 2%, all these things. Now they’re saying, “Oh, well, maybe that’s not such a great idea.” Maybe the feds got it wrong after they basically bullied them into hiking based on that CPI number. So once again, when we look at this, we could have a short term bottom on the index, the S&P, which is around the 3686 mark. But the question is, again, can the stocks hold these gains? Stocks are indisputably bearish, no question about it.
But I will again bring it to everyone’s attention that the true internal indicators, the core indicators, in VantagePoint, the neural index, the crossovers, they were warning that the index was going to go higher right from the start of the week from Tuesday. And remember, Monday was a holiday in the U.S. On Tuesday, we already had an MA Diff cross. That’s the medium term trend to the downside, weakening against the longer term trend. And we can see that reversal is, and it’s gaining some momentum here, guys. Now, the only thing is last month, we can see that basically we went sideways. We rallied up until about June the 2nd, and then we went flat. And then after the fed, down we go again, or before the fed, I should say. Then after the fed, everything reverses again, just like it did last month.
So again, I believe we could see some legs in here on equities, but we need to hold above 3873, excuse me. But the long predicted now is at 3806. That’s the level you want to keep your eye on to begin the week. If we’re holding above that, longs are clearly still in play here, even though it is to some degree a bear market bounce. Now, light sweet crude oil, once again, it’s getting a bit of a reprieve here as stocks rallied on Thursday and Friday.
Crude Oil
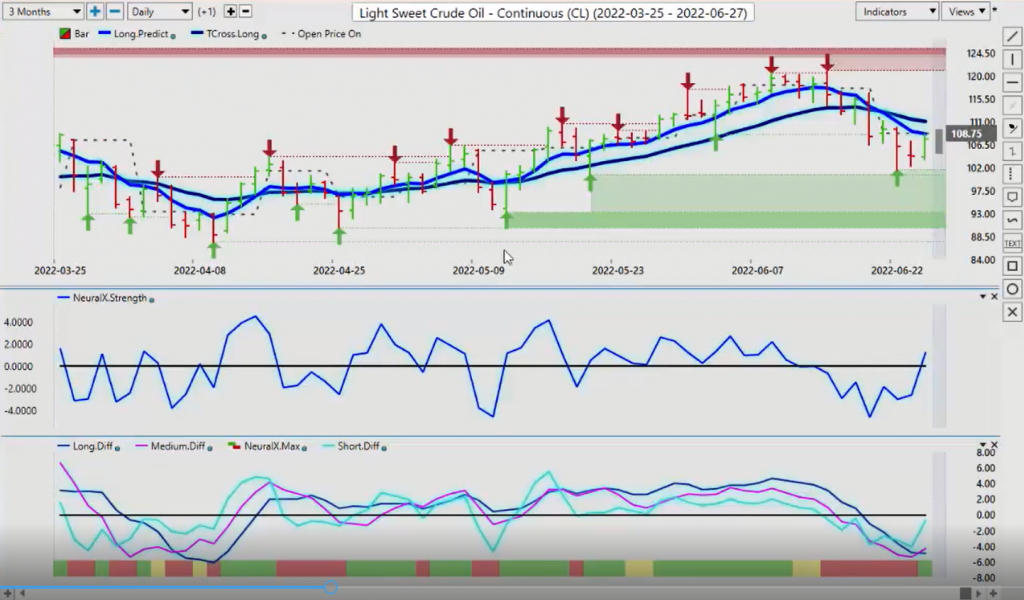
You can see oil started to recover. Still bearish, but this is what a buy signal looks like, guys. Okay? When we look at this right now, we’ve got our predicted low at 104.80. Our neural index strength is pointing higher. Our MA Diff cross has crossed to the upside with the neural index. This is pointing towards gains in oil next week.
And now those gains may not occur on Monday, but I’d watch for it on Tuesday, Wednesday, Thursday, and Friday of next week, because in my view, very often Monday is a fake trading day. So in actual fact, we would look for oil to sell off on Monday only to dramatically reverse on Tuesday or Wednesday. So keep an eye on that, but we do need to clear these two big levels up here, 108.62 and 111.04. Now Biden is finally starting to jawbone the oil contracts and the oil prices. And that already set a little bit of a shock wave off and some of your longs started jumping ship here. But we’ll see if he continues to do that. But right now the indicators in VantagePoint are warning this coming week because again, this is a weekly outlook guys. Not an hourly outlook or even a daily outlook. It’s a weekly outlook. So we look at the bigger, broader picture and apply it to a week’s trading before these moves, not after. Because again, this is an outlook. It’s not a recap of something that already happened.
Euro versus U.S. Dollar
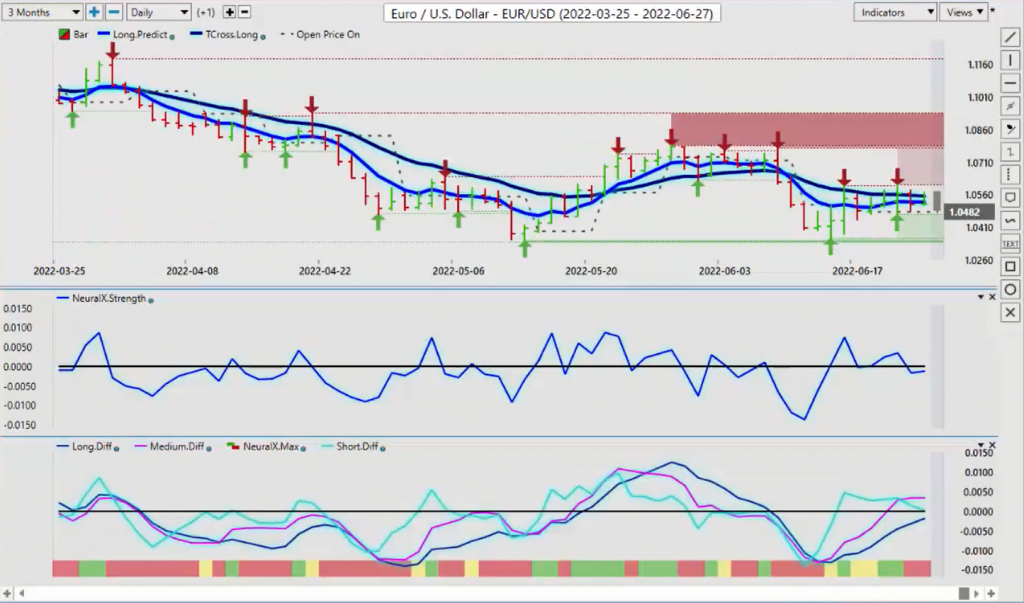
Now, as we move into our main Forex pairs for next week, all eyes are going to be on Euro U.S. With my own direct trading group, of course we’ve been buying Euro U.S. because we had that same signal we had on the S&P 500. We have it on Euro U.S., the MA Diff cross. Now the medium term crossover is crossed to the upside, but the problem again here, guys, and I’m going to highlight this level. Right? So when I look at this right now, you can see this blue line. That’s what this is, the T-cross long. Okay? So looking at that T-cross long to begin the week, all eyes are on, or at least on this side, are on 105.53. If we can get above this thing and close above it, then the Euro has a chance of breaking higher. But that will be determined by the U.S. dollar index. These two are 100% inversely correlated. Doesn’t matter what’s going on with Russia, with Europe. It doesn’t matter what’s going on with the fed. It’s irrelevant, guys.
If the dollar index breaks down and goes lower below the levels that I discussed, then the Euro will go higher. If the dollar index does not break down below those levels, then the Euro’s on its way back down again shortly. So again, we draw that line in the sand, right on that T-cross long. And you can see in this particular case, the predicted low for Monday is what we would target. That predicted low would be down at 104.91. We would look for potential longs at that particular level in anticip-. Because the additional indicators, mainly the predicted differences, are pointing higher. So again, these types of strategies, at least the one thing we can say is we know the exact level to watch out for, which is 105.53. But the long predicted now is at 105.25. So I believe we could see some buyers stepping in around that level also.
U.S. Dollar versus Swiss Franc
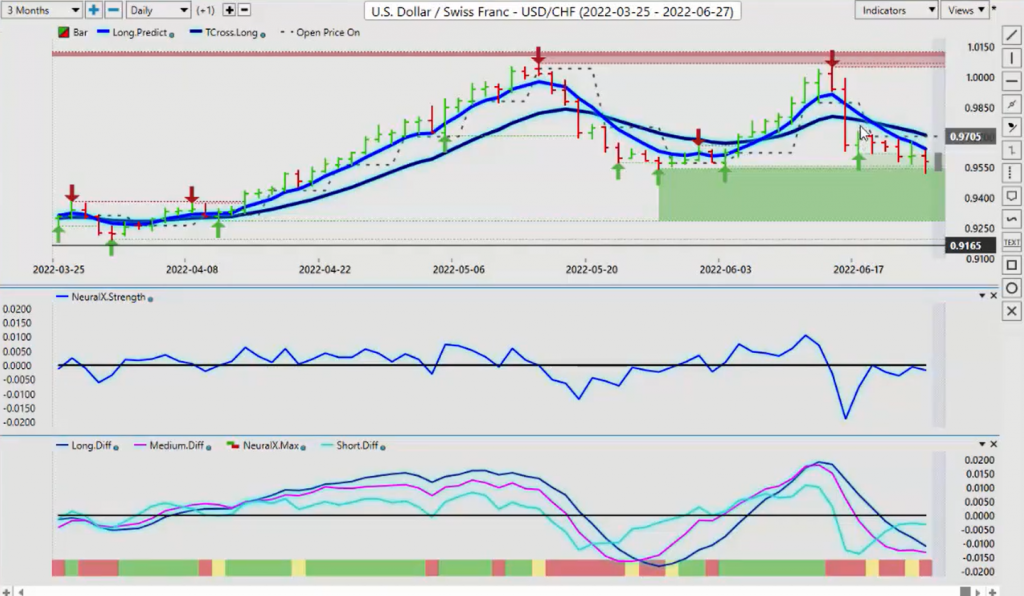
Now the U.S. Swiss Franc, once again, as that dollar index plummets, you can see, as I discussed in last week’s weekly outlook, it doesn’t matter about the carry trade, about interest rates, CPI, PPIs, labor reports. I can play this game all day, guys. The fact of the matter is the dollar index goes down, it pulls this pair down with it. That’s that’s the long and short of it. The inner market correlation, they’re 90% positively correlated. That 10% is hit and miss, but it’s still there. It’s not 100%. So right now we do have some very strong verified support down at the low 0.9545. We’ll be watching that level very closely, but a breakdown on that would have us targeting even lower on this pair, potentially down at the 0.9286 and as you can see, most of these indicators are saying that we still have some downside ahead of us.
British Pound versus U.S. Dollar
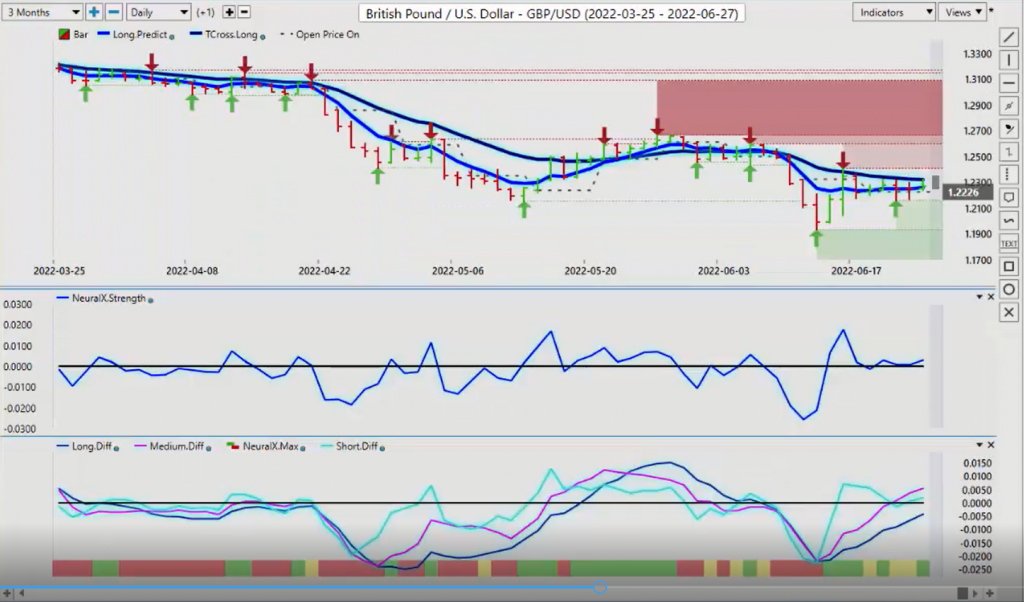
Now with the pound dollar going into next week, we faced the same situation with Euro U.S. Once again, the VantagePoint software does not determine the primary trend by the predicted high or the predicted low or the neural index. This I think is about the fifth time I’ve said this in the last couple of weeks to clarify some of the unusual comments section in the comments there. Because I think there could be some confusion there to say the least, despite the fact I repeatedly clarified it. So I will clarify it again. And you can see that the primary trend on the pound dollar is down. We’ve got buyers coming in. We’ve got a verified support low. That’s coming in down at the 119.34, but this is the one we want to watch, 121.63. If we can continue to hold above that, then pressure will mount on the pound dollar on this T-cross long. 123.21.
If you do not care for anything I just said and you want to continue to stay with the primary down trend, 123.21 is the short level. The additional verified support high at 124.86. But again, if the Euro breaks higher, if we combine all the VantagePoint core indicators, the neural index strength is pointing higher. Our predicted differences are all rising. Our neural index is green. We must, however, break above 123.21. The more savvy trader too could say, “Well, you know what? I don’t want to get involved with shorts. I’m not sure if long’s the play either.” So you would set up your buy limit orders above 123.21. And when it does break above it, you’ll be sitting there waiting for that particular long trade. The additional side of that, if you believe that this is going lower and the pound has considerably more downside to it, then you would sell into 123.21. Easy peasy.
U.S. Dollar versus Japanese Yen
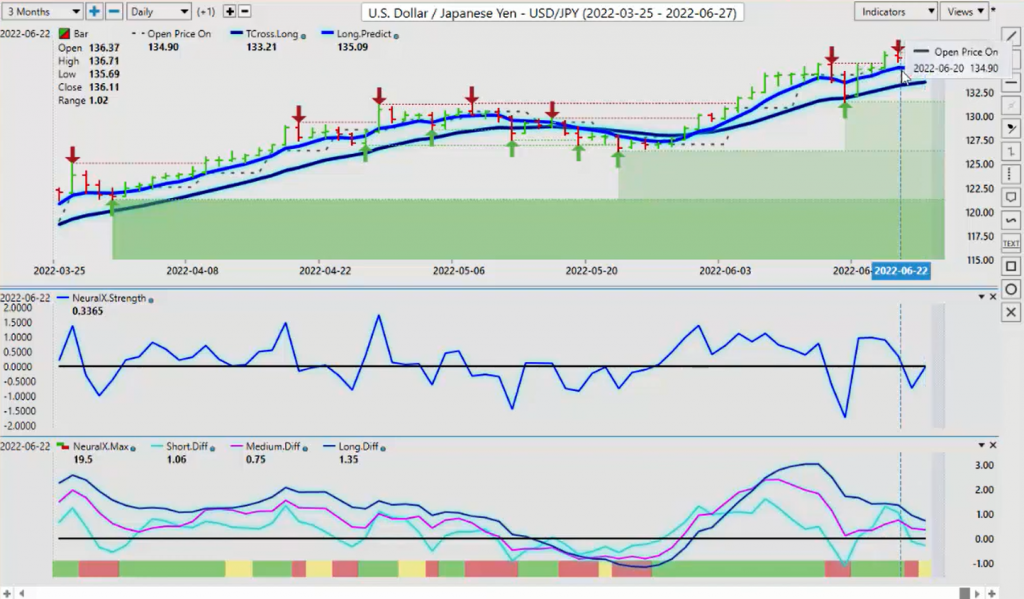
Now, when we look at the dollar yen, in myself and my own trading with full transparency, I’ve avoided this pair because only in my respectful opinion here, guys, it’s grossly overvalued at these particular levels. But again, you’ve got a lot of manipulation between the Bank of Japan, the Federal Reserve. They’re all interfering with this thing. So again, I think that if we break down below 133.58, we could be looking at a much larger drop. But the primary trend remains up. We continue to make new highs, but if the dollar comes under selling pressure across the board, then that’s going to hurt this pair also. So again, I would focus most of your trading on this pair near that T-cross long, whether you’re a buyer or a seller of this particular pair.
U.S. Dollar versus Canadian Dollar
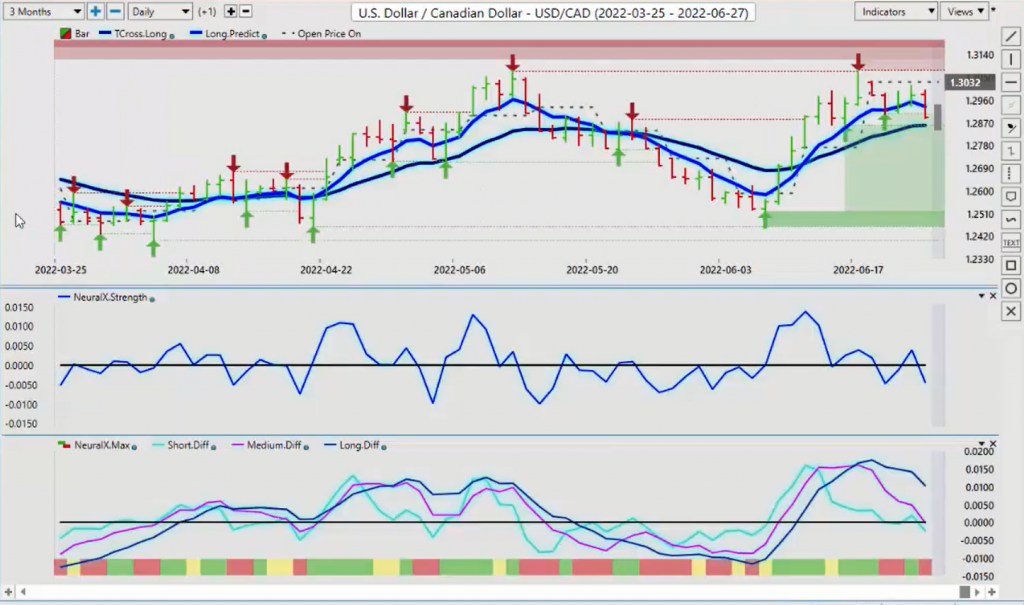
Now the U.S. Canadian pair, I’ve discussed this one at length, and again, to simplify this down. So again for that comment section, which some unusual comments to say the least, I’ve been pretty clear about this. This is your resistance area here. This is your support area here. This is a block price structure of the market. So before we came up to this level, I had said that it’s very unlikely the U.S. Canada pair, it is moving higher because we had this crossover. But it’s very unlikely that it will break much above the 130.78. It hit that level to the number and basically went down like a wet bag of cement. It couldn’t have been an easier short. Period, right? So where does that leave us for next week? What I will be looking for is once again, a breakdown below the T-cross long, at 128.62, but I will not be looking for that on a Monday or a Friday. These are two trading days that I’m very cautious. Friday, I don’t even bother with at all Monday, I will only take trades until after all markets are in after 8:30 a.m. Eastern standard time.
So in theory, what we would be looking for is a rally up so we can sell it. I would watch the 129.39 area, but that doesn’t change the original analysis, going back to May the 12th, that this is a major resistance point. A verified resistance zone was formed. That resistance top was confirmed on June the 17th. There is nothing to misinterpret here about this particular pair. Losing a trade on U.S. Canada, either long or short, is simply not following the analysis. It must break above there. And most of your larger institutions are going to target the tops and bottoms or just outside of the tops and bottoms of any longer term given range. They were sitting there waiting for this thing, as were we. So again, any stop should still be above 130.76 in your trading, and you should not be risking more than 1% to 2% on any given trade in any given market, in my respectful opinion.
Australian Dollar versus U.S. Dollar
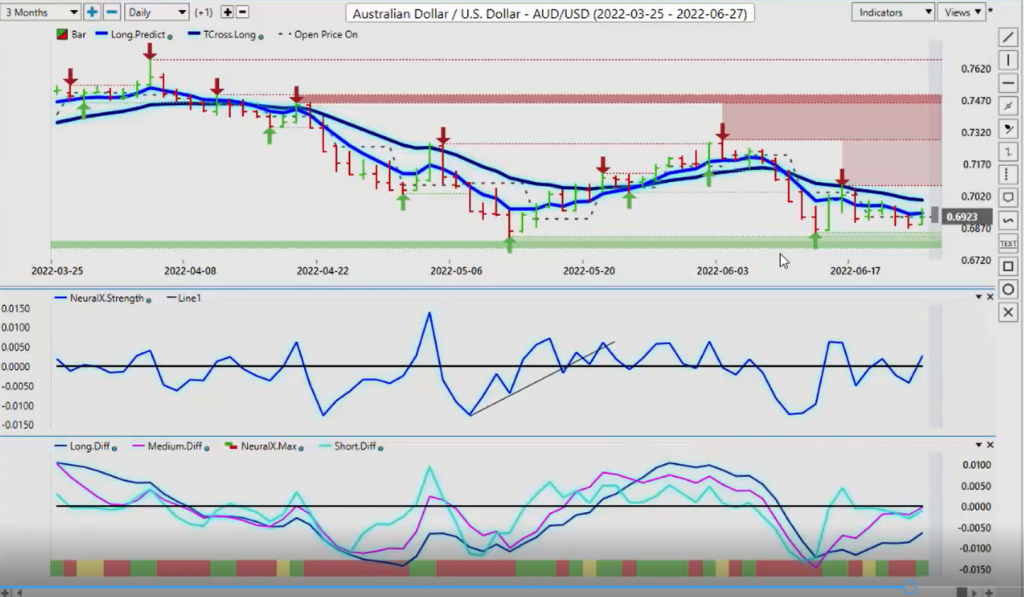
Now, again much like with that fire sale that I had talked about the other week about selling U.S. dollars, that still remains in play. But the Aussie U.S. and New Zealand U.S., if they can get moving, but we need stocks going up to support these trades. Now again, the MA Diff cross, looking good. We’re still trying to push higher here. We’ve got a gap. We still have a gap to fill here. Okay? The T-cross long is 0.7002. We’re closing out the week at 0.60, approximately it looks like we’re closing 0.6922. So there’s still a gap of about 80 pips that I believe at the very least, we’re going to test that T-cross long. The indicators from VantagePoint, our MA Diff cross, we’re getting very close to a medium term cross over. As soon as this pink line crosses that zero line, you are going to have a medium term crossover.
The long term crossover, the angle of it, it’s starting to point up also. We’ve got a green neural index that matches the MA Diff cross. So it tells us, and again, in a trade setup like this, guys, this too is not a new trend. It’s corrective in nature. It’s a corrective buy signal in the software, but it’s going to tell us if we can close above the T-cross long at 0.7002, that’s what will determine a new trend.
New Zealand Dollar versus U.S. Dollar
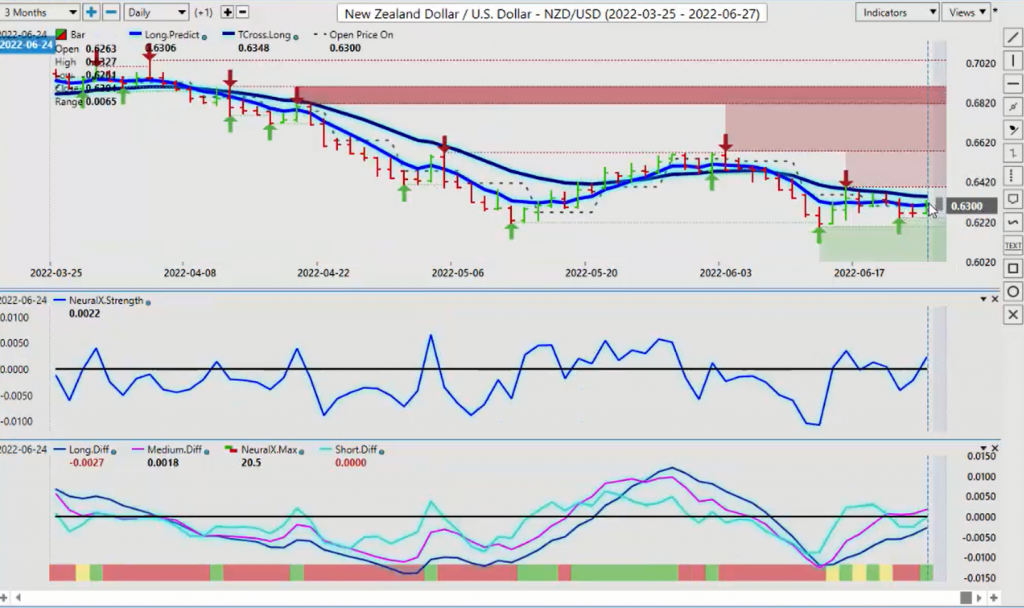
The exact same thing applies to New Zealand, just adding a different number. The T-cross long, 0.6348. We’re closing the week here on this one, around 0.6294 I believe. So again, there’s not as much of a gap on this one, about 48 pips. But once again, the indicators are warning us the predicted short, medium, and long term differences are rising. Our neural index strength is pointing up, and our neural index is green.
But remember, Monday is to some degree a fake trading day. So whatever it does on Monday, it tends to do the exact opposite on Tuesday. And that starts to show us what the real trend is going to be for that particular week. Then apply your weekly opening price. If we’re holding above the weekly opening price, then longs are viable. If we’re holding below the weekly opening price, then shorts are still on the table. So once again here guys, another choppy week ahead but with that, there is always trading opportunity if we know exactly what we’re looking for. So with that said, this is the VantagePoint AI Market Outlook for the week of June, the 27th, 2022.