


Welcome to the Artificial Intelligence Outlook for Forex trading.
VIDEO TRANSCRIPT
U.S. Dollar Index ($DXY)
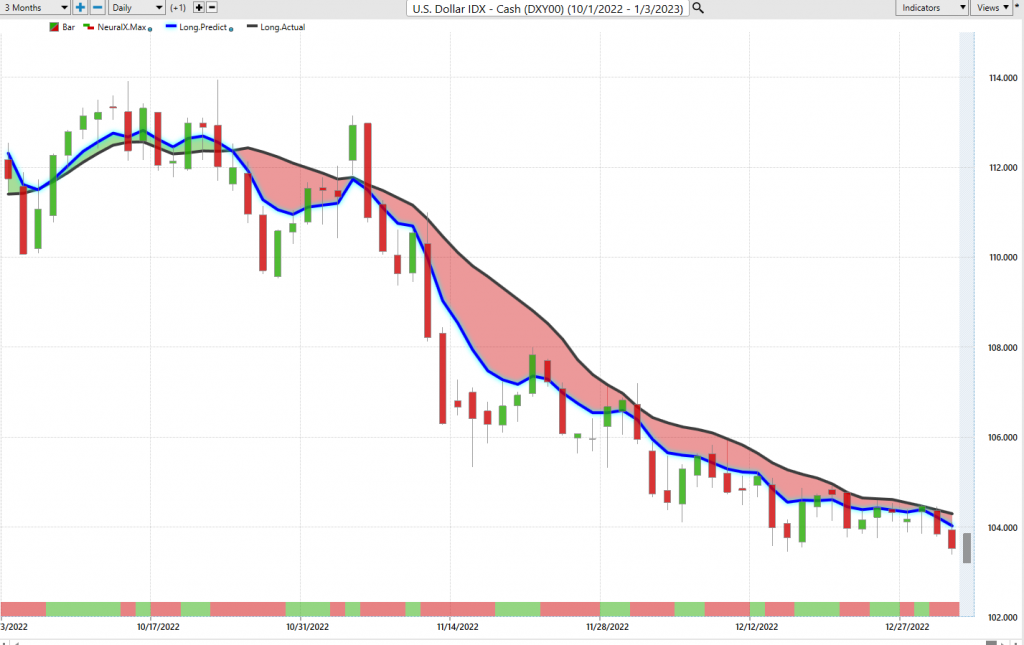
Hello everyone and welcome back. My name is Greg Firman and this is the VantagePoint AI Market Outlook for the week of January the 1st, 2023. Now, to get started this week, we’re going to begin where we always do with the very important US dollar index, but I do want to take the time to wish everybody a very happy new year and a very prosperous trading year. Now, when we look at the dollar and every single market that I’m going to discuss in this week’s presentation is we want to look at how the market opens the beginning of the week. Now, there is a holiday on Monday, so thin liquidity for the better part of next week. In my opinion, the liquidity will be very low and very thin. So, what we’re looking for is at the closing price of the dollar index 103, approximately 103.49 is where our yearly opening price is going to begin. So, when the dollar index starts trading on Monday night.
So, looking at that particular level, we want to monitor to see if the market can stay above that yearly opening price. In my respectful opinion only, it probably will not. It move lower until about mid to the latter part of January where a powerful seasonal pattern will kick in. That pattern, we want to keep a very close eye on. So, if we look at this in years past, we can see it very clearly sideways to down market on the dollar index and then we start to move higher into, I would argue, usually around the third week of January. When we look at it going back two years, we can see something very, very similar. And that seasonal pattern usually ends around usually mid-April, I would say. So, again, we’ll be looking for dollar weakness to start the year and now the VantagePoint TCross Long, that’s coming in at 104.60, that is our main resistance.
And, again, the yearly opening price is very important because while people are calling a top on the dollar, a bottom on the dollar, this and that, the factor remains that you can see using that yearly opening price over the calendar year. The dollar has really never been below the yearly opening price for any more than a couple of days here and there. The bulk of the rally, the dollars had a very, very good year. But in the month of December, a very strong seasonal pattern. I would argue that it started early this past year back here in November when we crossed over the VP TCross Long. So, once again, we will monitor these levels, but the indicators going into next week, we can see we’re below the TCross Long on the daily. If we click on F8 in our VantagePoint software the predicted moving average, 104. So, all of these levels, again, represent a bearish tone to the dollar to begin the year. When we look at the main indicators, the neural index strength is crossing to the downside. We’ve got a neural index itself is red pointing down.
The predicted differences are also pointing down. We cannot break above the zero line, meaning the medium-term and the long-term crossover are still pointing to the downside, not the upside. So, I don’t need the blue line crossing the black line up here because I can see it very clearly the crossovers using the predicted differences. Now, when we look at gold going, and again, into this year, the gold remained bearish on the year. We closed 2022 below the yearly opening price. Now, what we’re doing is setting the bar very high for gold in 2023 and it’s very unlikely that gold will see any significant rally, but it could. If we go into a full on recession, my hope is the Fed will back off here with the rate hikes that will cool everything down, equity markets can recover a little bit, but all of these are basically negatives for gold.
Gold
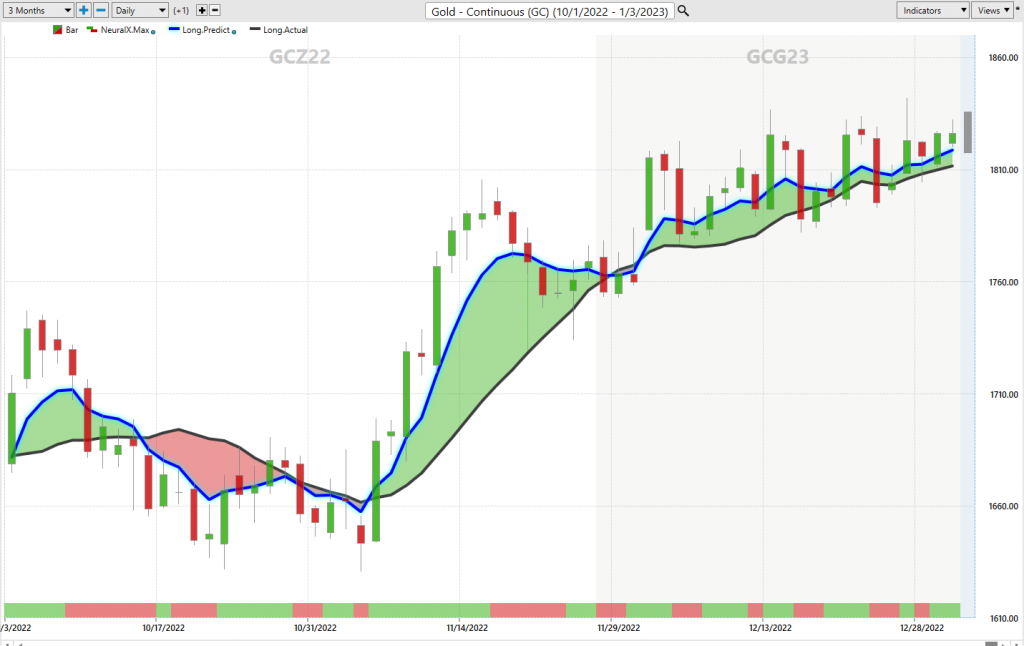
And now, historically, gold has rallied 75% of the time when we’ve had a global recession, but this is not a normal recession with the Fed hiking the way he has. So, again, we can see that gold is closed at 1824.09, below 1829, the yearly opening price. So, again, the bar is set quite high here. When we look at gold going back over where what it did last year, you can see that gold really didn’t get any traction, but we had the Russia, Ukraine war. So, if we go back to the previous year, we’re still dealing with COVID. But you can see that this is more the rally I would anticipate for 2023, basically gold spiking for the first couple of days, then we go down, and then gold recovers during its normal seasonal pattern, which is the latter.
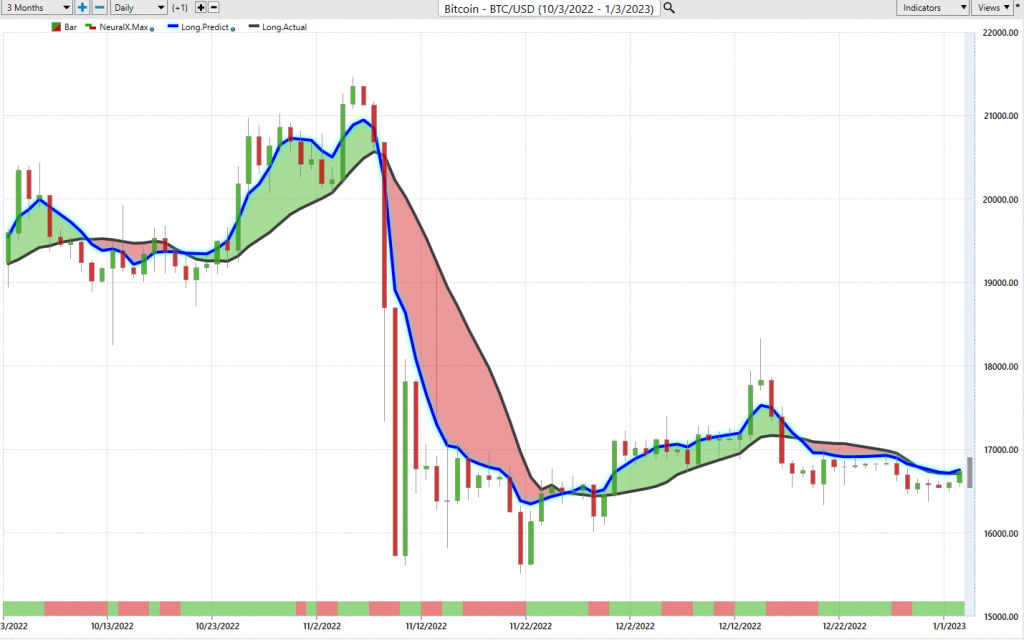
The early to mid-April is where gold would see some buying. I’m confident that gold will remain in that particular cycle. So, when we look at the current pricing right now, we can assess that we’re above our TCross Long, 1798. When we click on our F8 in our VantagePoint software, we get that additional pivot level that’s coming in. Our Long predicted at 1811, so we have fairly significant support down here. But, ultimately, gold is going to likely struggle come mid-January. Now, when we look at Bitcoin and now once again, we hear so many things about FTX or FXT, all these different things. The fact remains that Bitcoin has a 98% correlation to the S&P 500, the Nasdaq, the global stock indexes. So, if the stocks recover closer to, I would argue, March, April, or May, when the Fed, hopefully, starts backing off a little bit, then that’s when we would look to see if we can get Bitcoin moving.
Bitcoin

If we look at Bitcoin from one year ago, you can see that January is not a great month for Bitcoin and I don’t see that any different this year. Now, I would make that assessment not just looking at the Bitcoin chart itself, but looking at where the global stock markets are. They finished the year extremely bearish. The Santa Claus rally that they were all talking about, stocks have put in a bottom, they’re going to go higher from here. There was really nothing to push stocks higher in the month of December. It’s been in a bear market the entire calendar year. When we look at a quick review of 2022, it was an extremely ugly year for stocks and it didn’t finish any better than it started here. So, right now the TCross Long, 3876, but where we’ve closed at 3839. That’s potentially a good thing guys, because with its closing that low, it sets the bar low.
S&P 500 Index
So, again, if 3839 is going to be approximately our yearly opening price, then I think that there’s a better chance that stocks can recover. But we are going to need the Fed to assist with that by backing off these crazy rate hikes because it really is getting a little ridiculous at the rate of these hikes and the size of them. Historically, I’ve never seen it before. So, with the S&P 500, we want to watch this very closely because if the S&P rallies, that means that Bitcoin is going to rally, the dollar is likely going to sell off, gold is not likely to move higher either way. So, when we look at this right now, the indicators are slightly positive here. Our predicted differences are starting to rise, but the neural index strength here, it pointing back down again. So, once again, when we look at stocks from one year ago today, you can see that that January is pretty nasty.
The previous year, actually, was quite good for stocks two years ago. When we look at three years ago, you can see we had that… I would consider this chart from three years ago to be one potentially 2023 could mirror this particular setup because the Fed is likely going to stop hiking here sooner rather than later. So, the stocks have a little bit of a gain there. They go lower right up until about April the 6th. And the inner market correlation that we know and love is dollar down, stocks up. So, we would be looking for that, but not until the first part of April to say the least.
Crude Oil
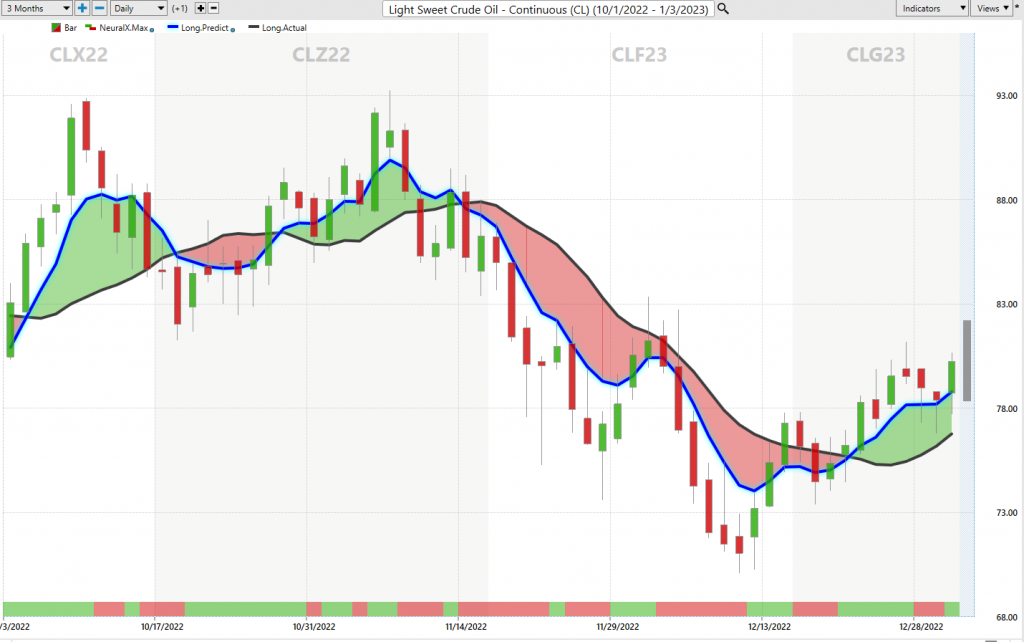
Now, again, oil finishing the year trying to turn somewhat bullish now. 7539 the yearly opening price goal… Or excuse me. Oil didn’t have a bad year here, it didn’t finish great. But once again, you can see as the dollar started to tank and the equity markets were not doing great, even the rallies and stocks didn’t really help oil that much.
So, the way we will look at this now or the way I will look at this, if we’re closing oil out for 2022 at 8026, it’s setting the bar rather high for oil prices to hold this momentum into 2023. And I don’t believe it will be able to do that personally. But, again, I try and take the opinions out of it and focus on the indicators. Right now, neural index, neural index strength, they’re pointing up, but the medium-term strength is weakening against the longer-term. So, you can see that basically when the pink line crossed the blue line to the downside rate over here, oil is really done very little. We still at a poor month in December. The red line is the monthly opening price, that’s aqua colored, one is the weekly open at 7990. And, of course, the yearly opening price at 7539.
So, there’s a lot happening right around here. But, essentially, oil indisputably finish the month of December, basically, exactly where it started. And look at all of this nonsense going on in between. But that’s why we have the VP indicators to warn us that, “Look, it’s choppy.” But if we’re below that monthly opening price, then it’s not having a good month and it didn’t. So, again, we’ll monitor this going into 2023, but I believe it will be difficult for oil to maintain $80 a barrel, particularly if we go into any type of global recession. Now, when we look at the Euro, once again, the Euro starting strong at 2023, but that’s not a good thing here guys. The higher the Euro goes at the end of this year of 2022, the tougher it is. It’s going to be for it to hold this momentum.
Euro versus U.S. Dollar
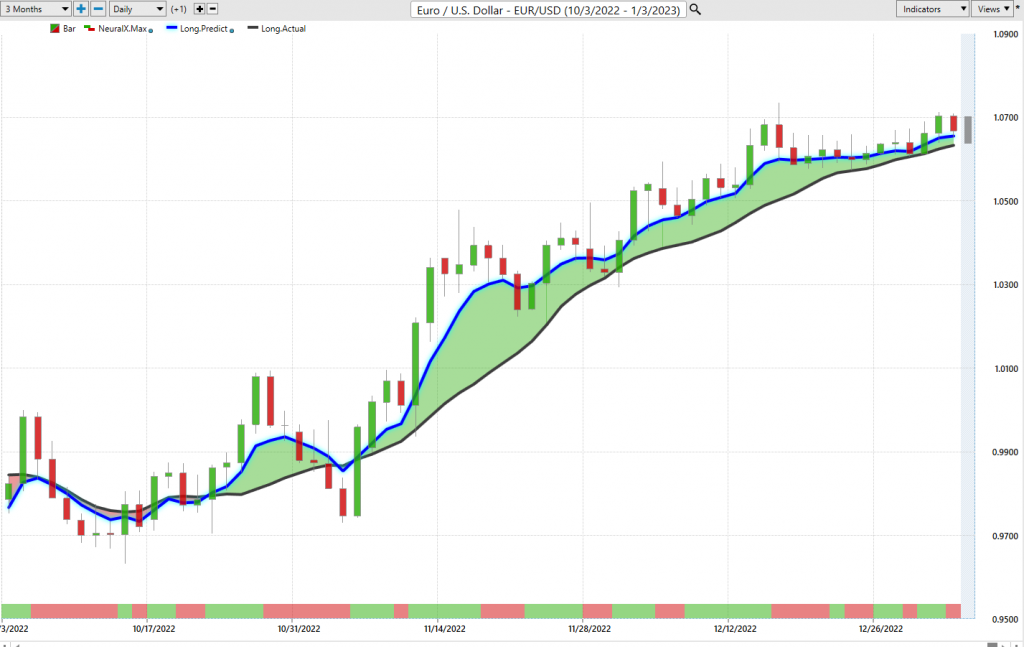
So, right now, the Euro is still very bearish on the year. 1.1367, the yearly opening price holding firmly. Well, closing the year far, far below that, that’s a big hit the Euro’s taken this year. But the indicators right now are actually net positive. So, it’s telling me the initial move out of the gate in the first two or three weeks of the year are going to be good for the Euro. But then the seasonal pattern of the dollar index will kick in and then we’ll see the Euro tank. So, the immediate to start the new year is going to be positive on the Euro while above 1.0592. Now, with the US Swiss Franc, looking at this one a little bit more closer. Again, this payer very much mirrors the dollar index. When the dollar index broke down below the VantagePoint TCross Long back here in November, you can see that US Swiss Franc did the exact same thing.
Now, to give you just a quick viewpoint of that, you can see it back here the same time. So, again, if the dollar index follows, if we get to some normal here, then the dollar goes lower for the better part of January and then it turns around. So, again, we will monitor this, but I would look for the potential for Long trades here. But, again, leverage the yearly opening price to see where the market is. It’s a true way of determining whether something is bullish or bearish. But either way, we’re going to be looking very closely in mid to late January for the long opportunity on this particular pair, but we must cross 0.9314. One of the ways that I do this here that I can suggest is having limit orders sitting just above the VantagePoint TCross Long. So, whenever we’re done at the bottom, my limit orders are always sitting just above the TCross Long to catch this very, very likely reversal.
British Pound versus U.S. Dollar
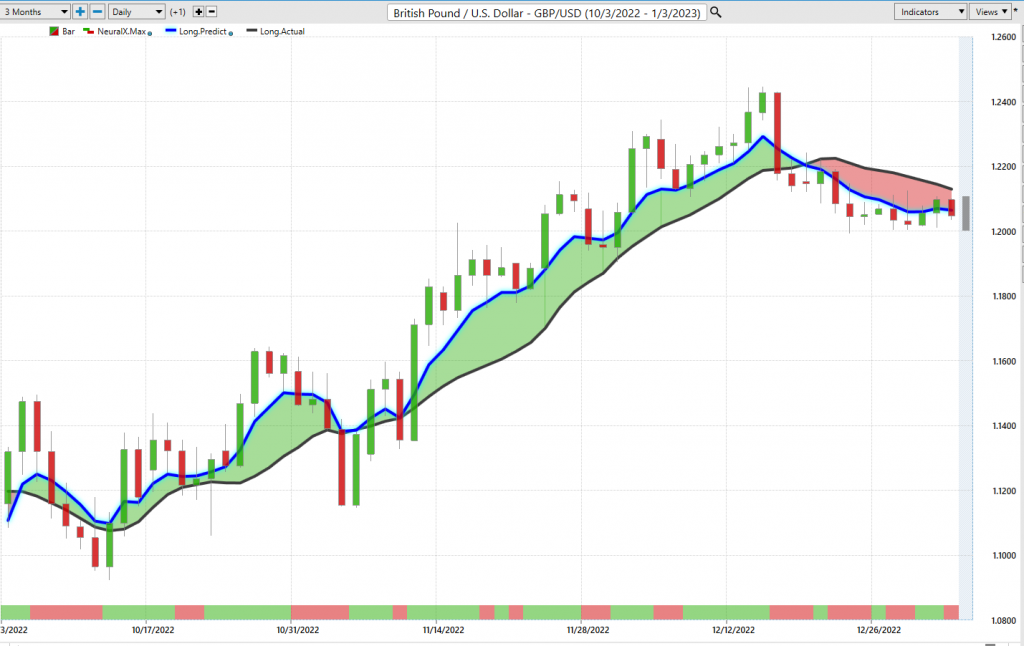
Now, with the pound, dollar, the pound, dollar finishing the year, not too bad, but still way down from 1.3531. It’s a yearly opening price. Right now, going into 2023, looks like Longs are on the table. The neural index is positive. The neural index strength is above the zero line, the MA diff cross, which warns us of a pending move in the opposite direction. So, all we’re doing is looking to gain momentum above the TCross Long at 1.2091 in order to add additional Longs here. Now, what I like about this here, particularly, is that this is approximately the closing price of 1.2097 will be the yearly opening price for 2023. So, again, it’s setting the bar very, very low here for shorts, Longs are obviously heavily favored.
But still some issues in the UK I think they can work it out. But the theory is that, as long as we’re above 1.2097, then there is a Long trade here. Now, once again, the pound is very, very volatile. When we look at last year, you can see that we had that strength at the beginning of the year, but then that dollar seasonal pattern kicks in. If we go back two years on this, we can see the same thing, a strong move going into about February and then down it goes again. But I believe that we should be looking at the 2019 chart because this is the norm, is that we have a bit of a rally in the beginning of January and then we tank until about April, and then the pound makes the bulk of its gains. So, when you’re looking at this, another trick is looking back at what VantagePoint forecasted in 2019, because I believe that this will be, potentially, a very similar year.
Of course, I may change my view on that with all the things that are going on with Russia, with all these different things. But for now, watch for that same or very similar pattern.
U.S. Dollar versus Japanese Yen
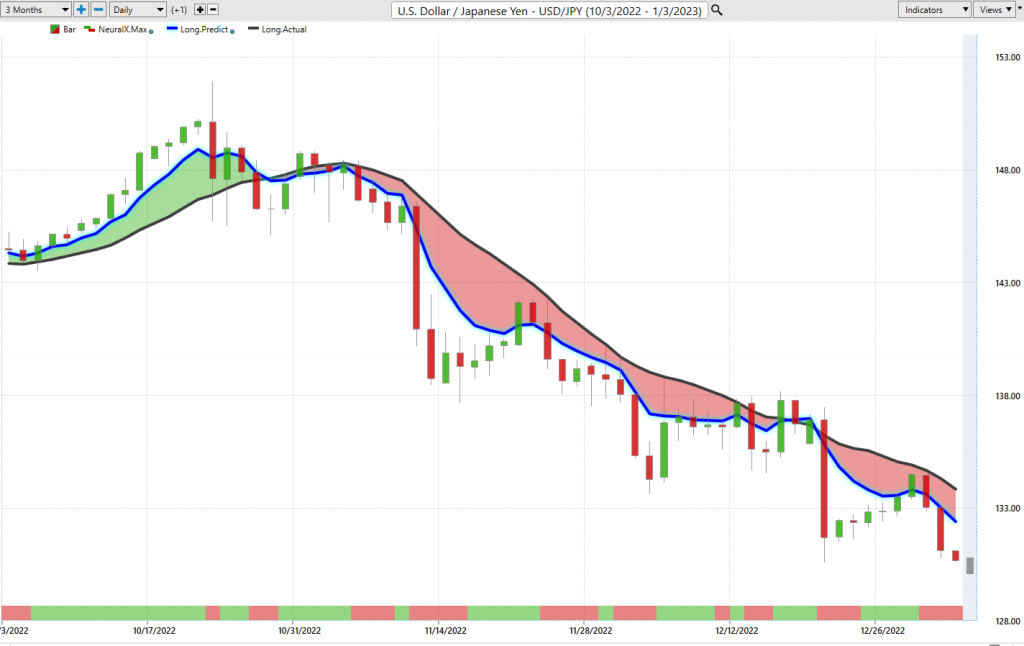
Now, the dollar, yen, not everybody’s favorite pair. I believe that this pair it could have one heck of a year for shorts once the Fed backs off a bit here. Right now, you can see that TCross Long 134.69 short while below this particular level here. But, again, right now, if we look at where we’ve closed, we’ve closed out 131.12. Then basically what it’s saying or what I’m saying is that if the dollar, yen is going to maintain this bullish tone, we have to hold above 131 in 2023. That is not going to be an easy task. Regardless of the interest rate differentials, now, you’ve got the Bank of Japan starting to say things that they normally don’t say.
So, again, we’ll monitor this each week, but it’s always good to combine that. Right now, the dollar, yen has had it’s best year probably on record to the upside hitting, I think, a high somewhere up near the 150 level. So, this kind of trade is very difficult to maintain. So, again, we’ll monitor it, but for now, there is a slight bias to the downside while below that critical, 131.12.
U.S. Dollar versus Canadian Dollar
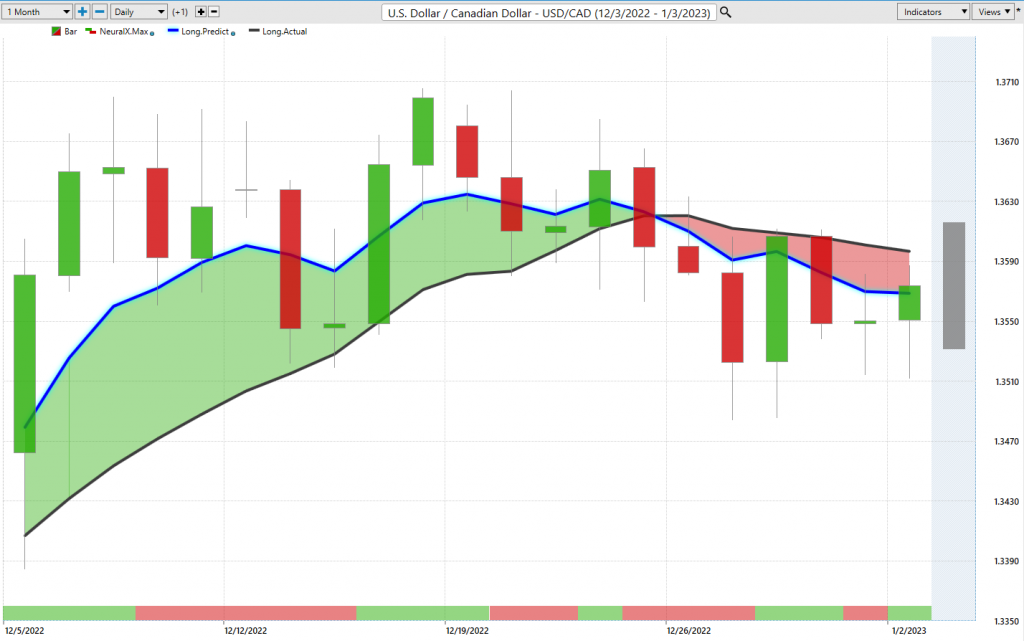
Now, US, Canada are equity based currencies. The Cad, the New Zealand, and the Ozzie, again, they are reliant on the stock market moving higher. It’s not all about indicators guys. It’s about inner market correlations that we need to know, understand, and use them in our trading. And I can tell you that the Canadian dollar has a 95% correlation to the S&P 500, as does the Kiwi, as does the Ozzie. So, right now, I believe a short is starting to progress here.
The Canadian, this particular pair, 1.3551, the theory here is short. That will likely be your yearly opening price at 1.3551. So, we’ll monitor this particular level as long as we’re holding below it, then shorts are in play. One of the tricks, again, you can go back from last year was a difficult year, but you can see that right out of the gate, even with that strength in the dollar, this pair was still very strong… The Canadian dollar, excuse me, was very strong. If we look at this from two years ago to see what it did, I’m seeing the same thing. If I look at it from three years ago in the month of January, I still see the same thing, but it only lasted to the 21st and then this thing went to the moon. So, either way, that first three weeks of January basically favors the Canadian dollar is what I’m saying.
So, we’ll monitor it or I will monitor it and update everybody weekly. But, again, right now, keep an eye on that TCross Long. The Canadian dollar did not have a good year against the US dollar. 1.2637, that yearly opening price, the market, as you can see, during the calendar year, basically there was a lot of choppiness in the first three or four months. And then this thing, by the time we got into about June, a very clear, defined, powerful uptrend formed. And what I might point out here is that’s despite oil prices at over $100 a barrel. So, you can see the Canadian dollar was not responding to oil, it was responding to the selloff in the global equity market. So, keep that in mind. Because, again, the same thing will apply to the Aussie. Now, this could be a heck of a year for us buying Ozzie, buying Kiwi, buying the Cad. It’s very possible.
Australian Dollar versus U.S. Dollar
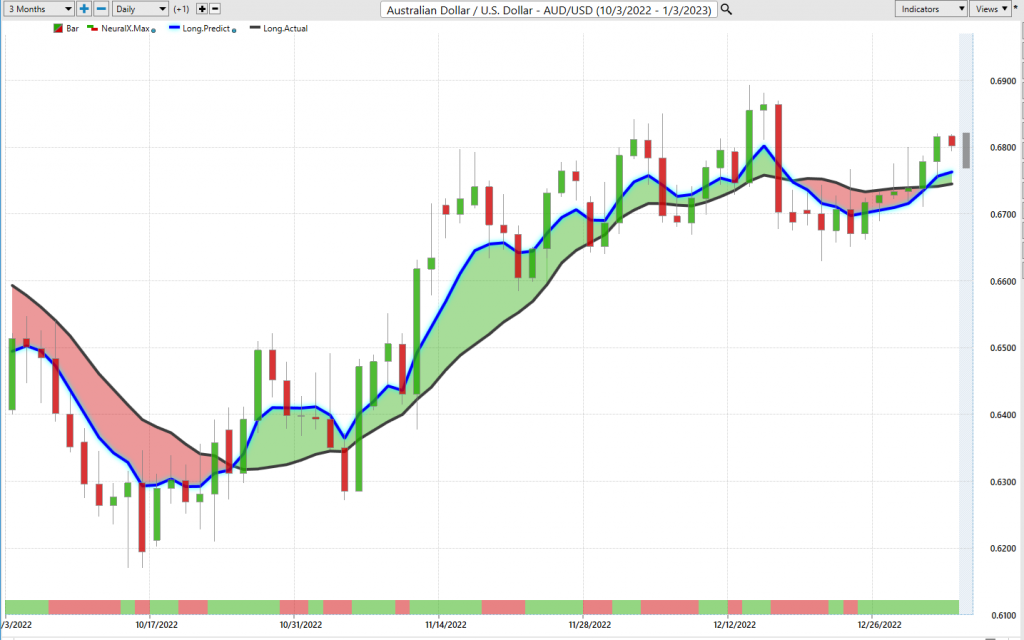
The Aussie is finishing fairly strong, but still well below its yearly opening price. So, again, the TCross Long, 0.6732, you can see the predicted differences, which means we’ve got a medium-term crossover took place here, long-term crossover is just occurring now. So, that’s telling me that the Ozzie has some upside potential, but it’s all based around dollar weakness either way, even though the Ozzie’s not in the dollar index. But for now, we want to monitor this one because I believe it could be a much better year. If we look at some of the years gone by when the stock markets had the selloff, I haven’t seen a selloff in the equity markets this year, I haven’t seen anything like this since ’08, but this is a very different one that took place in 2022.
New Zealand Dollar versus U.S. Dollar
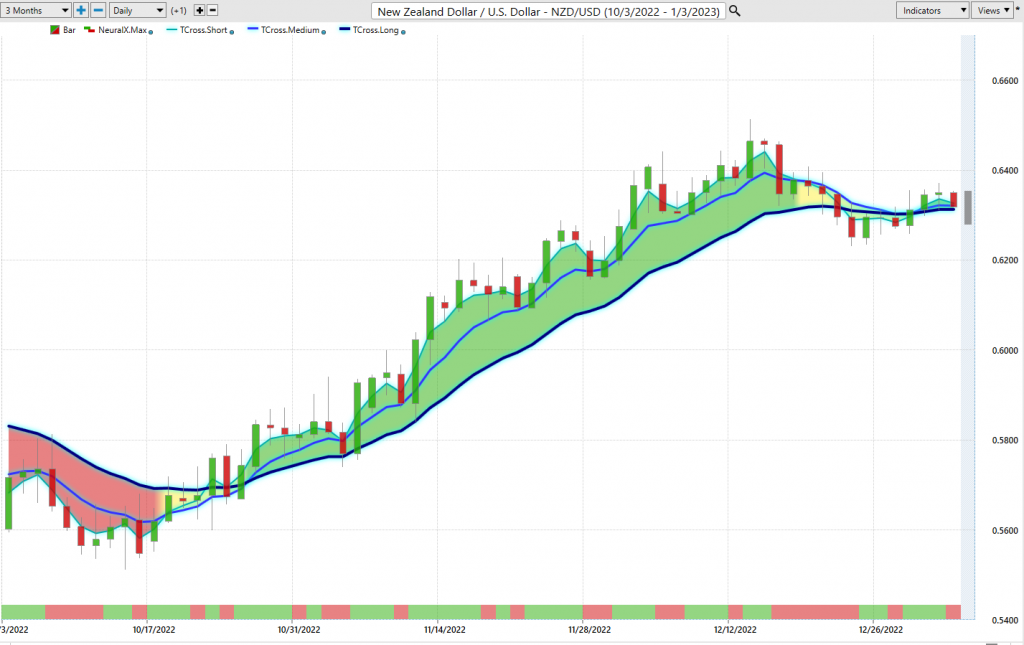
The Russia, Ukraine war, but it was mainly, what I’m going to argue is, I don’t even care about that, was the Fed hiking, which caused the stock market to plummet. So, if that’s what caused it to go lower, if he stops hiking, that same very thing could send it higher. But if it does, remember Aussie US, New Zealand US, they go with it. They’re basically the same trade here guys. And you can see that the Kiwi is slipping above. We’ve got a two-day close, but again, the month of December is very low liquidity, low volume. But we’ll monitor things going forward. But, again, you can see that we have a buy signal.
The medium-term crossing the long-term predicted difference. The Kiwi held above its monthly opening price for, basically, I would argue, almost the entire month of December except for one day. So, when we look at either one of the Ozzie or the Kiwi, you can do this on either one, you can see that it goes sideways and then it takes a dip, and that usually sells off here. So, we have a very, very choppy start to 2023. But with that, we’ll come significant opportunity. So, with that said, this is the VantagePoint AI Market Outlook for the week of January the 1st-


