


Welcome to the Artificial Intelligence Outlook for Forex trading.
VIDEO TRANSCRIPT
Hello everyone and welcome back. My name is Greg Firman and this is the VantagePoint AI Market Outlook for the week of February the 14th, 2022.
Now, to get started this week, we do have quite a bit to cover. A lot of activity in the market this week. So, we’ll begin with the US Dollar Index but first, let’s look at the indicators we’re using this week. In this week’s presentation, we are using bars, not candles. We’ve got our medium and long-term predicted difference and our Neural Index. I’ve added the Neural Index strength. Our point in time, predicted RSI, our short-term predicted difference, our triple EMA cross, which has been modified. I’ve removed the short and the medium term cross so we can focus on that key VantagePoint long-term pivot point. And of course, the very popular verified support and resistance zones.
U.S. Dollar Index
So, let’s have a look at this past week. In the previous week’s outlook, I had advised to keep an eye on the weekly opening price of whatever it is you’re trading. The reason I’m saying this is that very often we have our Monday price, then we have a reversal move on Tuesday and then the primary trend for the week starts to form. Now, in this particular case with the VantagePoint T cross long, we have the yearly opening price and the weekly opening price that were very similar last week. So, as you can see, the Dollar Index has held above its weekly opening price the entire week. But on Thursday, we had our MA diff cross with our Neural Index. Now, this is a very important trade setup that you want to keep your eye out because it’s very seldomly wrong.
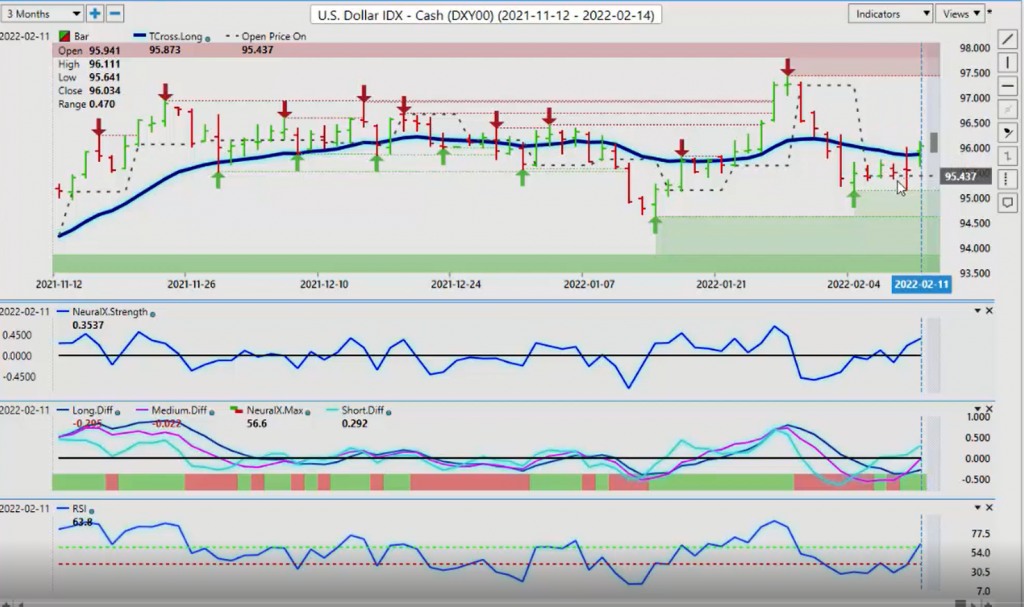
Now, we have a lot of things going on in the market with the Ukraine and Russia and that’s going to affect this week’s presentation. I’ll lay it out there right now. I have no control over what Putin does or what Biden does with it or what the outcome of this but clearly, Putin is building up forces and the likelihood that he crosses that Ukraine border is becoming increasingly obvious that he’s going to do it. So, when we look at this right now, you can see after the US CPI data, we ran both sides of this. But our verified support low that was identified going all the way back to February 4th, that level low at $95.13. You can see that we’ve come right down to that on Thursday and then rebounded off of that. Now, we’ve closed above our T cross long at $95.87. So, to begin the week, we would look at this as bullish for the dollar. The seasonality of the dollar is usually quite strong in the month of February and the better part of March.
So, our Neural Index strength has crossed the zero line. It’s pointing up. The MA diff cross and the RSI at $63.8. So, this is all pointing to further US dollar gains. Now, my concern is that Russia doesn’t invade and tempers come back down and nothing becomes of this. That would soften the dollar but that wouldn’t change the seasonality of dollar strength. So, again, we would look to build on this but we do need to hold above the weekly opening price and the yearly opening price for next week. I can approximate that number by the closing price at $96.03. But again, a little bit lower. $95, approximately the $95.64 area. That’s the level we would look to hold.
Gold
Now, that same ominous signal that I discussed in last week’s AI Weekly Outlook and warned. And what I had stated very clearly is you never can really count gold out. The MA diff cross crossing the pink line crossing the blue line. Again, I will point out in this trade setup one more time here that using that key pivot area, the MA diff cross, if we click on the conventional indicators of the blue line crossing the black line, we can see that, that hasn’t taken place yet. So, we really do get a big jump into these trades early. Now, respectfully the initial trend here or shift was corrective in nature. Now, the question remains, can it go above that? So, if we look at the exact same scenario from last week where I pointed out and said, “Look, we’ve got an MA diff cross. If that Neural Index holds green, then gold is likely going to extend higher.” So, we came up to the VantagePoint T cross long but then we closed above it and we closed above it two days in a row. And ultimately, that led to this going higher.
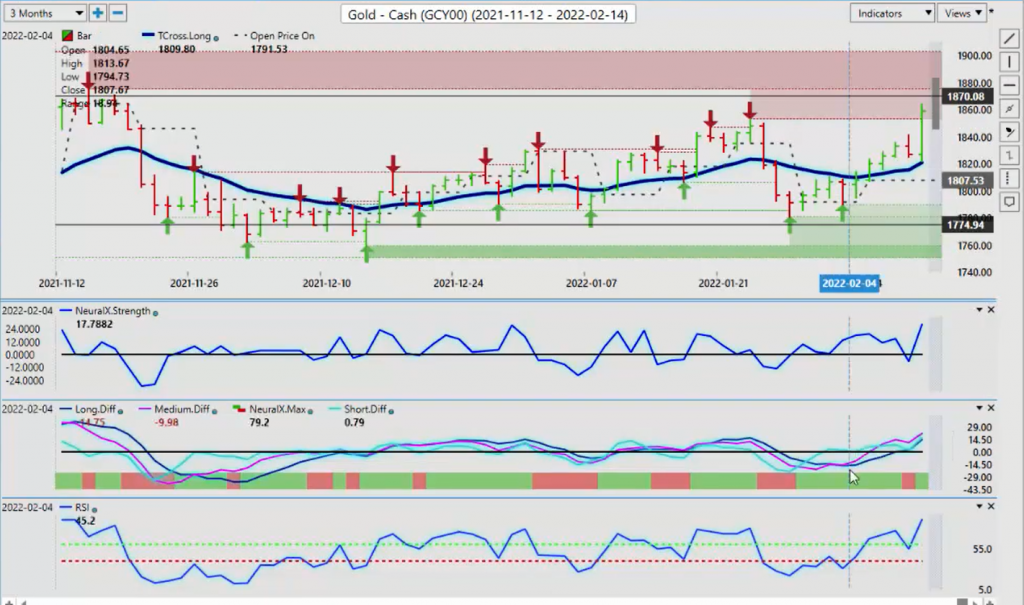
But once again, I will point out the methodology that I spoke to last week. Watch the close on Monday, the end of day on Monday. Where does the market close? Above or below the weekly opening price? Then we look at a comparative analysis between that and the T cross long. That led to a significant rally in gold. Now, once again, as I would recommend here or recommend with my own direct client bases. I would say, “Look, I usually will never buy a bar that looks like that.” That’s a lot of movement on a Friday. I don’t know why they always have these announcements on a Friday but they do so it’s caused a significant spike. So, we have some verified resistance up here around $18.80 but gold has cleared its yearly opening price. That area around $18.30 that I’ve been discussing.
So, again, most of the indicators here suggest further gains for gold but that will still be dependent on what happens with this Russia-Ukraine conflict. If that dies down, then gold will soften very, very quickly. So, we identify where that key level is, $18.20. That’s the level we will watch to begin the week. As long as we’re holding above that, then the bias is still for further gains.
Crude Oil
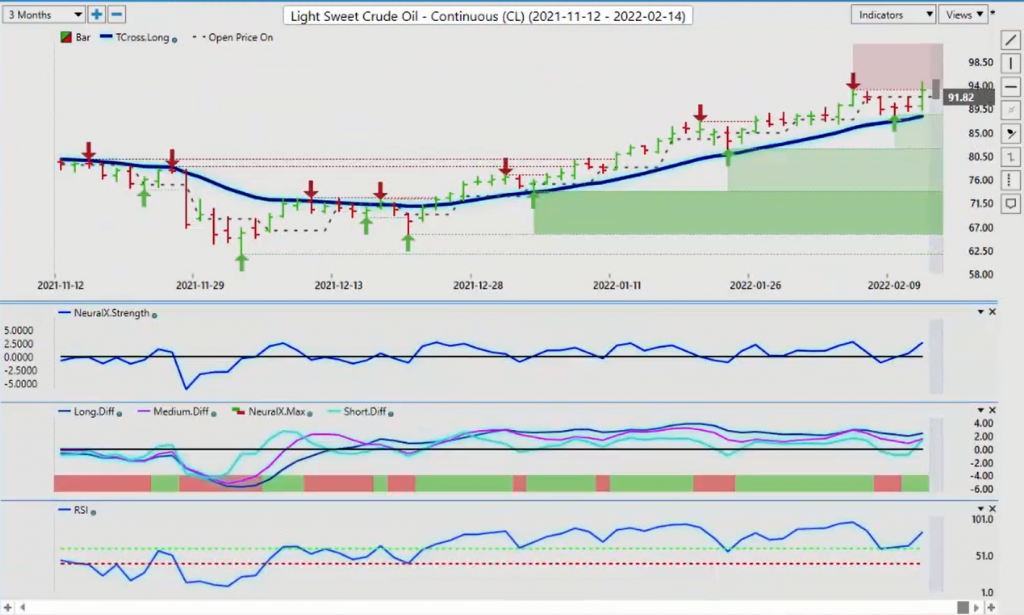
Now, looking at some of the main commodities like light sweet crude oil, we can assess here that oil is likely going to advance further next week if this conflict continues. It will send oil prices higher and gold prices higher. Natural gas prices are all likely going to go up, unfortunately, next week. So, you can expect to pay more at the pump. But looking at this right now, we do have some significant verified resistance at $93.17. So, again, if that conflict subsides, then oil prices will back off with it. But again, if we’re looking at what the analysis is to start the week, the Neural Index and the Neural Index strength. They’re all pointing higher here with a main support level down at the T cross long at $88.13.
S&P 500 Index
Now, when we look at the S&P 500, it’s just taking an absolute beating on this news. And the second they talked about the Ukraine and Russia conflict potentially getting ready to get even worse, you can see that equities did not like that one bit. So, we’ve pulled lower but equities really did struggle the better part of the week. We had a couple of decent days there on Tuesday and Wednesday. I’m seeing a bit of a pattern here with the S&P and some of the global indexes that they’re not too quick to buy them off the start.
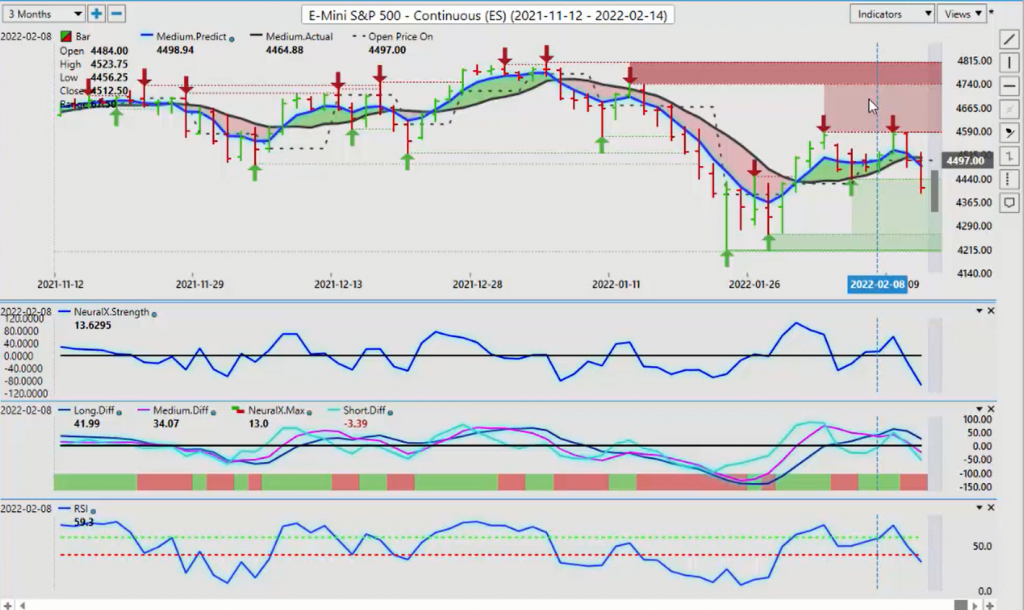
But again, there’s that constant Monday, Tuesday reversal that I’ve talked about where Monday we have a down day and by Tuesday, we recover. Wednesday, we have a big move up and then Thursday and Friday, we’re down again. So, to start the week, we’re looking for further downside but what I would point out yet again, is this MA diff cross right here. The pink line crossing over the blue line. The second the Neural Index went from green to red, we had a much bigger move. But once again, this was forecasted days before that actually happened. So, again, if we do a comparative analysis to the blue line crossing the black line, that is coming on board but as of Friday. So, again, when we look at this type of setup, we’ve got an early warning on February the 8th, that the stocks were in trouble. When we apply that yearly opening price to the S&P 500, we see something very similar that the S&P remains bearish on the year.
So, if I right click on my chart and go to Properties, I can then look at my point in time and then change that from the weekly to the yearly. I can apply it to what I’m currently looking at. And you can see that, that’s where we’ve opened the year on the S&P 500. And we have not been above the yearly opening price this entire calendar year. On top of that, we have a seasonality coming up here shortly where stocks usually extend significantly lower. So, this could be the start of that move lower right now.
Bitcoin
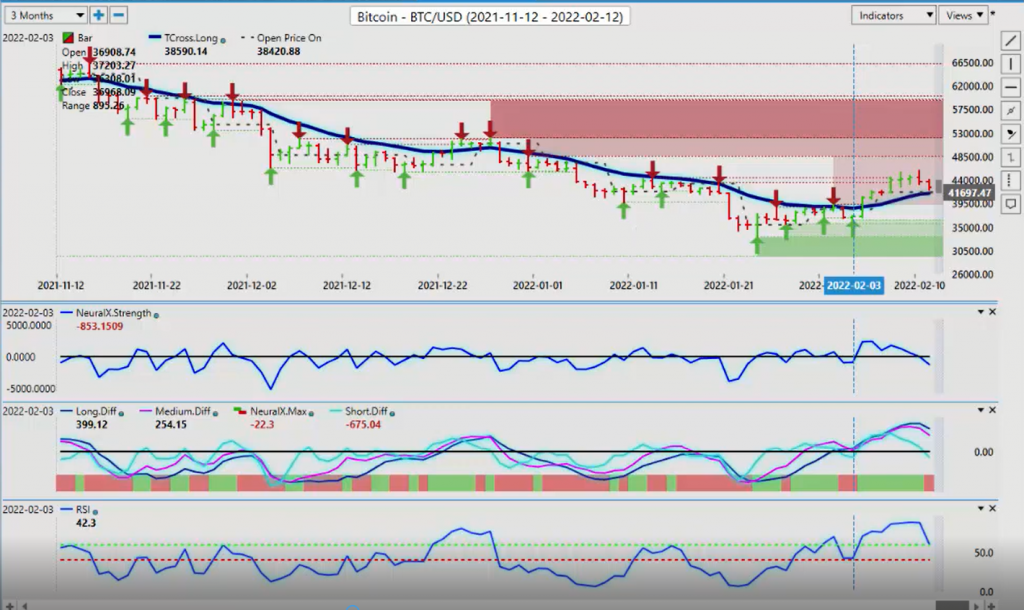
Now, Bitcoin remains resilient. And again, when they talk about hedging currency, risking, hedging your currency risk and your inflation risk, Bitcoin is still a player here, guys. When we look at this, we’ve got our T cross long at $41,439. So, we’re looking to see if we can hold above that but I do not like the slope of this Neural Index strength that’s pointing down and it’s crossed the zero line.
So, once again, Bitcoin does tend to follow the NASDAQ and the S&P 500 but I’ve also seen it follow the US dollar. Not gold, obviously, but the dollar. So, I’ll monitor this but keep an eye on $41,439 to see if we can hold above that. But once again, if we apply our weekly opening price to gauge price action, that can be very helpful but I would suspect that we would potentially make a run down lower towards the $36,000 mark based on the heightened conflict in Europe. Now, as we come into some of our main Forex pairs, once again, building on last week’s strategy, I discussed to keep an eye on the weekly opening price and where we close on Monday. That usually sets the tone for the week.
So, again, we close below this. The market during this entire previous week was trapped between the T cross long and the weekly opening price but with a downward bias. We can assess here using the Neural Index strength. We had a big move up and then we moved up again the next day but you’ll notice the Neural Index strength indicator was already picking up on weakness here when the market was making new highs. So, that’s exactly the type of real world divergence we look for and not use these conventional indicators. We want indicators that have little to no lag at all. And I would argue that there’s zero lag on that Neural Index strength indicator. Again, it doesn’t just give you a green or a red. It gives you a slope of that and it’s showing whether this is strong or not.
So, when we look at the market rising here and the slope of that rising up here with it, when this stops after a bar like that, I very seldom will continue to buy when I see this because as you can see, we’ve got a very early warning sign that this was getting ready to turn lower. So, when we combine that with that weekly opening price, this is the outcome. Now, to make matters worse for the Euro, we have an MA diff cross with the Neural Index. Some of the guys in the VantagePoint live training room, they call this death cross. I love that analogy, guys. I think that’s a very cool analogy.
Euro versus U.S. Dollar
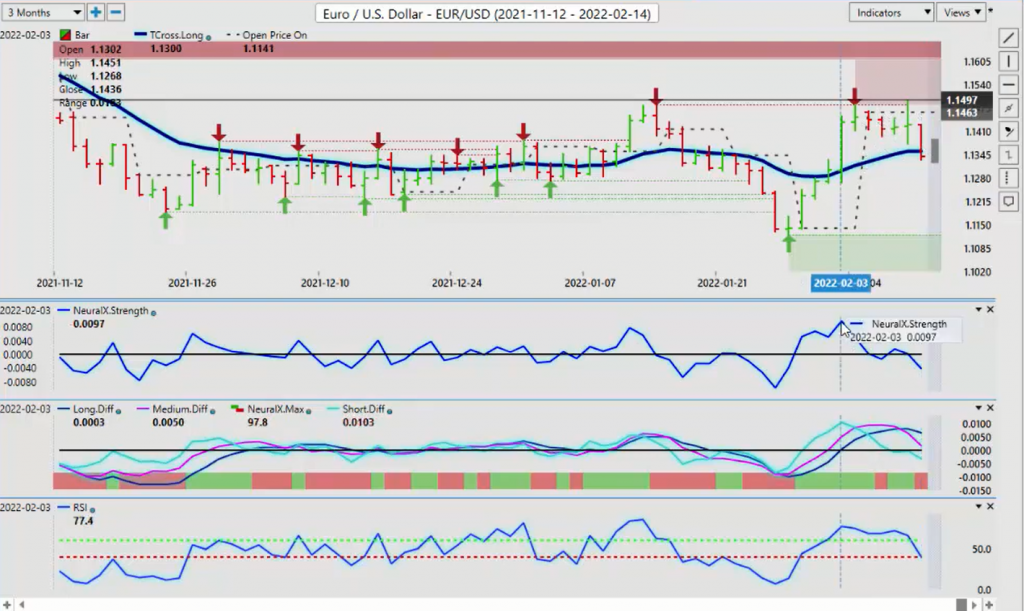
Now, the Euro does have a strong correlation to gold and this tells me that the move in gold and potentially the move and the dollar, even with the seasonality is not so much an intermarket correlation but a risk off scenario based on Russia and Ukraine.
So, again, we’ll monitor this but our T cross long is $113.54 but the main level you really want to watch here is $113.70, the yearly opening price. If we stay below that then the Euro is likely headed towards the $112 area. And right now, based on the forecast in the VantagePoint software, I would say that there’s a very, very strong possibility that, that will be the outcome by the week-end.
U.S. Dollar versus Swiss Franc
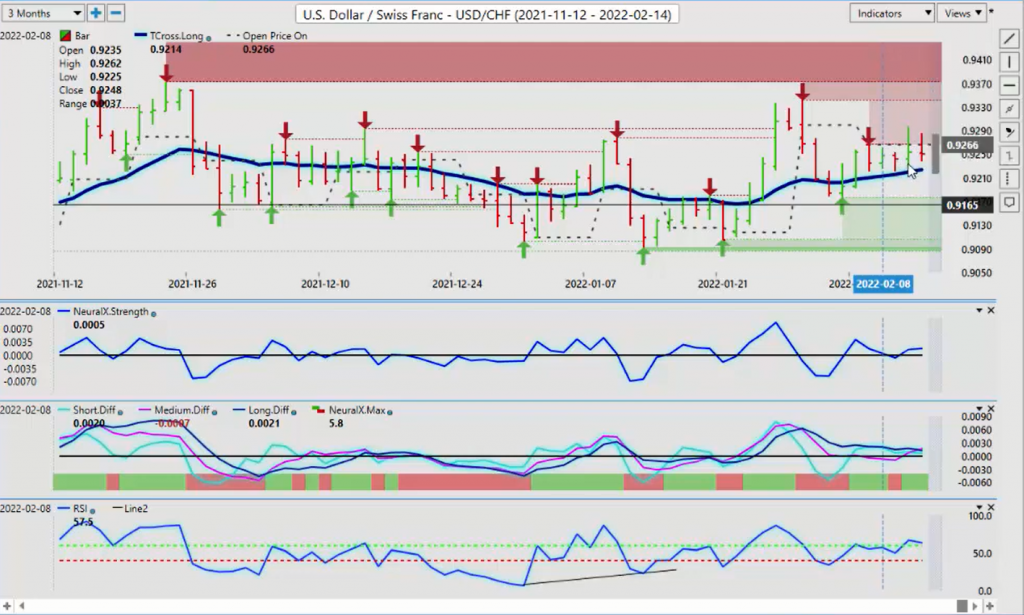
The US Swiss Franc, again, making its move. It’s holding above here but as you can see, there’s our weekly opening price from last Monday. Then we retrace on Tuesday back within a matter of 15 to 20 pips to the weekly opening price. And then down we go, again. The CPI caused some volatility but ultimately, it came back off of this. But the market again remains trapped between the weekly opening price and the T cross long.
So, what we will continue to monitor is the additional VP indicators. We have our medium term crossing our long term predicted difference with the Neural Index. The predicted RSI above 60 but the angle of the Neural X strength, that’s the one you want to keep an eye on. We’re above the zero but it’s kind of flat, slightly pointing up but the Swiss Frank does tend to follow gold like the Japanese Yen. So, be cautious but my argument would be, we would still be long while above that very important T cross long at $92.25. When we look at the US Swiss Franc with the amount of time I have, a slightly deeper dive here. We would look at that yearly opening price and say, “Okay. Well, where are we in relation to that?”
This is indisputably bullish on the year. So, one could argue that if you’re going long here, all stops must be below $91.09.
British Pound versus U.S. Dollar
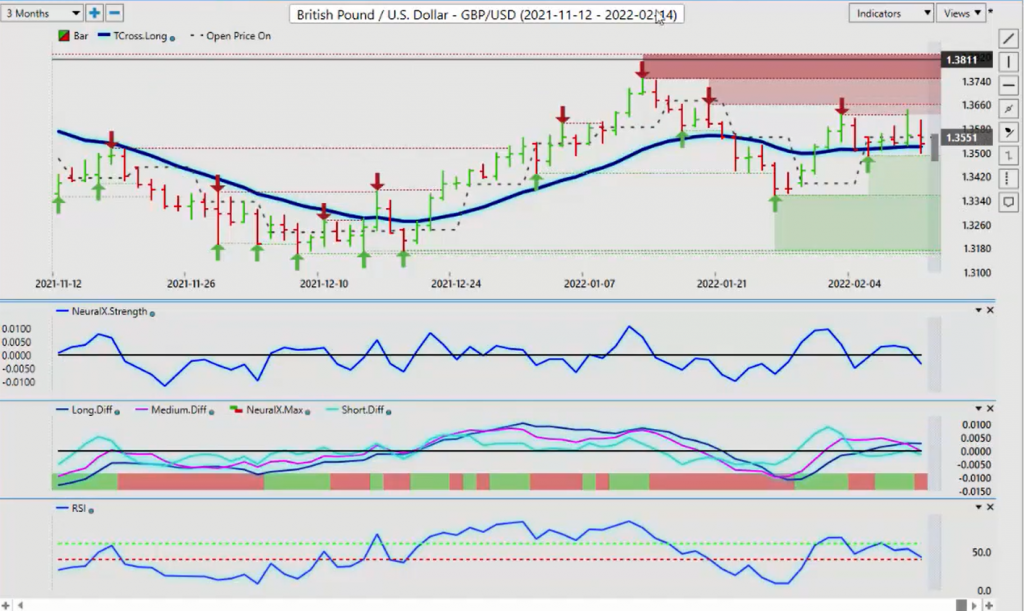
Now, with the Pound dollar, it’s struggled along the weekly opening price the entire week. With the VantagePoint T cross long, we can see the kind of value that this particular indicator offers because whether you’re a bull or a bear, there’s enough meat on the bone here for both of you. When I look at this, we’re hitting into the weekly opening price, which is a sell but it’s also been a buy off the VantagePoint T cross long. And then again, we can use our predicted highs and predicted lows but this signal is now becoming far more ominous here, guys. When we push these together and we use this in a checklist like you’ve seen me do in the VP room.
We have our verified resistance up here. We have remained below the weekly opening price pressuring the T cross long but now we have our Neural Index. The slope of that Neural Index strength indicator is sloping down. Our MA diff cross is crossed to the downside. Our Neural Index itself is in agreement. My only concern is we’re lacking momentum here. So, that momentum may actually show itself on Monday or Tuesday of next week. So, again, combining quality indicators, guys. Not quantity. Quality indicators, a setup that repeats itself month after month. And when we look at these repetitive setups, this is where we make our money. Not on big, massive trending moves. If we can catch those big moves, that’s fantastic but the market is only trending 20% of the time. 80% of the time, it’s just making the donuts here, guys. Going to work and making the donuts. Remember that Dunkin’ Donuts commercial? Kind of a funny analogy but it is like that.
So, we’ll continue to monitor this level but if we lose $135.19, I suspect there will be a significant drop.
U.S. Dollar versus Canadian Dollar
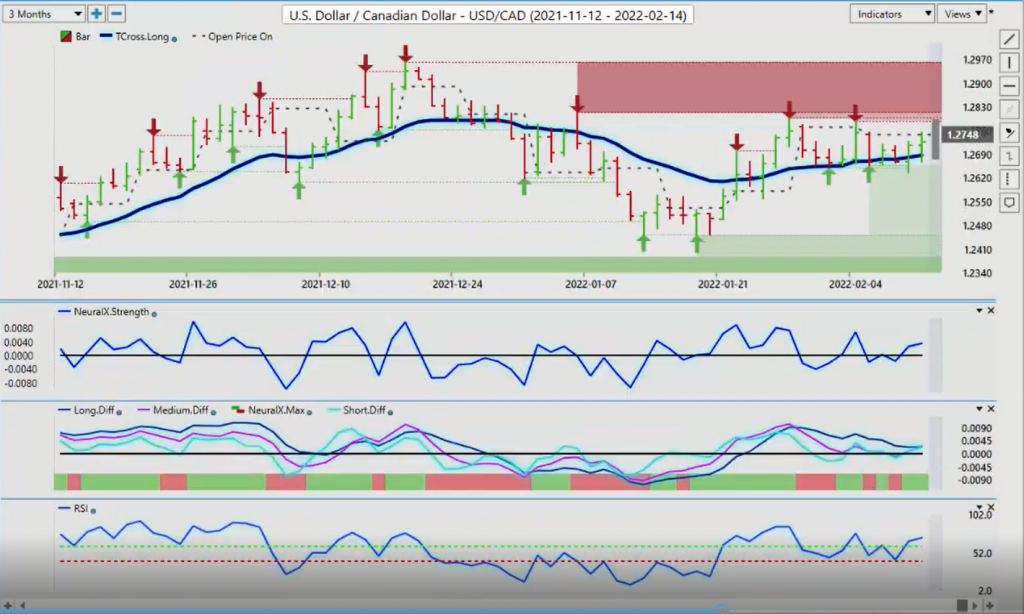
Now, with the US Canadian pair, the US Canadian pair may get some relief with oil prices and it may not just break out to the upside but the Canadian dollar much like the Aussie and the Kiwi are very prone to equity based moves such as the indexes. The S&P crashes then it tends to take the CAD, the Aussie and the New Zealand with it. So, if there’s all out war here in the Ukraine, those three currencies are not going to fare well next week. The only one that will have a slight edge is this one, the Canadian dollar, and that is solely because of oil prices. So, once again, when we look at last week’s weekly opening price here, we want to make sure… I’ll just pull this up so everybody can see because again, this is an alternative strategy you can use with your VantagePoint software.
So, last week you can see that we start off the week and we go down. But again, that T cross long, there’s a long trade. Every single day, I had my clients buying off this level last week because until it breaks, it’s got to get below that T cross long. Now, if I go one step further, I can explain this even further by using this fantastic indicator in the VantagePoint software. Again, quality and not quantity of indicators. So, we look at this and I can very quickly look at the yearly opening price. So, when I look at the yearly opening price, not only do I have support using the T cross long, I also have very strong support using that yearly opening price at $126.30. So, I’ll respectfully submit that longs carry a bias here. And I’m really only looking for longs while we’re above $126.30 but I will certainly not dispute that we have significant resistance and we could have a short trade up here towards the $128 level.
But the indicators are slope of the Neural X strength and the Neural Index itself is up. Our predicted RSI is above the $60 level and we’re above the yearly opening price and the VantagePoint T cross long at $126.87. I suspect the market will pivot off this level at the beginning of the week. Now, as we look at the final two pairs, I’ll quickly run through those for everybody.
Australian Dollar versus U.S. Dollar
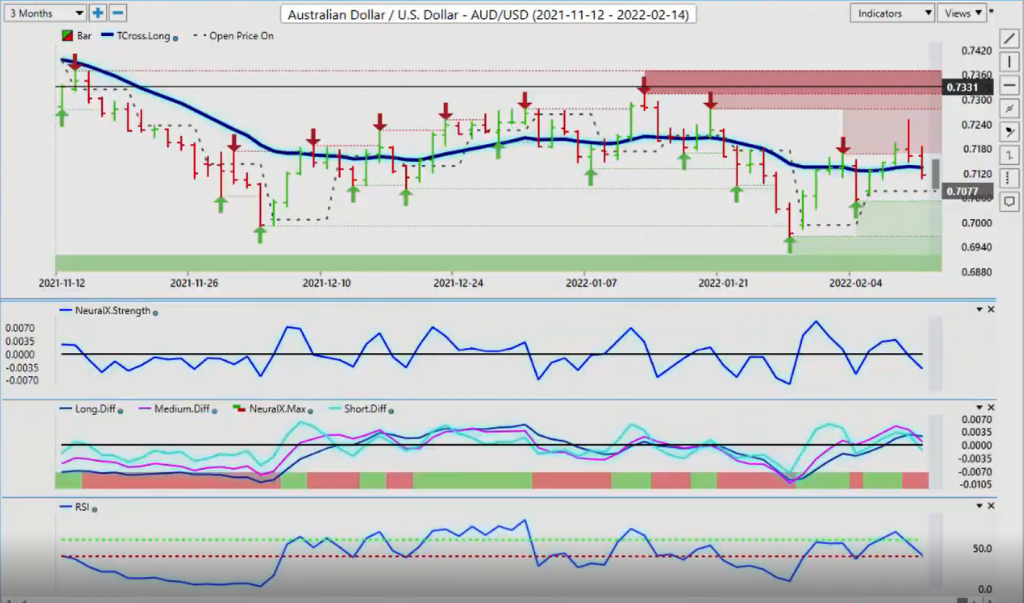
The Aussie and the New Zealand. Now, the Aussie again, stocks were doing okay this past week for a few days. And you can see that it’s almost identical. Tuesday and Wednesday, the Aussie did very well but here’s the science behind this, guys. This chart mirrors the S&P 500. The only slight difference is the Aussie had a bullish day on Monday where the S&P didn’t but on Tuesday, it was showing itself.
The Aussie broke above the T cross long. It accelerated higher on Wednesday. On Thursday after the CPI, this thing went both directions but closed bearish and then completely broke down on Friday. So, now we’ve closed below the T cross long at $71.34. But once again, when we peel the onion back, so to speak here, I love that terminology. I forget who said that to me. When we look at the yearly opening price, we can assess that again, that weekly opening price is the point in time. If I click on here, I’ve got all the information I need. The VantagePoint T cross long at $71.34 and the yearly opening price is $72.64. We have not been above that for any more than a day or two this entire calendar year. So, every time you hear somebody say how bullish the Aussie is, you can respond back and say, “Well, if it’s so bullish, why has it been negative the entire calendar year?”
So, again, it’s not about being right or wrong here, guys. It’s about doing complete thorough analysis. Don’t put all your eggs in one basket on one indicator. Quality of indicators and not quantity is a key thing. So, when we look at the slope of the Neural Index, this is a very important indicator that I bring in from time-to-time to always remind everybody using the VantagePoint software that this slope matters. And that is pointing down. It’s below the zero line. We’ve got an MA diff cross with the Neural Index.
New Zealand versus U.S. Dollar
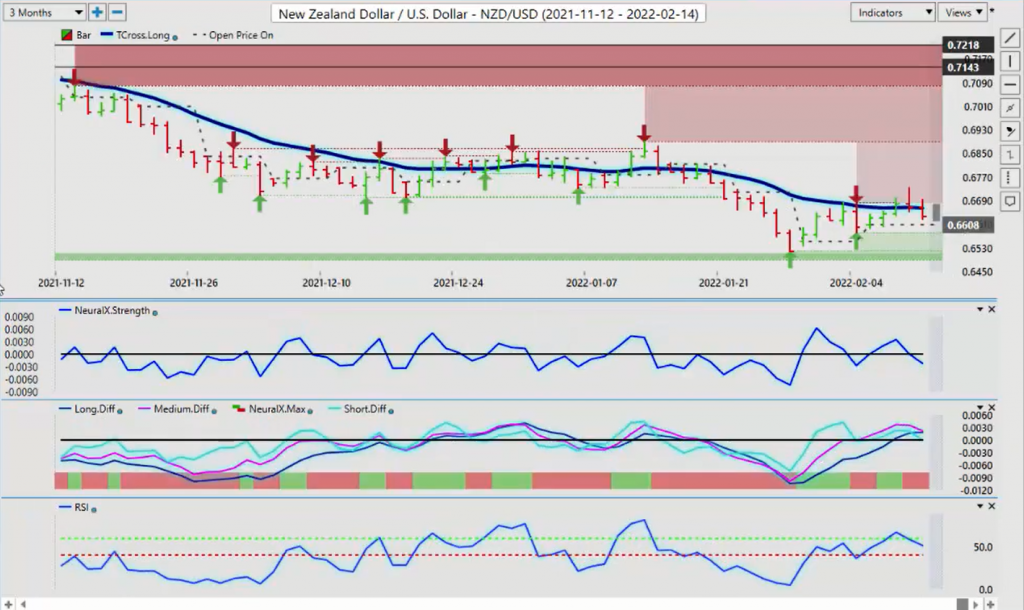
So, I would respectfully again, submit the Kiwi. We could go through the whole thing but the Kiwi is identical. Its signal is not crossed on the MA diff yet but it’s in progress. So, if the equity markets continue to crash and I will argue that a seasonality is coming up anyway. Within a month, the stocks are going to plummet anyway. So, this could just be an early start to that but when that S&P 500 drops, the Aussie will drop, New Zealand-US will drop and US-Canada will go higher. That’s what I’ve seen. So, again, it’s about understanding the intermarket correlations but the Russia Ukraine conflict, that’s obviously going to dictate what happens next week.
So, with that said, this is the VantagePoint AI Market Outlook for the week of February the 14th, 2022.