


Welcome to the Artificial Intelligence Outlook for Forex trading.
VIDEO TRANSCRIPT
U.S. Dollar Index
Hello, everyone, and welcome back. My name is Greg Firman, and this is the VantagePoint AI Market Outlook for the week of December the 13th, 2021. Now, to get started this week, we’re going to look at the Dollar index, the S&P 500, oil, Bitcoin, some of our major 4X pairs, all the major markets. Now, the indicators we’re going to be using this week, we’re going to be looking at the 47-week lookback. We’re using bars, not candles.
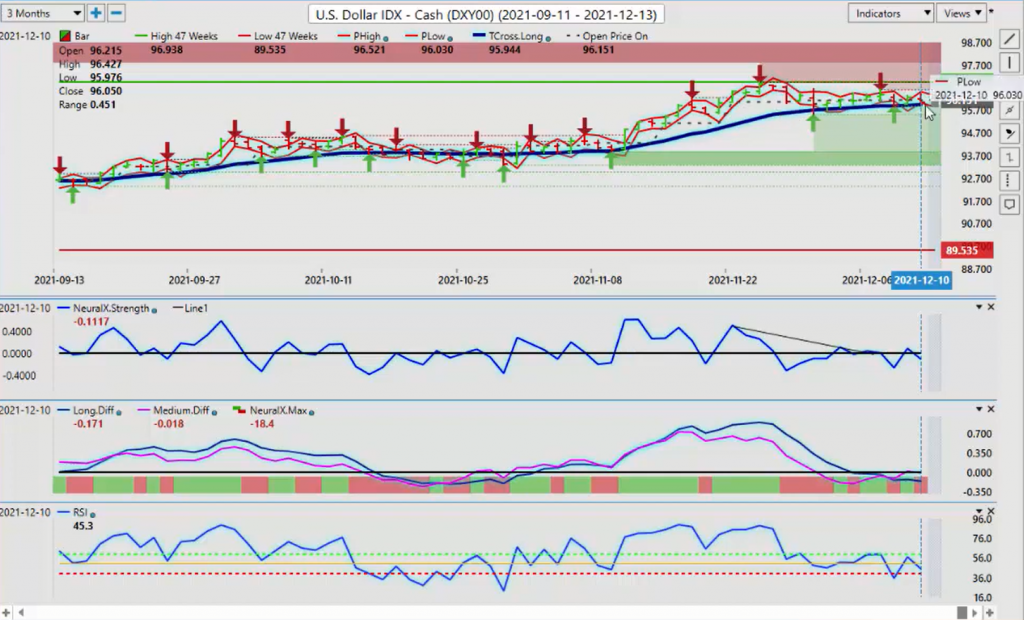
We’ve got our predicted short, medium and long-term differences, our neural index, our neural index strength, our point in time to review where we’ve been for the past week, our predicted high and predicted low. We’ve got our predicted RSI, our triple EMA cross, but this week, we’re going to modify it at again, and we are only going to use the TCross long so I can explain some of the positions, the major turning points in the market, and of course, the very popular verified support and resistance zones to identify those key retracement points. Now, when we look at the Dollar index, the Dollar index starting to move sideways, coming off an all-time high for the year, but again, not a lot of momentum here, guys. My viewpoint that I’ve warned everybody for at least a month now, that 75% of the time, the Dollar does not do well in the month of December, and this chart is starting to confirm that. Now, what we’re seeing is, again, we’ve got the TCross long, which is our major line in the sand.
The theory here, there’s two theories with the TCross long. The further we move away from it, the more likely it is we’re going to retrace to it. That’s a form of mean revision. That is a very popular strategy with hedge funds, high-net-worth individual, big banks, et cetera. The other thing we’re looking at here is using this as a key pivot level.
As you can see, the Dollar has been running along this pivot level of this TCross long for basically weeks now, so that key support going into next week has moved up to 95.94. Again, one of the key strategies that I’ve talked about here on Trader Planet on VantagePoint AI YouTube channel here, all these different sites that I’ve done over the years, and of course, the VantagePoint live training room, is that we’re looking for a breakdown for two days below this level before we commit to going short the Dollar against some of the major currencies. That same methodology will apply to all markets, which I’ll explain as we go along, but to take some of that confusion out, we’ve got a natural retracement. The further we move away from the blue line, we’re coming back, but we keep bouncing off of it. To start the week, our neural index strength is pointing down, as is our neural index.
Now, the RSI, very similar to accumulation distribution. When we look at the RSI, we’re looking for momentum on it. That’s the main thing we’re looking for. If it breaks above 60, it’s very, very bullish. You can see where this actually took place on the Dollar back here. We came back down close to the 40 line, but we didn’t break through.
We tried to break through right here, but again, we’re holding above that TCross long. That’s why we combine these indicators together. We did this in the VP training room this week, and we stayed long successfully, stayed long the Dollar against a number of currency pairs, but didn’t buy Dollars against other pairs, which I’ll explain as I move along. Right now, we are losing the 50 level, but we don’t have downward momentum, until the RSI breaks down below that 40 level. I don’t endorse or recommend using indicators for overbought or oversold.
We’re looking for momentum, because again, another strategy that the larger hedge funds use, at least the ones I’ve worked with, they’re using mean revision and they’re using momentum, and then key support and resistance levels with things like the verified zone. For starting the week, this is the level we need to hold, but we are turning bearish, in my respectful opinion, on the Dollar.
Gold
Now, when we look at gold, now gold usually makes a bit of a move in December, and I’m still waiting for that. Right now, we can see we’ve got our predicted differences trying to push above the zero line, but the RSI remains below the 40 level and below the 50 level. We need to get it above 50 and break above 60 to show some upside momentum, but again, we remain below that single TCross long.
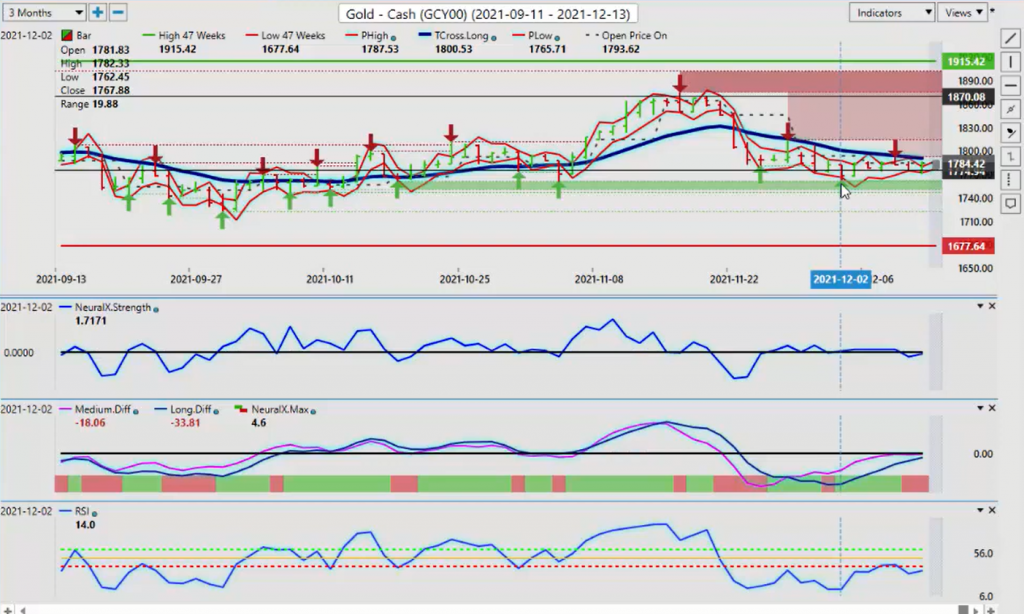
That’s our major level to start the week. We’re looking at 1790 with a slightly bullish signal, as long as we’re holding above the verified support low of 1762. Now, the fed was added again this week. I believe personally, the fed is behind the curve on these interest rates. The inflation is hot, hot, hot, and I’m sure it is in the other countries too, but in Canada, and what I’m seeing in the U.S., the inflation is very hot.
Right now, if we look at this, that’s our key level. We continued, as I’ve discussed repeatedly, we can straddle this. We can sell into the 1790 area, using the VantagePoint predicted high and predicted low, or we can straddle it and have a buy order ready to go around 1810, but we still have this very formidable resistance at 1813 that we must deal with. Again, anything, any move higher in gold at the current time is largely corrective in nature, as again, we remain smack-dab in the middle of this yearly range between 1915 and 1677.
S&P 500 Index
Now, with the equity markets I had discussed at length actually last week with the S&P 500, that I felt that it was going to turn around, and that the month of December is a good month for stocks, so when we look at that, I had discussed predominantly these verified zones and that what I had stated is that if we can get back up above the verified support low down in this 4524 area and hold above the weekly opening, then we have a shot at moving higher.
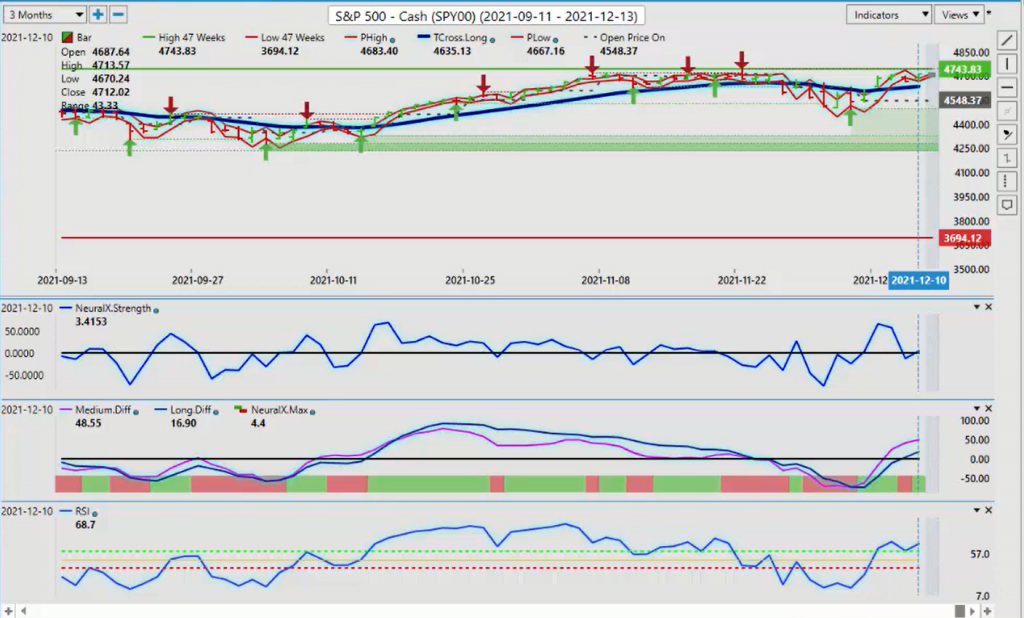
Now, another good example of that is a rising RSI. Getting above one thing is good, but you can see when the RSI breaks above the 60 level, that RSI becomes a very powerful indicator when combined with our TCross long, as soon as we overtake this and close above it, but I do prefer two days in a row to make sure that everything is true. Now, because we are, again, very close to these yearly tops, but predominantly stocks do do well in the month of December, even with the inflation numbers, they’re still holding gains. Now, our TCross long, 4635, were long while we hold above this particular level, and the indicators from VantagePoint, the short, medium and long-term indicators all state that we’re going higher. Now, what I had also stated in last week’s weekly outlook, which is again, an outlook, not a recap of something that already happened, we’re looking at something going forward.
Crude Oil
Now, oil did turn bullish for the week, but again, you can see that we were unable to break through this TCross long.
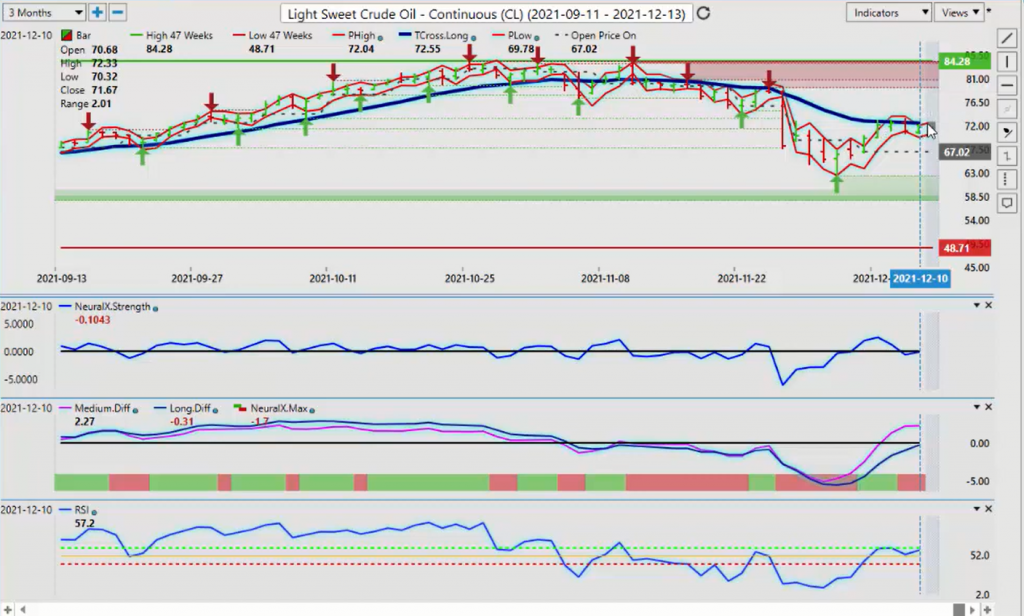
It basically hit a wall four days in a row. Now, if it hits it once, it’s an accident. If it hits it twice, well, maybe it’s a fluke, but four times in a row, I don’t think so, guys, and it stopped dead on this particular area. I had talked to a few people from the VantagePoint live training room that are using some of the additional powerful indicators in the VantagePoint software, like the AI Core, the Bull/Bear Gauge that we use on a regular basis in the live training room, and what I had stated was even if the bull/bear gauge is bullish, we’ve got to break through this. This is not subjective in any way.
It’s objective because we have a set plan. We need to close above this two days in a row. We don’t want to get faked out here, so again, as we look at this, if we can break through this, in my respectful opinion, it would likely be next week. We’ve got momentum building here, but we need the S&P 500 to continue to move higher, so for now, be very cautious around this 72.55, but again, this does look like the perfect condition for a straddle. If you still believe oil is going lower, you can short into the 72.55 area, or you can have buy limit orders, sitting just above that at, say for example, the 72.80, 73 mark, because once we break through here, we’re likely going to see some momentum building.
That’s where we use the RSI to tell us that if we can break through that 60 level, oil contracts could extend significantly higher.
Bitcoin
Now, if we look at Bitcoin, Bitcoin has had one heck of a run again here. We can see that based on the strategy that I’ve discussed, and we’ve done this in the VantagePoint live training room for months, if not, years now. I think the live training room started in 2018, so we can see this big move in Bitcoin after we broke above the TCross long following this strategy. We’ve moved all the way up to an all-time high on November the 10th.
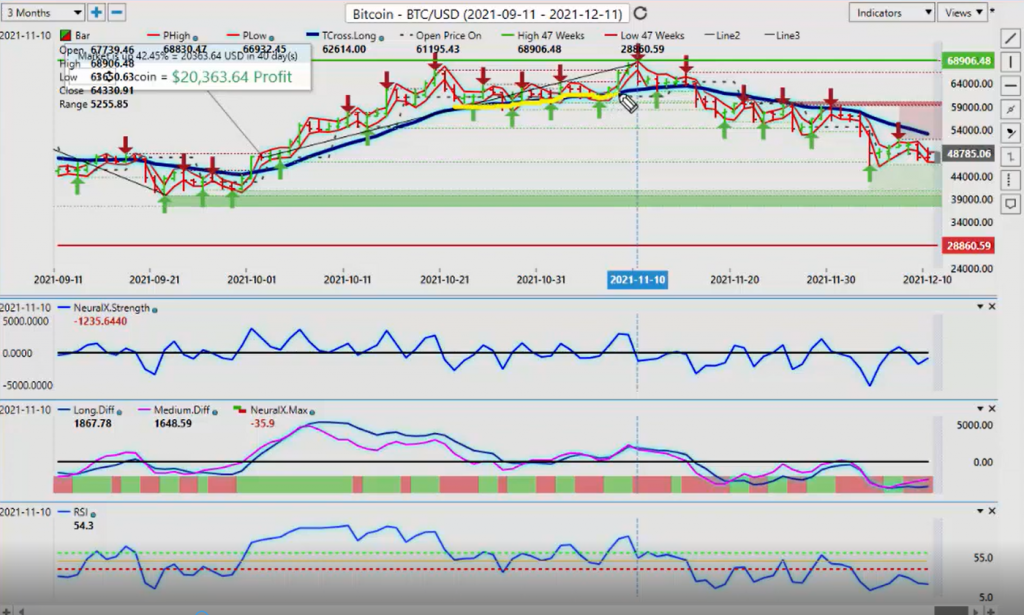
Staying long until remember the 10th is clearly the better play. It was a very, very strong play, but what I want to point out here too, that we’ve worked on in the VantagePoint live training room the last several months is that again, we apply the same strategy. Here, you can see that the VantagePoint predicted low and the TCross long is basically for this entire time, between October and November, has been holding, so essentially, 13 of the 16 days we had a buy signal off of that TCross long using the VantagePoint predicted low, and then ultimately, we were rewarded with a breakout of this range between approximately 59,000 and 64,000, breaking all the way up to just under the 69,000 mark, which has basically doubled this range during this period between October and November, so an excellent retracement point to the TCross long. We’ve been buying here, again, 13 of the 16 days. Very profitable, but to be clear, the turning point when we look at it was right here.
What we look for is, again, that two-day rule in the VantagePoint software, where this is the first day we closed below the TCross long two days in a row. This section right in here, we naturally then had a retracement back to the high of 60,000, and we’ve pulled lower from there. Now, we’ve come back and forth up against this … We keep like a moth to a flame. We keep retracing back to that TCross long, but in last week’s presentation, I actually called a long trade.
While I was doing the presentation, we had a real wild ride last Saturday, and I stated in real time, because you can see when I posted the video on Saturday morning, and I had a very strong verified support low. I had actually two of them, where I recommended going long, and I actually did go long, which is about 47,000. We went down to the low of approximately 46,300 and it bounced. Now, I will speak to what actually happened with this. I’m not sure what happened with Coinbase, guys, and what I would recommend, that if you were stopped out below 46,300 all of my regulated trading platforms, and to be clear, I do not trade on Coinbase, I trade on the Futures and the CFD side.
I did not see, nor did the VantagePoint software. There was rumors that it went down to this additional level that I outlined last Saturday morning, which is down here at this 41,000 mark, but none of my trading platforms saw that price. This is the price that I saw. In my respectful opinion, it couldn’t have gone down to that price because my stop was at 44,000, so it would’ve been hit. There’s nothing in the VP software or in Barchart’s data, but there were rumors that it went lower than that.
I can’t speak to that, to confirm that because that’s not what I saw, but once again, when we identify something from an objective standpoint, this is where we want to stay long to, until we have the same thing that put us into this fantastic trade, allowed us to have 20 solid days of trading buying off of here, then the same thing that would put us into this is the same thing that would take us out. We would close below the VP TCross long two days in a row, and that would signal, “Okay, we’re going probably for a deeper corrective move,” but very often, this is what I see, is that we get the market being flushed out here, so basically, from where we bought it on Saturday morning, during the live presentation, and we look at what it did afterwards, it went up for basically four, five straight days. That’s not a bad, little trade for a Saturday morning. Now, again, I think that the markets are going to get very choppy, but for our quick, little buy off a very well-defined retracement point with the verified support zone, that led to a fantastic trade. Then, you can see money sneaking back out of this.
I don’t blame them one bit, guys. If you have this kind of volatility, like last Saturday, I would have no interest in it either, but again, Bitcoin has had some very strong retracements throughout the year, usually around the 40 to 50% mark, and we’re very close to that now. Again, we’ll be watching Bitcoin for a turnaround. I’ll suggest here that we’ve got our medium-term crossing our long-term predicted difference back to the upside. That’s telling me that the medium-term trend is weakening against this current short-term downtrend.
Euro versus U.S. Dollar
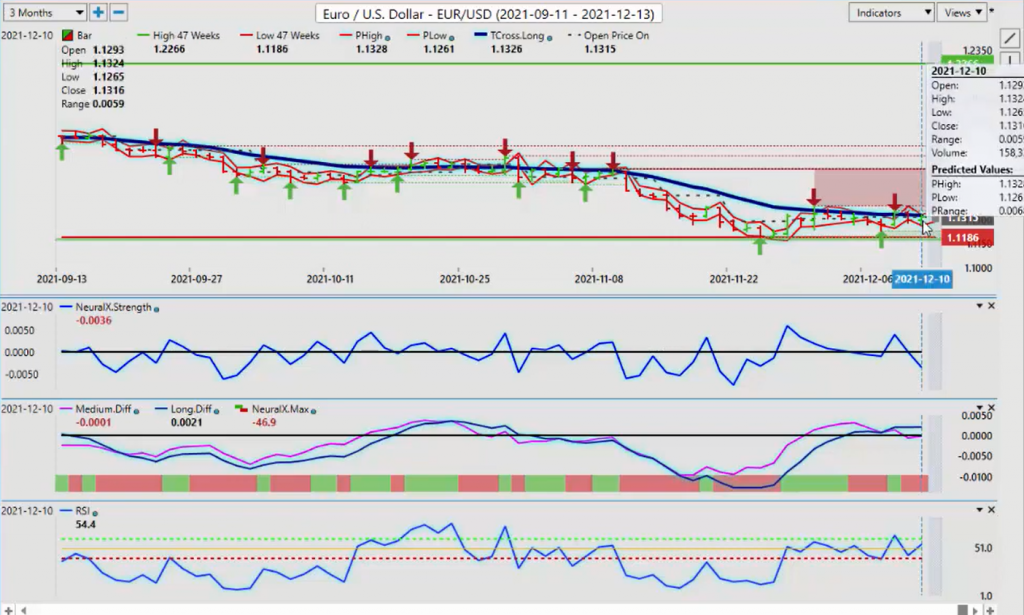
Now, as we go into some of our main 4X pairs for next week, once again, when we look at some of the … The main thing that I discuss each week is a form of naked trading that we do in the VantagePoint live training room. We look at intermarket correlations and we gauge the market off of that. Basically, what we’re saying is, or what I’m saying is, what I’ve taken is that the intermarket correlation is gold. I need gold to pop to the upside to push the Euro higher, but again, we can see that the Euro is pressuring this 18-day EMA, much like what it’s doing with the Dollar index, much like what I showed you it did with Bitcoin, so there was one, big final push, and then the market went in the opposite direction, but we can actually pinpoint. Like Bitcoin, I was able to pinpoint the exact point in time when to get out of those long trades, using that TCross long and the objective strategy that I’ve applied to it. When we look at this right now, this is suggesting that there is something going on with the Euro.
We are not breaking down below this line. Now, just on a quick side note there too, which I forgot to mention, that one of the leading indicators that warned me not to get short Bitcoin here, is again, you can see the false break. When the RSI tried to break through the 40 mark, it failed, and it started rising back up. It failed exactly on just a hair under the 40 level, but we did not get a two-day close below the former 18-day predicted moving average or the TCross long, so we’re looking for applying that same methodology upside down with the Euro. We need a break of this level.
Now, we have also very strong verified resistance, as I stated last week, all the way back up to 1.1382. I believe we have a shot at getting there because I believe that gold is going to have some kind of move to the upside before year-end, and if it does, that means the Dollar index is going down. We can see the Dollar index losing momentum right now, then that may be the push that the Euro needs to go up a little bit because we know when Dollar strength usually occurs, between January and mid to late March. What do they need to do? Well, they need to get everybody short the Euro before they run the stops, like they did on Bitcoin, like they did on the S&P.
Now, the other thing too, which when you look at intermarket correlations, the Euro doesn’t have a very strong correlation, positive correlation to the S&P 500, whereas Bitcoin right now has about an 85% positive correlation to the S&P, so if I know the S&P’s going higher, probably Bitcoin is, but that would tell me the Euro is not, so Euro, the Euro desperately needs the gold contracts to extend higher if we’re going to break through this area. I don’t think we’re there quite yet here, guys, but the predicted RSI is warning us that we could have some momentum building.
British Pound versus U.S. Dollar
Now, with the Pound/Dollar, the Pound/Dollar had a mixed week, but it still remained bearish as per last week’s outlook, because we’ve got a line in the sand here, a definitive point, not a point in time or saying, “Okay, two months later, it’s going to go higher.” This is a weekly outlook, guys, not a monthly or a six-month outlook or a quarterly outlook. It’s a weekly outlook, so we take it one week at a time.
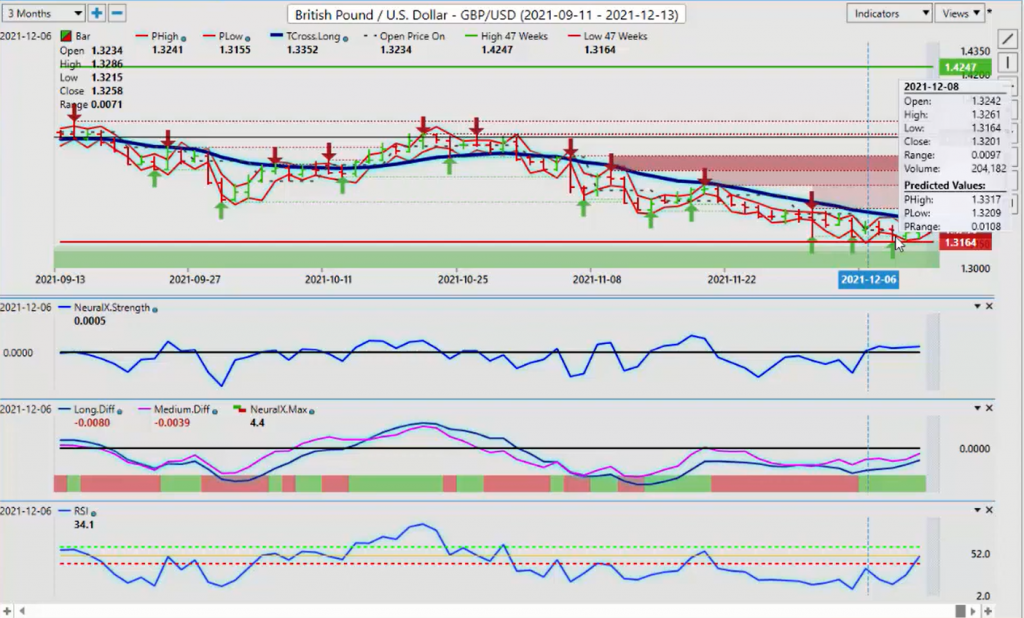
When I’m looking at this right now, my TCross long is 1.3309. If the Dollar weakness is pending, which I still believe it is, then straddling that TCross long is a very decent play by putting longs just above 1.3309. Now, again, I still would like to see a two-day close above that, but we’ve got our neural index strength is holding above the zero line. Our predicted differences are rising, and we’ve had a solid week of the neural index, so again, utilizing these VantagePoint predicted highs and predicted lows, like you saw me do in the live training room, and what I just showed you with Bitcoin on the other chart, very powerful setup, right? Very, very powerful setup, but this is inverse to that Bitcoin setup, because we’re below the TCross long.
Once we get above this, then maybe we’ve got something here, but remember, the Pound still is a lot of issues with Brexit, with COVID, but I think it’s going to come through it, and I’m going to be watching next week to see if we can overtake this TCross long at 1.3309, but we have a rising RSI, rising predicted difference, rising neural X strength indicator, and the neural index itself remains positive to finish the week. This tells me the Pound could be getting ready to make a move.
U.S. Dollar versus Japanese Yen
Now, the Dollar/Yen, the Dollar/Yen once again will respond to gold/Yen, and gold are very, very high correlations, so if gold does move higher, it will pull the Dollar/Yen currency pair down. Right now, we have spent this entire, well, almost two weeks here, guys, but remember, this is much like what I showed you with those Bitcoin contracts or the S&P. This is where we make our money, guys. When the market is consolidating, that’s where we make our money.
Big, strong, powerful, trending moves. They’re great if you’re on the right side of them, but most people are playing retracements, they’re saying, “Okay, it can’t go any higher.” Remember back in the S&P 500 years ago? Well, it literally is years ago when they said, “Okay. You heard it here today on CNBC. The S&P 500 is not going any higher.”
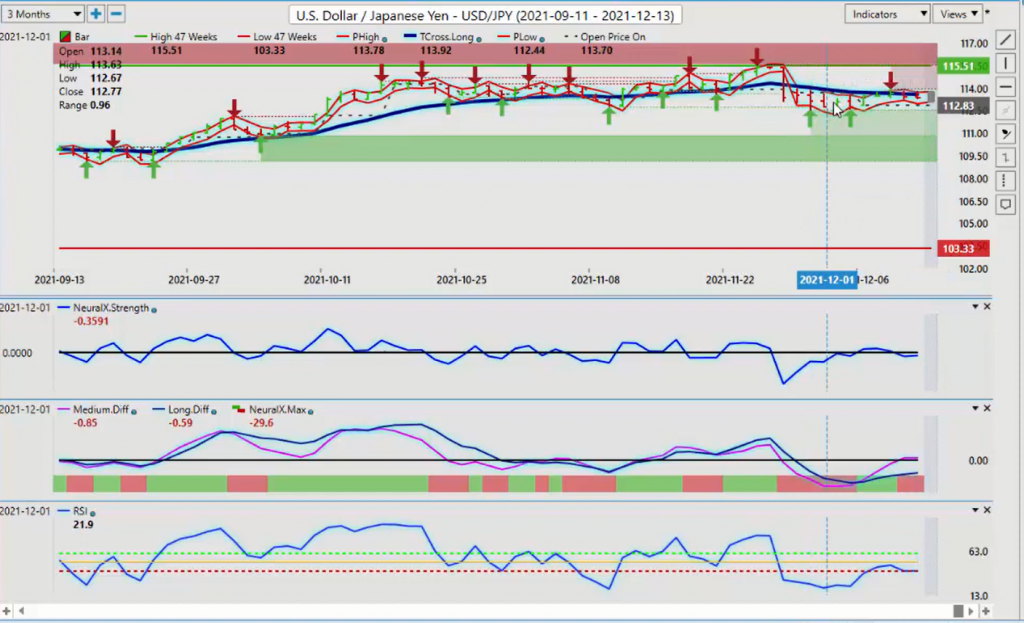
That was at 2,600, guys, so it’s doubled since then. Right now, once again, we’ve got to take that into consideration. We’ve got our TCross long here. This key level, if it can break to the upside, the TCross long, 113.59, but pressure is mounting here, so if we cannot break through this, then you’re going to have another short, but again, this consolidation mode provides very easy trading on a day-to-day basis for us, because we’re using that TCross long to shelter us, and then the VantagePoint predicted high to set our shorts. Again, if you look at the neural index during this period, much like Bitcoin, you can see that there’s far more red than there is green.
On Bitcoin, we had far more green than we did red, so we would take that. Now, our medium-term crossing our long-term predicted difference is still a thing here, guys, and the medium-term predicted difference is breaking higher, but again, if we’re looking at that predicted RSI, it remains sideways. Once again, if we’re looking at this right now, we have very little momentum. Very, very little momentum, but if this predicted RSI starts pointing and breaking back down to the downside, that could be the trigger. We’re looking for not only shorts on Dollar/Yen, but longs on gold contracts.
U.S. Dollar versus Canadian Dollar
Now, as we move into our three main currencies, which I’m going to, from now on, going to call them equity-based currencies, you’ll remember what I said in last week’s weekly outlook, and again, this is a form of naked trading. I was asked this week and said, “Well, how did I know?,” in the VantagePoint live training room, because we did this trade on Monday morning in the live room, and they said, “How did you know that it was going to go lower? What indicator told you it was going to go lower?” My response was that I understand the basis of intermarket correlations and that we can throw as many indicators as we want at something, but what I stated is that if the S&P 5 turns around, which I believe it will, then it’s going to drag the U.S./Canada down. It’s going to push Aussie/U.S. up.
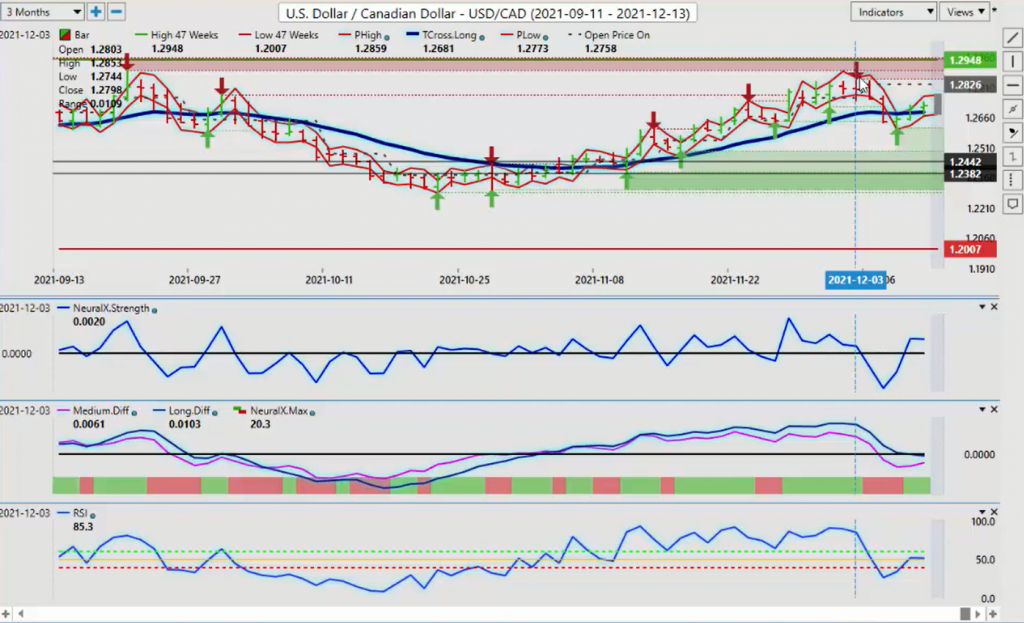
It’s going to push New Zealand/U.S. up. That’s the nature of the beast here, guys, but the Dollar still has the ability to make gains against the Euro and against the Swiss Franc and the Japanese Yen, because the Swiss Franc and the Japanese Yen, they don’t like it at all when the equities are strong and you’re in a risk-off environment, but a risk-on environment, the Canadian Dollar and the Aussie Dollar and the New Zealand Dollar, they really like that, so it was not a surprise to me that when the equity markets recovered, oil recovered, that pushed U.S./Canada down, but I will argue that the very powerful verified resistance zones, identifying these retracement points, using these zones, and then watching this intently on Monday, watching stock starting to rise, once that was confirmed on Tuesday, fire at will on shorts on U.S./Canada. If nothing else, we will play that mean revision theory that we’re coming back to the mean, while the mean was a considerable distance away at 1.2680, and we hit that. Now, you can see it’s starting to turn back up, so now we’ll see where we go with stocks next week, but I will say the exact same thing I did last week. If that S&P 500 cannot hold its gains, then U.S./Canada will go higher. Aussie/U.S. will go lower, New Zealand/U.S. will go lower because that’s the intermarket correlation.
Australian Dollar versus U.S. Dollar
Right now, we’ve lost momentum here on the upside. The predicted RSI is now in turn flat. 52.2, so it’s mildly bullish, right, but our neural index is turning possible. Watch the slopes of … Right now, the TCross long, the slope of that predicted moving average is dead flat, but we’ve got a pivot area, 1.2688. If we hold above that next week, then we go long.
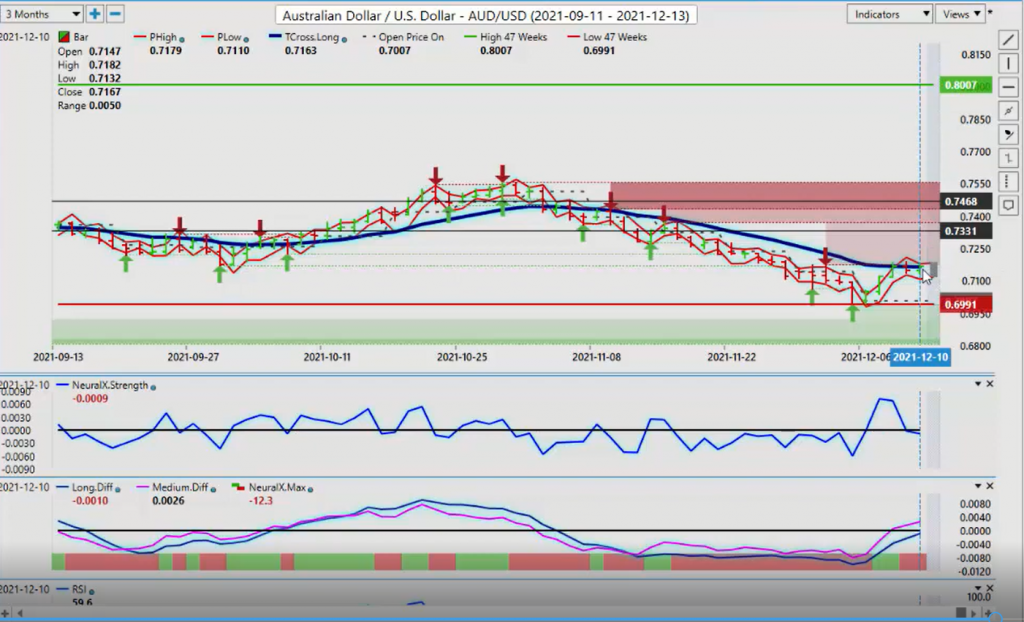
If we hold below that, then we go short, but that will be dictated by the S&P 500. The same exact methodology will apply to the additional payers that follow that, that would be your Aussie/U.S. and New Zealand/U.S., and you can see they’re sitting there, waiting at the breakout point. Now, the fact that we’re pressuring this is interesting. This was a very good long trade right off the start of the week. This line down here, this point in time is sitting at the weekly opening price.
We held above that, but again, it’s like it hit a brick wall here, just like with Bitcoin, hitting a brick wall, and the downside that had us stay long for all that time between the mid-October, early October till mid-November. It’s the same thing here, but the second we break above this, then that would tell me stocks are on the move. They’re going higher. The Dollar index is moving lower, so we will watch this area to begin the week, 0.7163. We are mildly bullish to start the week.
New Zealand Dollar versus U.S. Dollar
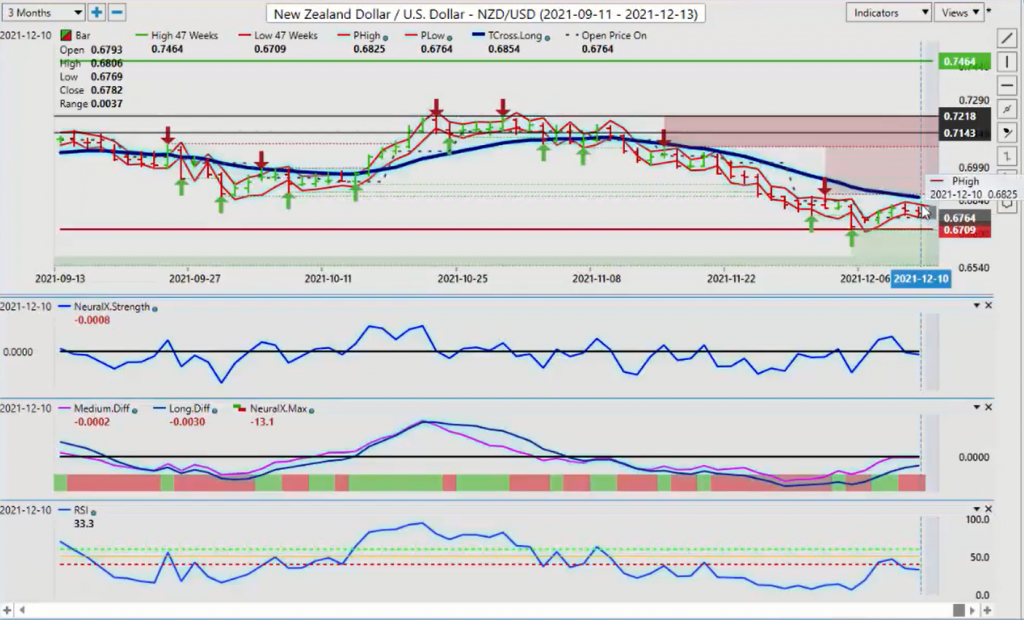
The same exact methodology would apply to New Zealand here, guys. When we look at New Zealand, actually New Zealand’s not even as strong. Aussie is clearly the stronger of these two, but you can see it, the market hugging that VantagePoint predicted high and the predicted low was very effective last week, so when we look at this, once again, to begin the week, we’re trying to get some kind of a buy signal here, but we’re just lacking momentum, so we need another big push here, guys in the stock market, and that can certainly help some of these specific currency pairs. With that said, this is the VantagePoint AI Market Outlook for the week of December the 13th, 2021.