


Welcome to the Artificial Intelligence Outlook for Forex trading.
VIDEO TRANSCRIPT
U.S. Dollar Index ($DXY)
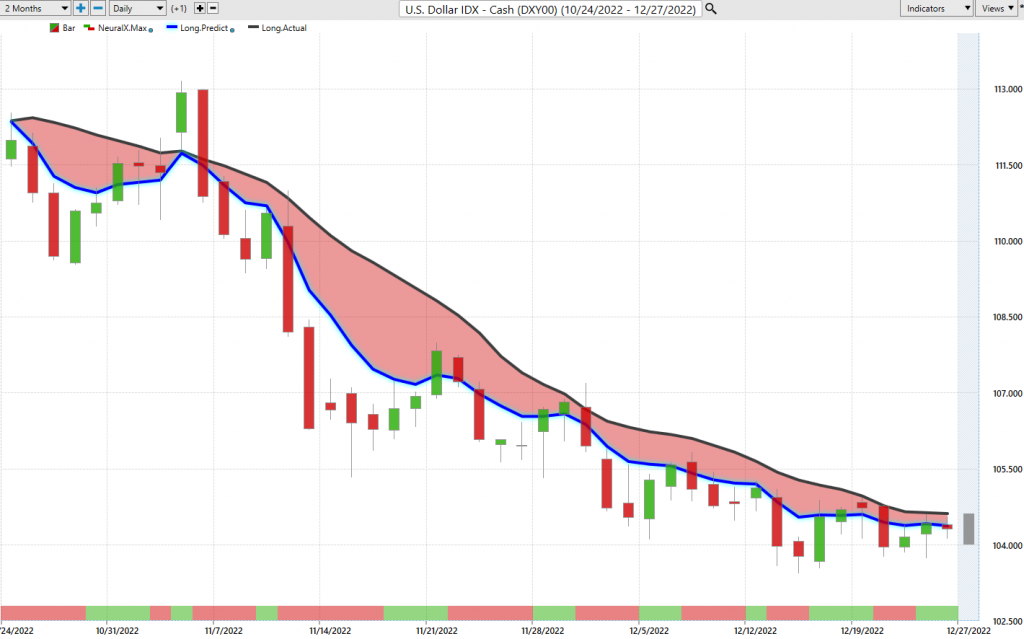
Hello everyone and welcome back. My name is Greg Firman and this is the Vantage Point AI market outlook for the week of December the 26th, 2022. Now, as one of the final outlooks for the calendar year, we can see that basically liquidity in the market is all but dried up. So we want to definitely limit our trade until we get into the first week of the new year when the banks are all back in. You’ve got volume coming back in. But where it currently stands right now, the dollar remains positive on the year, above its yearly opening price of 95,64. But below its weekly and its monthly opening price. The red is the monthly opening price. The greeny blue color is 104,87, the weekly opening price. But you can see that the Vantage point T-Cross long has slipped below the monthly opening price sometime ago, about a week ago.
So it’s still holding down at these particular levels, but we also have good, strong support down at the low of 103,44. Now, a number of pundits out there saying the dollar has got a top in, the dollar is done. That’s a half truth at best in my respectful opinion, because the dollar is a known seasonal pattern of strength between late January and usually mid to late March, even April, May of last year. This is a common thing. So I don’t think the dollar is necessarily done here and we still have a very aggressive Fed. But this is why we look at our VP indicators. Right now, our predicted differences are rising, and the dollar is still holding firmly above its yearly opening price. So when we look at the percentage move from 95,64, I think we’ve got up as high as 114 or so on the year.
So again, the dollar for two years in a row has again had another very strong year. Now, the indicators here going into the final week of the year, very slight advantage for dollar strength.
Gold
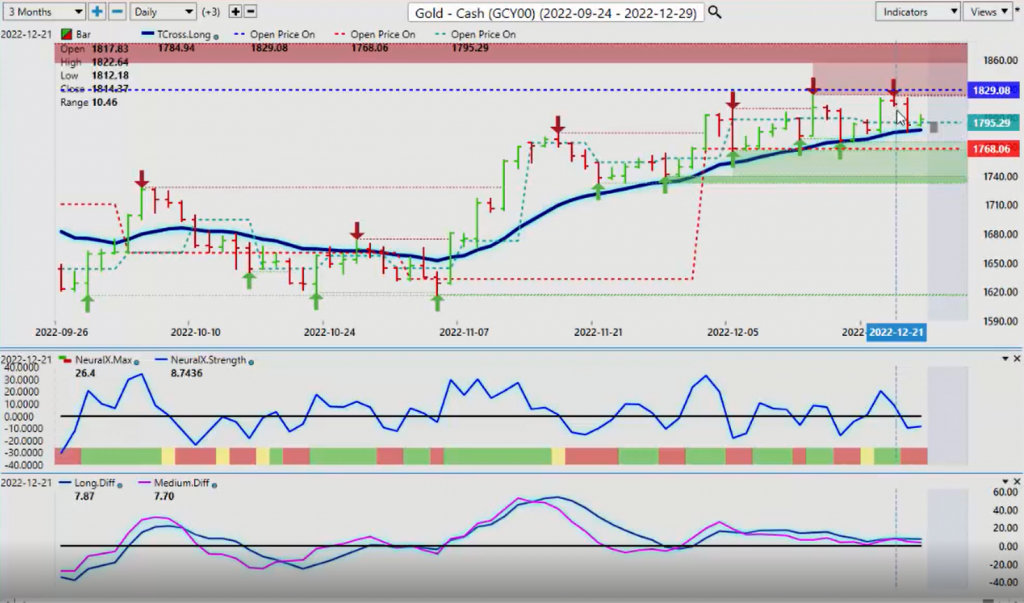
But we can’t ignore that we do have gold prices rising. Now gold again, approaching its yearly opening price, and as you can see that the sellers are just sitting there waiting to sell this thing. So the gold does remain bullish. You can see the original signal to buy gold back here. When we crossed our T-Cross long, we’ve had multiple replacements back to the T-Cross long, only for gold to extend higher.
The most recent was Thursday of this last week. So starting the week, we’re looking at gold is still positive on the month. 17,68, gold remains bullish, slightly bullish while above that particular level. However, we have the yearly opening price at 18,29, and gold has not been above that level for some time. Now, there’s far a lot more talk of recession fears, et cetera. But you can see that as the Fed started aggressively hiking rates that that sent gold considerably lower throughout the calendar year after March. Now again, this weakness in that a lot of that had to do with the dollar strength and the Fed.
So if the Fed decides he is going to back off a little bit here after the first quarter, then gold may be able to rise. But again, that’s left to be seen. So as we move into the final week of the year, we can assess that our T-Cross long 17 87, 56, we need to stay above this level if gold is to remain bullish. Now, if we’re buying that, I do, I would recommend that if you can afford so, that stops would be below the monthly opening prices. Because again, if it’s being forecasted that gold, the known seasonal pattern in gold, excuse me, that it does very well in the month of December. But all of the other things that normally do well in the month of December, the stock market, oil contracts, they’re not doing well. So this is not a normal calendar year.
So again, gold remains pressure to the upside as long as we stay above 17,87.
S&P 500 Index
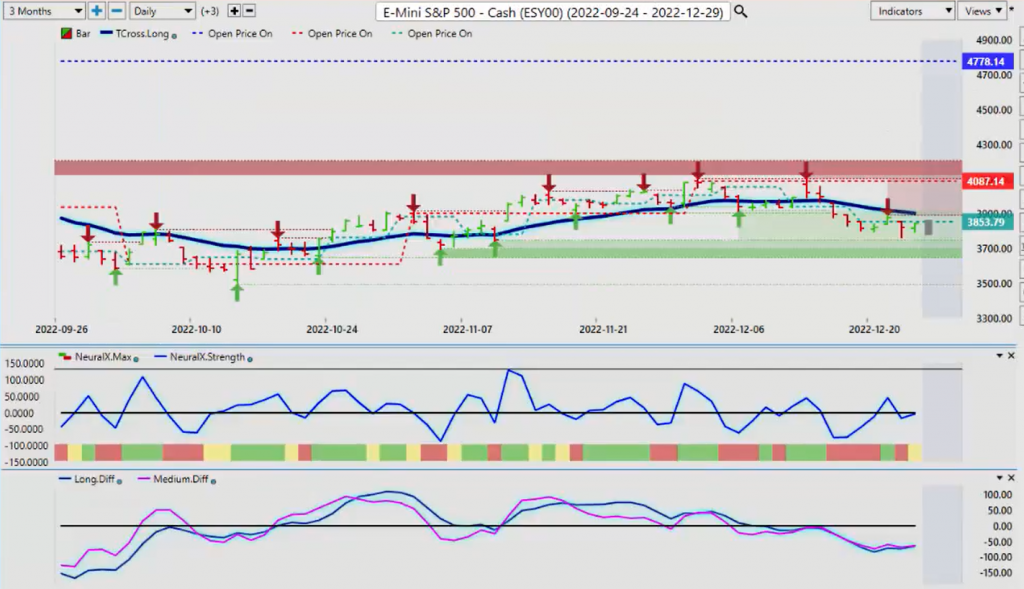
Now, as we look at the S&P 500, again, the media continues to try and push us towards a Santa Claus rally, but it’s just not happening. So again, the S&P, the Global Equity markets have had a terrible year. But it’s been this way since the beginning of the year and they keep trying to bait us in to buy this. But when we look at the indicators now, once again, we turned lower, the neural index, the neural index strength. Now there is still hope for a Santa Claus rally, but if you’re buying S&P 500, just remember hope isn’t a strategy guys. The inner markets are not overly supported. They haven’t been supported for stocks for the better part of the year.
So right now, looking at this, the S&P 500 is significantly down 20% on the year 47,78. We’re down on the month from 40 87, the monthly opening price, and we’re barely even able to get above its weekly opening price at 38,53. So the vantage point T-Cross long 39,02 shorts still carry the edge slightly while it’s below that level. But I can’t rule out that the media will keep spinning this into some kind of rally, so the fund managers can get their bonuses, but it’s looking worse and worse as we go forward.
Crude Oil
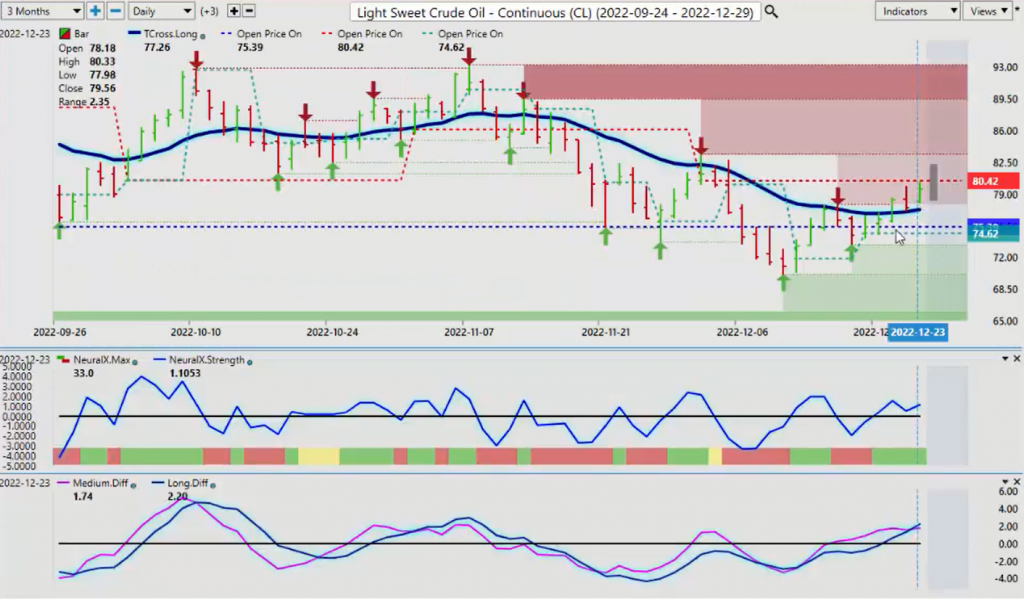
Now, as we look at some of the additional markets here, like sweet crude oil, once again, just unable to get any real traction. We keep retracing back to the vantage point T-Cross long and it’s pressured lower again. Now, our predicted differences are rising here, and our neural index strength is above the zero line.
So there is some hope that oil can move higher, but once again, we must clear the T-Cross long. Excuse me, I’ve got the wrong contract up there. I apologize. Oil did make a little bit of a move back above the T-Cross long, but you can see we’re getting caught up in the right near the monthly opening price. So if the oil contracts are going to fail, this is the level where it would likely fail. But oil, I will argue, is still bullish on the year. Unlike the stock market, you can see the price on open 75,39, the monthly 80 42. We’ve been down the entire month of December on oil. So it doesn’t give me a lot of hope that oil has any real significant upside going into the year end.
Bitcoin
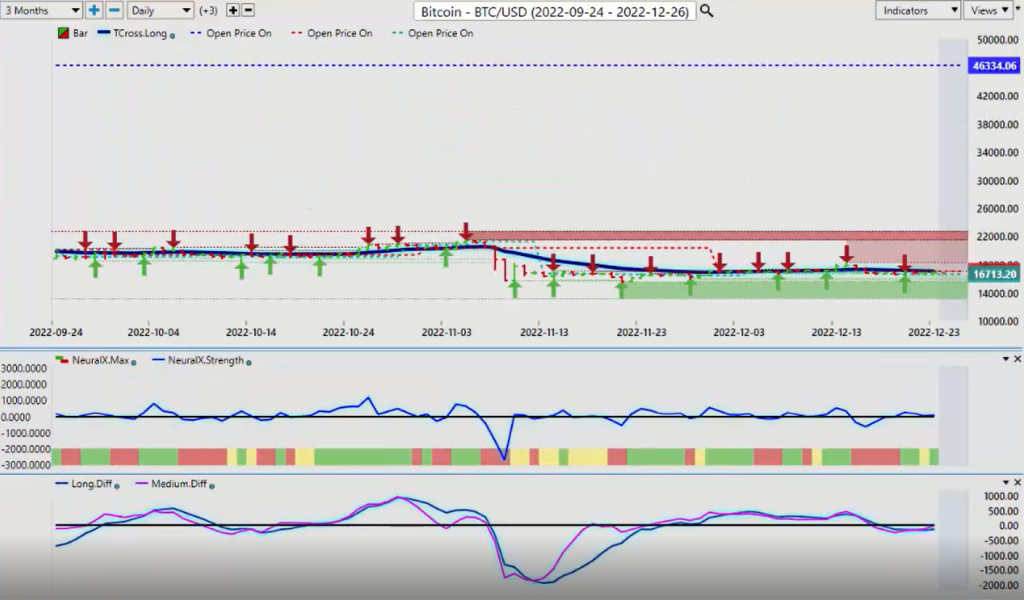
Now, as we come down here and we look at some of the additional markets, we definitely want to look at Bitcoin going into year end. Once again, just basically moving sideways, not really expecting much from Bitcoin into the year end, but again, the pundits that are saying that Bitcoin is going to 3000 or 6000, there is no evidence of that whatsoever. In actual fact, Bitcoin has come out of this whole FTX thing, has come out pretty good. But the one thing that we do need to understand is that Bitcoin and the global stock indexes are about 98% positively correlated. So every time the S$P has gone up, Bitcoin has gone up also. So we can’t lose sight of that. Bitcoin now officially a commodity as registered by the CFTCs. So once again, FTX was never a legitimate firm, in my respectful opinion. It wasn’t regulated properly, none of these things.
And remember, it’s all about blockchain is what we’re looking at here. So for now, Bitcoin basically just running completely sideways with a slightly bullish signal. Now if Bitcoin does move higher or we have a slightly bullish signal, then this tells me we could be looking still at a Santa Claus rally, but it has to get moving. Basically just moving sideways for the better part of the month ever since the scandal broke around the FTX.
Euro versus U.S. Dollar
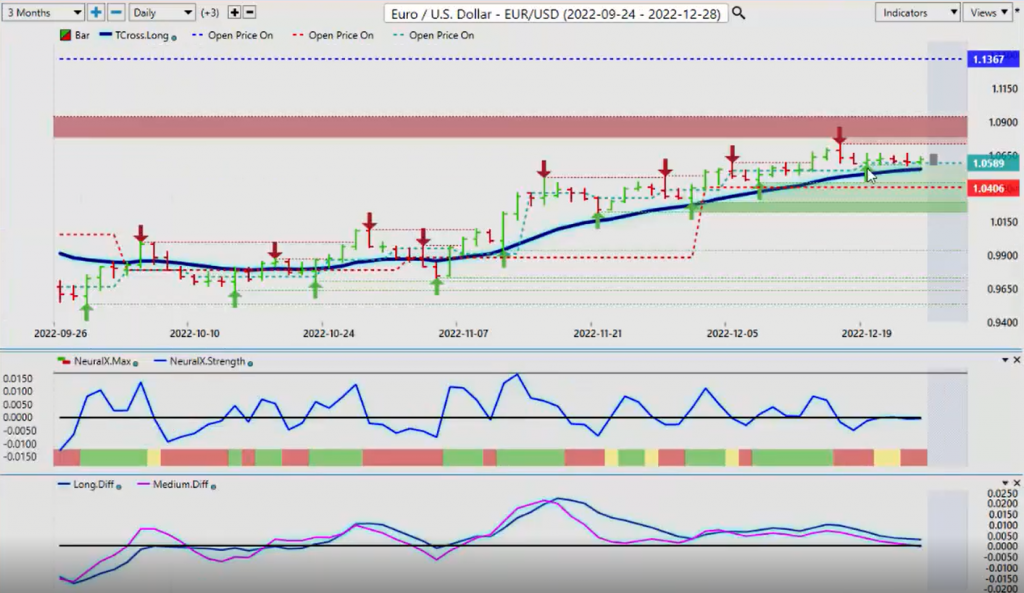
Now going into some of our main Forex pairs, the Euro, very mixed signal here. But the Euro remains still heavily down on the year one, 113,67 is where we opened back on January 1st, 2022.
We’ve slowly grinded our way back towards there, but not a lot of buyers up here above 107 at the current time. We’ve got a verified resistance high that’s coming in at about 117,35. That is likely going to be your resistance for the remainder of 2022, and then we’ll reassess in January what the markets look like. The euro as a slight advantage in 2023, but very slight, I don’t believe the dollar is done just yet. I believe the Fed is going to continue to hike regardless what any of the media pundits think or say that the Fed is ignoring them as he should. So again, we will see what he does in February, but for now, the softer dollar is helping the Euro.
But fundamentally very little has changed in Europe. So our T-Cross long 105, 43, that is your support for the remainder of the year. And our resistance, again is 107, 35. A break of either one of those two levels will signify the potential for the next move in the Euro currencies. The indicators here are in the Euro are actually down going into the Euro. The predicted differences are starting to move below the zero line, neural index strength is dead flat. But again, we have little to no liquidity in the market at this time.
U.S. Dollar versus Swiss Franc
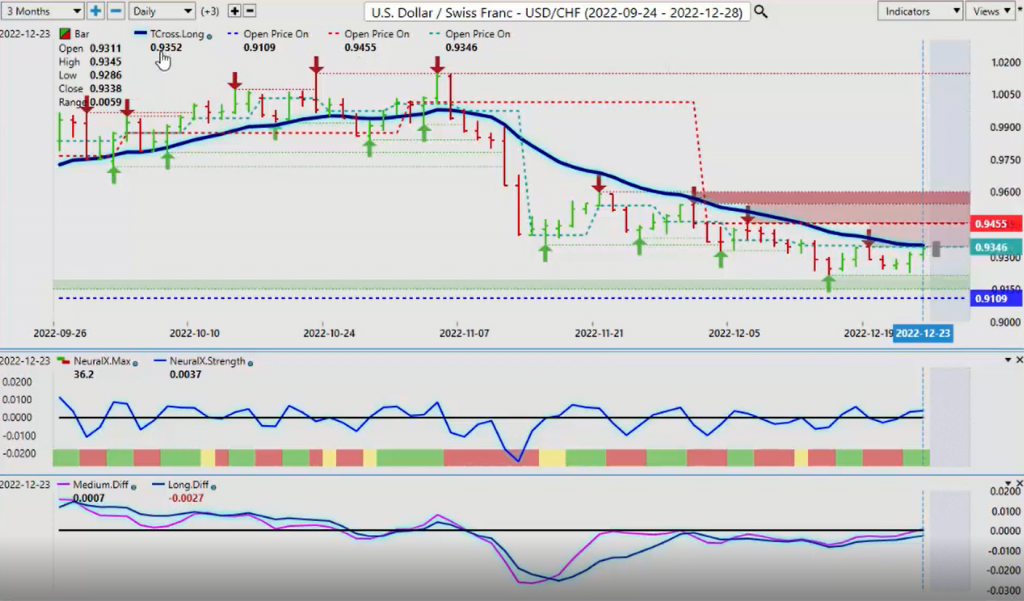
Now, the US Swiss Franc, again, I apologize, I had the oil chart up on that. I didn’t see it, luckily I caught it. But our T-Cross along there, that’s coming in at 93,52. Now, despite this dollar strength, what I find shocking to some degree is because I’ve been in these currency markets for well over 25 years. And usually I usually trade the US Swiss Franc more towards the 110, 115 area.
So even with all of this dollar strength, as you can see in 2000, all the Fed rate hikes and everything else, 102 is it. So really when you look at this congested resistance, it certainly doesn’t paint a pretty picture for the dollar, does it? Again, particularly against the Swiss Franc. Now again, what’s additionally very interesting is that with the Fed moving to 5%, the Swiss Franc is, or the Swiss National Bank, excuse me, is hiking, but not to any real extent. And it still carries this kind of strength. So right now, shorts carry the slight edge here, but remember, we have a period of known dollar strength coming up in the latter part of January through to about April, maybe even May. So there could be a good buying opportunity in Swiss Franc. The US Swiss Franc pair is still positive on the year, the yearly opening price, 91,09.
British Pound versus U.S. Dollar
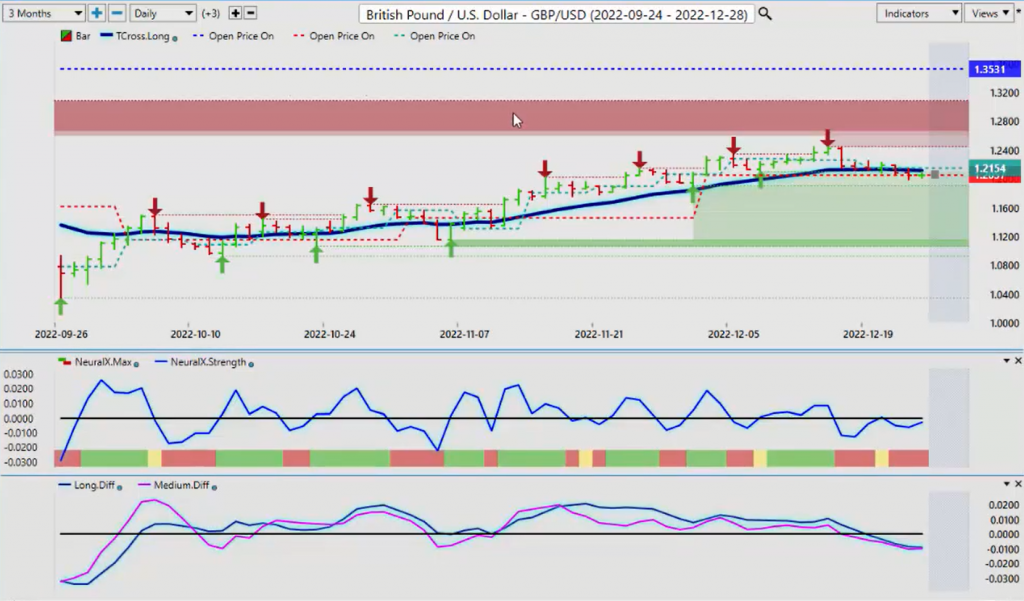
Now, as we look at some of the additional pairs, the British pound, US dollar, once again, unable to really keep any gains. But I think that what the media fails to tell people is the pound was never really bullish in the calendar year. The yearly opening price, 135,31, we were traced higher, but still negative on the year. Now we’re closing back down below the vantage point T-Cross long, severe recession fears coming in the UK not helping the currency. So once again, the T-Cross long 121,13, we need to get back up above this, if this has any chance of extending higher. But as you can see, the dollar doesn’t look anywhere near as bad as what the media tells us when we start breaking this down using the critical or core vantage point indicators. So we’ll continue to monitor this, but right now, it’s always important to understand what the primary trend actually is. And that is clearly on this pair, is down while we remain significantly below that yearly opening price.
U.S. Dollar versus Japanese Yen
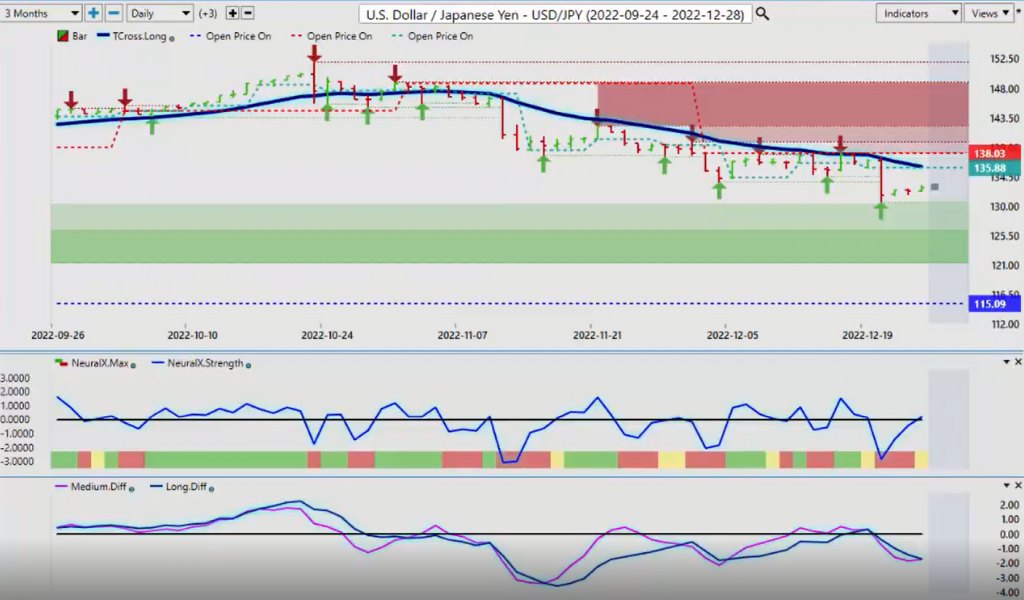
Now, as we look at the dollar yen, the dollar yen, quickly giving back what only could be assessed as unbelievable gains in 2022. But as you can see, it’s not holding them. And I’ve discussed this over the last several months that I believe that the yen is grossly undervalued at these levels, 152,50. Now more defense spending, I think North Korea is making Japan, the Bank of Japan nervous, the Japan government, excuse me, nervous. So they are increasing their defense spending, I think upwards of 20% now. So again, the yen preferred, the yen does very well in a risk-off scenario. And you can see that it is doing well, which again does not point to a Santa Claus rally extending equity markets. I’ll continue to monitor it, but right now we do have a little bit of a reversal signal early on. This is what a reversal signal looks like in the vantage point software.
We’ve got the neural index going from green to yellow, which is a caution sign, just like traffic lights. The neural index strength is strong upward momentum pointing up, and we’re above the zero line. The predicted difference short, the medium term is predicted difference is getting ready to cross the long term. That is a classic reversal signal. Now again, the reason why I use the word reversal or corrective move higher because we’re still below the T-Cross long 135,96. But by looking at these VP indicators, this is telling me that if nothing else, we’re going to retrace higher into year end, which again, could help stocks. But again, this is nothing more at the current time than an actual retracement. 115,09, the yearly opening price, the Yens still down considerably on the year.
U.S. Dollar versus Canadian Dollar
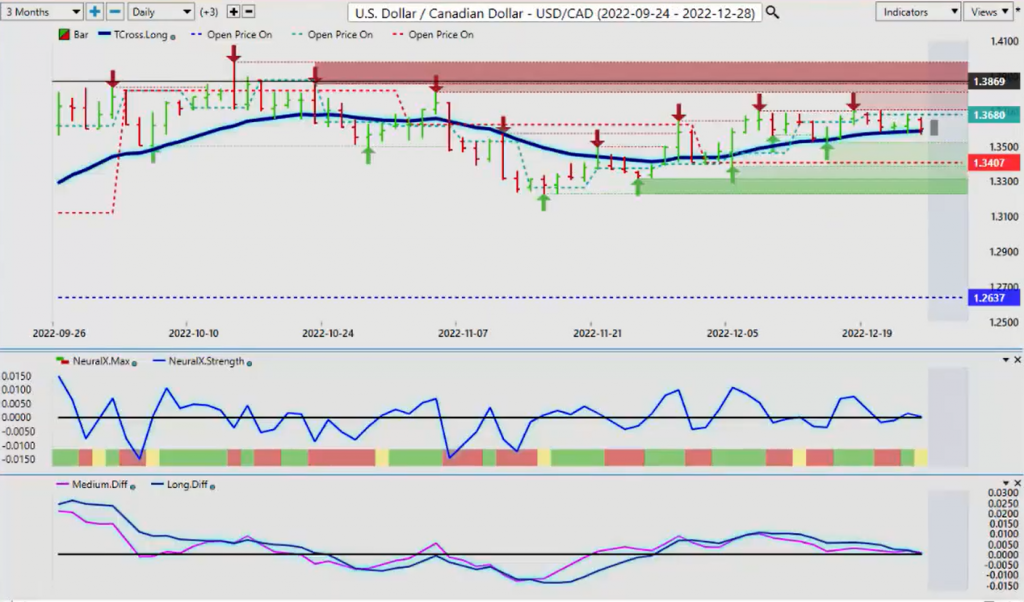
Now, as we look at some of our main equity-based currencies, which I would’ve called them, or I used to call them commodity-based currencies, I no longer call them that.
I actually call them stock currencies. So the US/CAD or the Canadian dollar, the Aussie, the New Zealand, these are all equity-based currencies. Now, if the stocks go up, these currencies strengthen, these currency or the global indexes start moving lower or stocks lower, these currencies do not do well against the US dollar. So right now, we’ve got significant resistance that has formed on this weekly opening price, and that’s coming in just a hair under the 137 level. Now, if stocks can rally, if oil can break above the T-Cross long and stay above it, continue to advance above its monthly opening price, that too will help the Canadian dollar. But right now, again, the T-Cross long 135,89, the monthly opening where we started the month on this pair, once again, normally in the month of December, the Canadian dollar, the Aussie dollar and the Kiwi do very well.
Australian Dollar versus U.S. Dollar
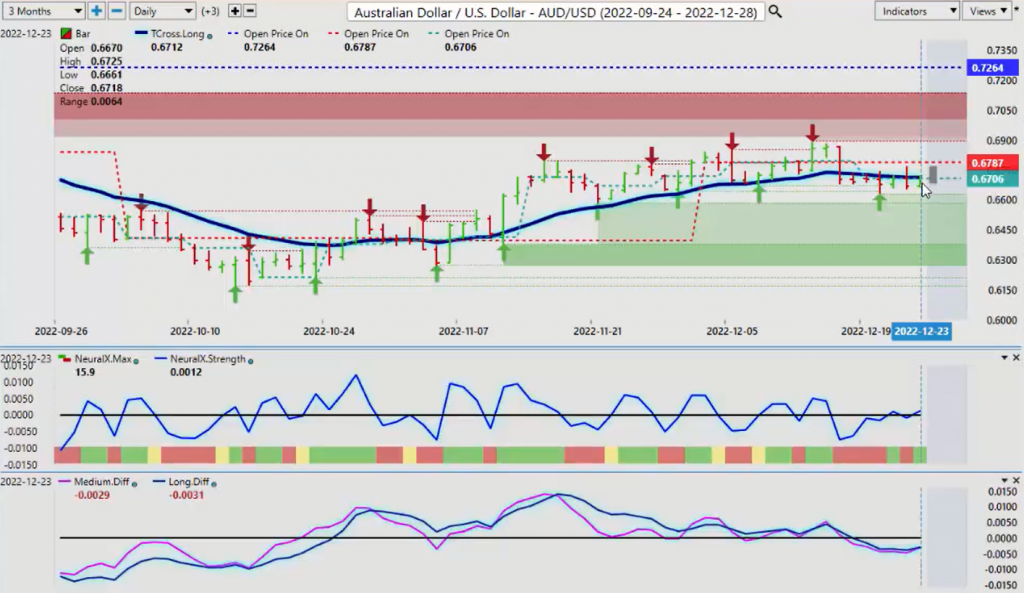
But that’s all based around the inner market correlation to the stock market. Stocks doing poorly, these currencies are doing poorly. When you look at the monthly opening price, it’s indisputable that this seasonality is not in play here. If it does start to move lower, well, I guess we can still profit from that, but it’s maybe a little too, maybe just a little too late in the game to get aggressive. But we will monitor this pair for 2023 because if we’re up this high, then it sets the bar extremely high for the US/CAD to hold at these particular levels. I would argue the same for the Aussie and the Kiwi. If stocks turn around, then these will turn around. But as you can see, when the S&P 500 breaks down, so does the Aussie, but once again, we’ve got a reversal signal.
Now, is this a leading indicator that stocks can move higher into year end? It’s entirely possible, guys. When we look at that, our neural index, our neural index strength and our medium term cross on our long term predicted difference in the opposite direction in which the market’s going. Because always remember this is an outlook, not a recap of something that’s already happened. So this is warning us that we could be getting ready to move higher on the Aussie. The Aussie has extremely heavy support down at 66,50 or just below 66,50, 66,29 at this verified support low. But we’re still below the yearly opening price. We’re still below the monthly opening price, and we’re still below closing the week on the weekly opening price, which is still, carries a bearish tone.
New Zealand Dollar versus U.S. Dollar
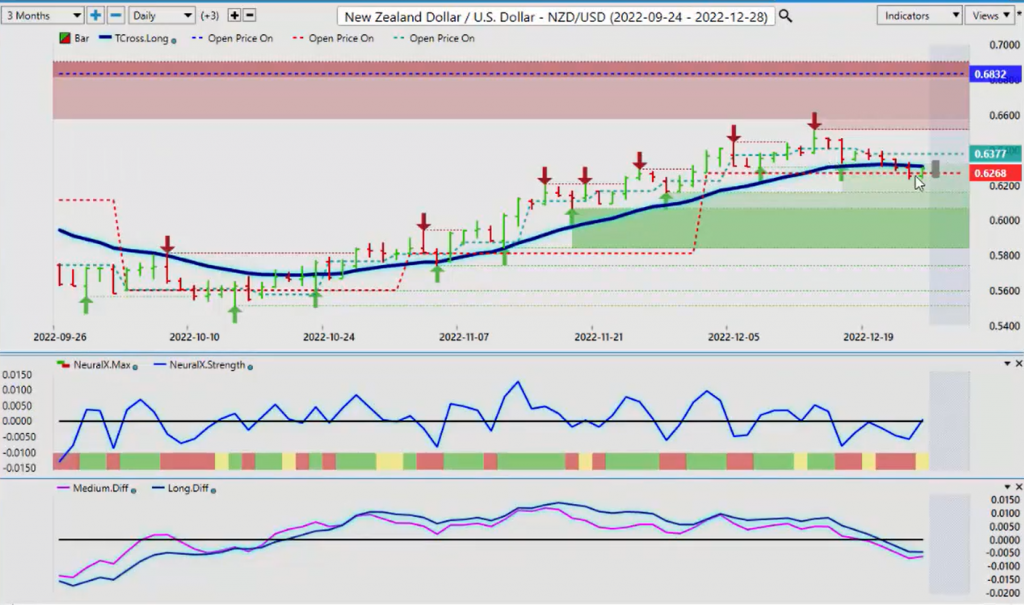
As does the New Zealand. You can see that we’re crossing over the T-Cross long, and now again, it’s trying to extend higher, but it can’t get past 63,07. But the same indicators that are warning me about the US/CAD and about Aussie US, the same warning here is what the Kiwi against the dollar. So if the stock market turns higher, you will see these pairs also gain strength. You’ll see the CAD, the Aussie, and the New Zealand, any move in the stock market that’s positive, they will immediately react. So what that says, said this is the vantage point AI market outlook for the week of December the 26th, 2022.