


Welcome to the Artificial Intelligence Outlook for Forex trading.
VIDEO TRANSCRIPT
U.S. Dollar Index
Hello everyone and welcome back, my name is Greg Ferman, and this is the VantagePoint AI market outlook for the week of December, the 20th, 2021. Now to get started this week, we’re going to begin where we always do with that very important us dollar, but dollar index but first, we’re going to look at the indicators in this week’s presentation. As we move into year-end, we’re looking at 47 weeks look back, we’re using bars, not candles. We’ve got our predicted short, medium and long-term differences along with our neural index. Our point in time predicted high and predicted low, our predicted RSI, our triple may cross that as you can see, I’ve modified and removed the shorter-term indicators to focus on the longer-term trends as we go into year-end important at this time of year. And of course the very popular, verified support and resistance zones.
Now, as we look at the dollar, the dollar had quite the recovery on Friday. However, my optimism remains guarded that the dollar will see further gains this year. Now, this the dollar gains or the recovery on Friday came from those fed about hiking rates. They’re suggesting now in a complete flip flop that they’re going to look as early as March to rate March or April, even, maybe even sooner for the first hike and up to three hikes in 2022, so that’s a big turnaround for the fed. The dollar is responded very well to those comments, but again we’re approaching the year, yearly highs, 96, 93. We’re closing the week, out this week at about 90, 96. We’re looking at the high of 96, 58, where we’re closing pretty much right on that at 96, 56. The current signal we can see is very mixed, our medium-term crossing our term predicted difference.
But we again, when we’re looking at supply and demand or accumulation distribution, an excellent way to use that is with the predicted RSI with a 60, 40 split. So we’re looking for momentum in this particular market or in any market for that particular matter. So when we look at the 60 level, the RSI has come down to this and we did not have that breakout to the downside. We’ve got a reverse check mark here, and now we’re breaking above the 60 line. But again, this is solely based in my respectful opinion, only on the comments from two fed members that are basically trying to get out in front of Jay Powell by suggesting that the hike, that he’s way be hide the curve, which is entirely possible but for now our key support level to begin the week, the T cross long, I have one predicted moving average only at this time of year on my charts.
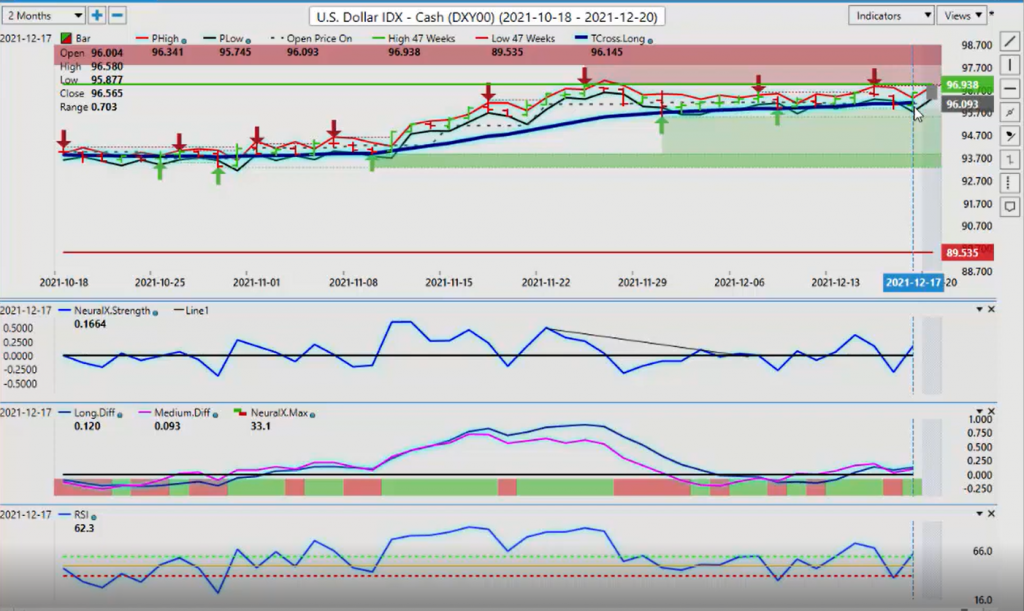
The theory here is that we’re above it, we’re long below it, we’re short and the further we move away from this critical VPT cross long, the likely it is we’re going to have a mean revision retracement. That is what I would be watching for to start the week, that level again, 96, 14, we have additional verified support zones that come down to 95, 51. I will respectfully submit that we would long the dollar until such time the dollar index breaks down below the VP level again at 96, 14, and the verified support low, which is coming in at approximately 96, 51.
Gold
Now with gold, when we look at the same thing here, we can identify that in that two day rule of crossing above that T cross long, that was completed on Friday, but then gold had a significant pullback off of this verified high of 18, 13.
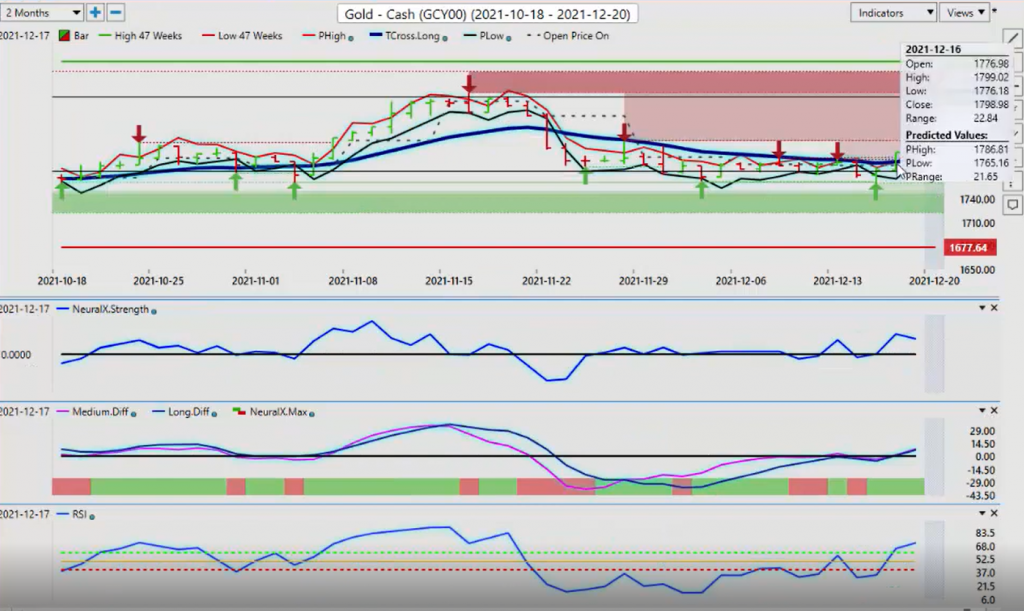
Now this pullback in my respectful opinion, again only was caused by those fed comments, so if that… If the market starts to forget about the comments from those fed members, then in the normal seasonality of things, gold would go up in the month of December. I haven’t seen a lot of demand for it, as you can see we’ve been holding below that T cross long, basically since we had this breakdown low below the T cross long at that time was 18, 29 and we’ve been unable to retake that level since. So again, I would be watching this level very closely, but to begin the week when we’re looking at the vantage point, predicted highs and predicted lows, we can see that the predicted low for Monday is 17, 94 and our T cross long 17, 89. So we combine… We always try and combine these predicted moving averages with a predicted high and predicted low.
So if you’re a gold bull, then the area you would focus around for the start of the trading week and for the bulk of the trading week for that matter is 17, 89 and again that predicted low is coming in at 17, 94. So it allows us to pinpoint a specific location to pick up lungs and if you are not on the long side of this trade and you don’t want to be that, then again, we have the opportunity to straddle this too by putting cell limit orders below the T cross long at 17, 89 at approximately say 17, 85 because if we break down below that, then gold obviously the bull move would be over based around us hiking rates more than originally anticipated. So these are the key levels we can see right now that our predicted differences are above the zero line.
Our neural index remain to the upside being green, predicted RSI, we’ve got momentum building to the upside. So the only thing that can derail this is gold rally right now is the fed.
S&P 500 Index
Now, when we look at stocks from the end of the week, the tough week for the stocks, they had a recovery but then they sold off again and we… And now we’re closing below that critical T cross long at 46, 46. Any time we have seen the S&P 500 sell off, it is usually fully recovered within a matter of days. My concern here is last week, using this point in time, I’m setting it to the weekly opening price and you can see the S&P 500 has remained below that weekly opening price for the entire week, so we’re going to start the week at the closing price of 46, 20.
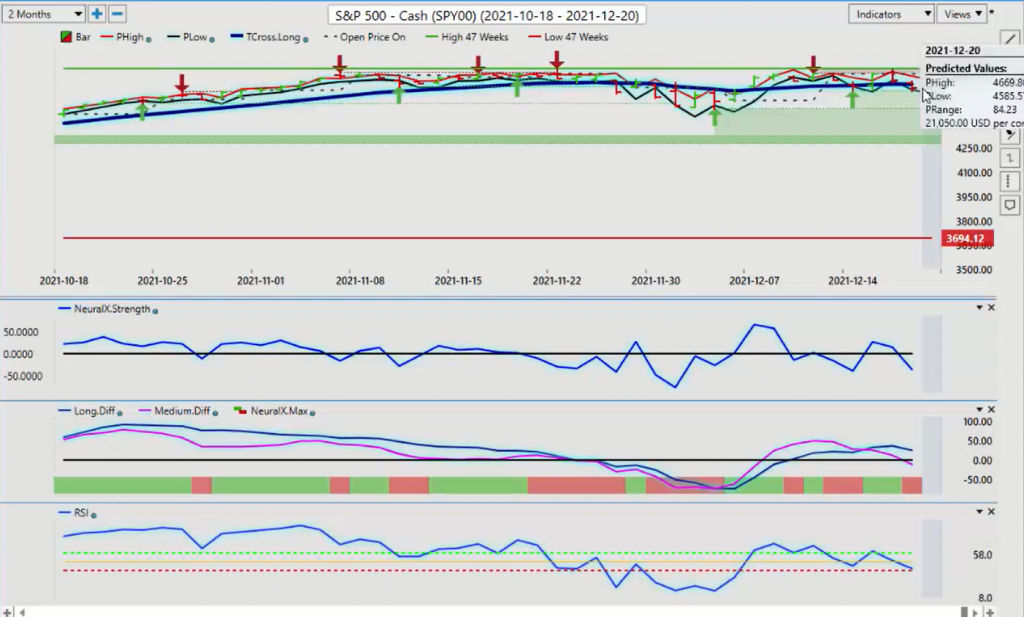
So that’s setting the bar rather low for shorts in my respectful opinion. I think the verified zones down here in the low of 44, 95, if we even get that low here guys, that will end up holding. Usually stocks are very strong going into the year end, but these new comments that we have to deal with the out of the federal reserve could change things a little bit. We can see that our neural index strength is pointing down our [MADiv 00:06:32] cross an excellent way to use this guys. You can see that this rep… The pink line presents the medium term crossover strength and the long term crossover strength. So when we use that in combination with the weekly outlook, you can see as we hit the weekly outlook, the medium term trend is weakening but again when we bring in a modified RSI indicator with a 60, 40 split, we are not looking for over bought and oversold signals with this type of indicator guys, we’re looking for momentum in the market.
So we’ll take note here that we’re sitting at 42, that… So even though the S&P 500 moved lower, we didn’t break down below that 60 level, so that’s telling me there isn’t a lot of downside momentum. So I would watch for [snap 00:07:18] move lower on Monday, and then the buying opportunity near the vantage point predicted low at 45, 80… Between 45, 85 and 44 95, I believe is a reasonable area to potentially look for longs.
Crude Oil
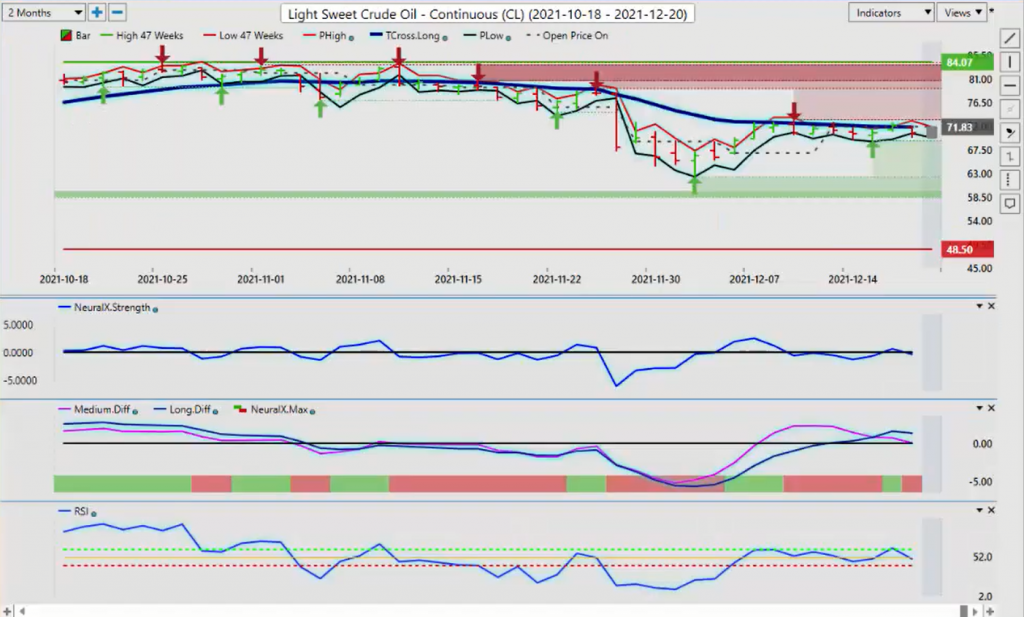
Now, let crude oil, again, following the stock market here very closely. We’re hugging this vantage point T cross long all week, that level again, that to start our trading week is 71, 73. So if stocks can’t recover, oil is unlikely to recover here guys as you can see again, with that point in time using the weekly opening price, we’re hugging right along that T cross long.
So this is the area we want to look for now out. If we were looking at this to start our trading week, bringing in the powerful vantage point predicted highs and predicted low, we’ve got 71, 77 as the predicted high and we’ve got our T cross long at 71, 73. This is nothing subjective about this, this is an objective setup here guys, we identify and pinpoint a specific level that we want to sell. We look at our neural index strength that’s pointing down, we’ve got a crossing to the downside, but we’re lacking momentum on the RSI, just like the S&P 500. You can see how that correlation plays in here, so if you’re inclined to short this, we can pinpoint while and I will point out the mark closed, why I’m doing this video because this is an outlook, not a recap of something that’s already happened months ago.
We’re talking about start of trade on Monday, the markets are currently closed and we’re predicting or pinpointing a very specific level, and then picking it aside, which way are we going with this long or short? Well, this setup would remain short and our stops would be above our verified high at 73, 13. So once again, unless we can close above that T cross long two days in a row, then we are likely moving lower in oil but watch for recovery if stocks turn around.
Bitcoin
Now, as we move into our digital currency sector, which I… In 2022, I will be adding the I will definitely be adding ether to this outlook because again, I’m seeing some significant potential value in ETH. So for now, we’ll stay with a Bitcoin, we’re still remaining below the T cross long, it still has a bearish tendency to it but you can see that our neural index strength in our predicted RSI is starting to rise with the predicted differences.
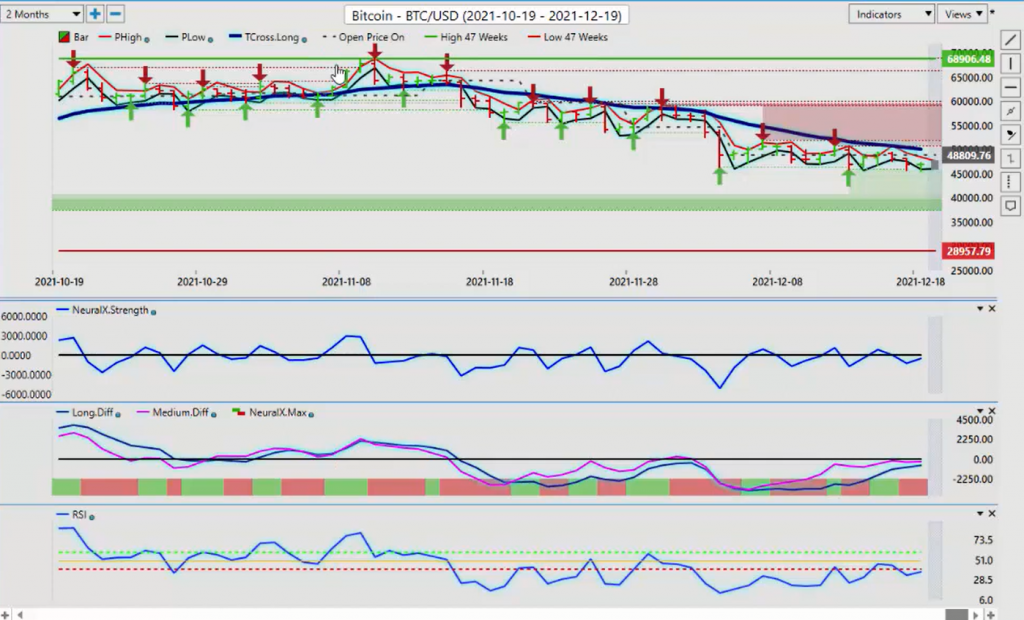
So I suspect we… After we’ve got past the shock of the new way that the fed is going to be doing things and again they could flip Flo within, by the end of January guys, the fed could flip flop again. If the new COVID variant takes hold, then all bets could be off again. So we really are going week to week, month to month on our trading, we’re not looking at doing super long forecasts here of a month or two or three months out because we’ve seen how poorly that that type of forecasting is been with even with the big central banks on a number of the different currencies and commodities, they’ve missed it by a huge margin. So week to week here guys if we look at this T cross long, 50,069, Bitcoin remains bearish. Now we’re coming off some pretty good moves in Bitcoin.
Bitcoin the historical seasonality is Bitcoin always does very well in the month of November, which it did again this previous November which I outlined in last week’s weekly outlook. So now we’ll look for additional seasonalities coming into the market in the new year but the… I don’t anticipate any big moves to finish the year.
So for now again as long as we’re holding below the T cross long at 50, 69, the way I personally am playing this is that I have buy limit orders above the T cross long, I have… Because I have no interest in shorting this, given the historical price action of this digital currency. So again, I will wait a pre pre-identified advance point level and I will wait to get long on this and we’ll focus more towards 2022 and just let this the rest of this year play out. But the current situation is there should be a mild recovery at least back up to the 50,000 mark. I believe during the video right now that I’m making at about 11:04 AM Eastern standard time on Sunday morning, Bitcoins around the 47,000 mark. So this verified support zone that’s coming in down around this 46,000 area here, you can see that there just is not a lot of sellers down here.
So we had a little bit of a push down here to 45, 615, but then the buyers came back in again on Friday, so we’ll continue to watch this verified low down here. Once again, that’s coming in at approximately 45, 615, but that is a new low, so Bitcoin could come under further pressure next week. Now with the Euro currency once again, this is a mirrors this week’s presentation for the last three or four weeks that I’ve done it.
Euro versus U.S. Dollar
We’re looking for the Euro to close two days above the T cross long at 1306. We want to remove some of the guesswork out of this here guys. The first thing we want to do is identify a key level and then identify whether we’re closing above it or below it and how many days you can see that this is this banging into this vantage point T cross long has rep represented excellent shorts ever since November the 30th. It just cannot get over this particular level.
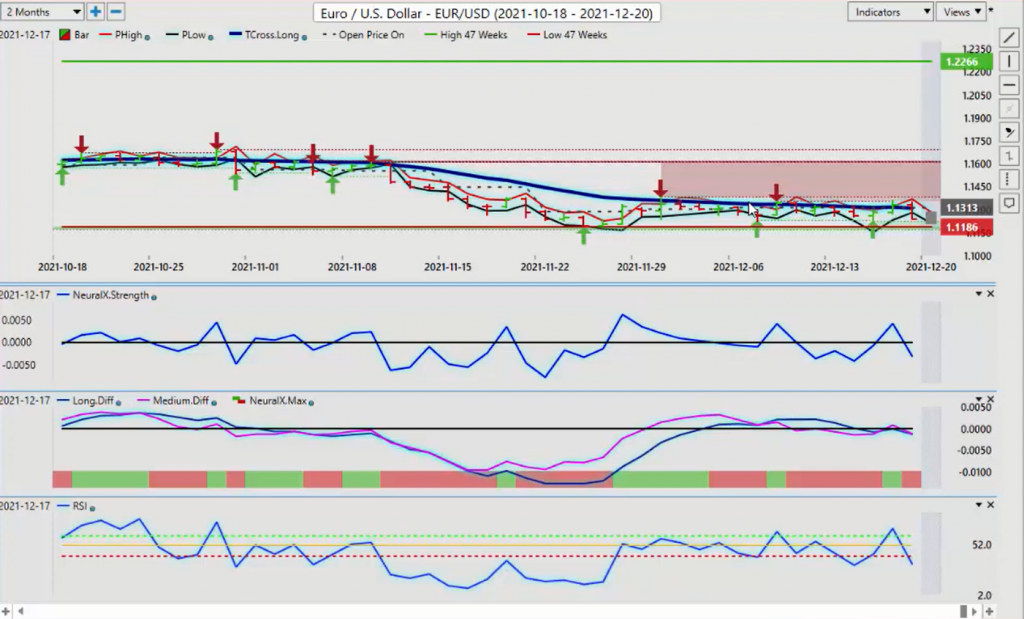
So that does carry a bearish tone to it here but again the Euro was recovering prior to those remarks on Friday. But once again, the main inner market correlation that you guys want to keep your eye on is that if gold breaks out that is going to benefit the Euro here. So I’m watching that inner market correlation very closely in both the Euro and gold, were making a move on Thursday and Friday and then I squashed Friday, late Friday morning on those fed comment. So we will continue to monitor this level. The T cross long is coming in at 1306, we’ve got our neural index strength is down. The neural index itself is down, the predicted differences are breaking below the zero line and it would appear based around the break of the 40 level here that we have downside momentum building.
So again, if we connect the dots to the key vantage point level, that’s coming in at our T cross long at 113, 06, we then look at our predicted high at 112, 81. So to start the trading week, if you want to stay on the short side of it, you want to look to short between about 113, 10 and one, and a that advantage point predicted high at 112, 81.
U.S. Dollar versus Swiss Franc
Now, if the stocks tumble here, this coming week, there’s two pairs that are going to continue to push lower and that would be the dollar Yen and Us Swiss Frank, which are virtually the exact same trade, but there’s opportunity here using the T cross long, removing all the other moving average and just focusing on longer term moving predicted, moving average to determine an entry point and whether it’s actually bullish or bearish. Now it’s tried to recover on Friday, but again, those fed comments.
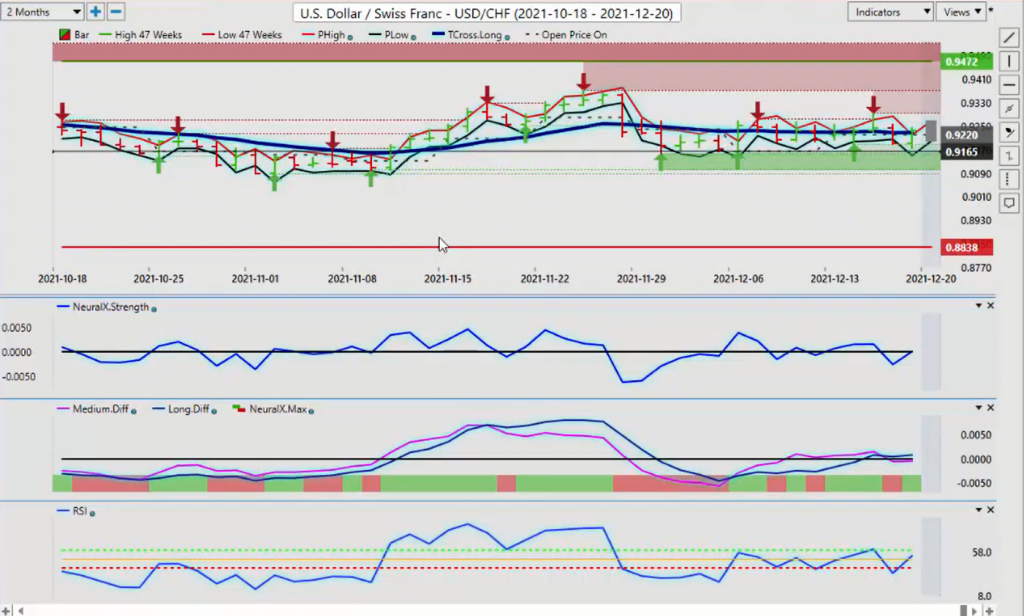
So I’m going to take that with a grain of salt here because again we’re not closing two days in a row below here. The indicators are very mixed bag here but we don’t have a lot of momentum building. We’ve got a verified support, low 91, 57, and we’ve got a verified resistance high at 9293. In my respectful opinion, this pair is likely to play this range for the rest… For the remainder of the year, unless something big happens with the COVID variant stock markets sell off these types of things but we’ve got a slightly bullish signal here but the vantage point predicted low coming in at 9201. But again, I would be playing this range for the remainder of the year.
U.S. Dollar versus Japanese Yen
The same thing here applies to dollar Yen ,you can see that we… At this time of year, we simply have no buyers here.
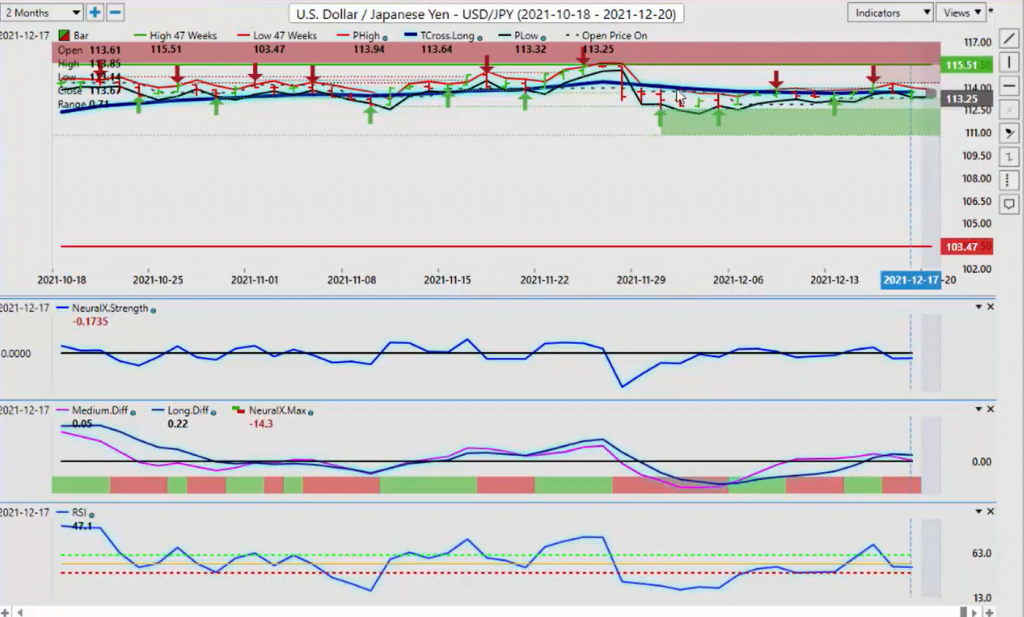
I believe that’s largely because we have a gold seasonality. If gold goes up the Yen strengthens, so does the Swiss Frank, so you want to connect the dots between these two pairs, but right now, our T cross long 113, 64 we’ve recovered on Friday. We’ll see how the market starts the week but the medium term crossing the long term predicted difference with the neural index. I’m just watching that predicted RSI to truly measure accumulation distribution or [moment 00:15:45] a better word to use is supply and demand. So if supply is filled, then price is going to go lower here guys. We’re looking for demand in this pair, I don’t believe we’re going to get it until the new year. The first week or two into January is when the Yen will weaken, that is what we would be looking for.
British Pound versus U.S. Dollar
Now with the pound dollar this past week, again the surprise, a bit of a surprise. They hiked the bank of England did but this is why we don’t trade those types of announcements guys because as quickly as the pound made gains, it gave it all right back because now the fed is talking about doing the same thing and the COVID variant is starting to run out of control in the UK where I don’t think it is… That is happening in the US with the warmer weather, so I’ll continue you to monitor the progress with the COVID variant but for now, you can see that we’ve slipped right back below here. And that’s why I like to implement a two day rule here to take the subjectivity out of this and have an objective plan of how to get into these markets. So if I can close two days above the T cross long then I’m good to go on longs, then what would the former resistance will turn support, that has not happened here yet guys.
So to start the week on the pound dollar, our T cross long 32 77, and we are closing a fairways below that at 32, 30, not a huge distance but if we look at it right now to begin the week if we were to stay primary down trend, our predicted high is 130, 265. Our T cross long is right beside it at 132 77. So once again, you can stay with the primary trend and short into this level or you can have… You can straddle this and have a by limit order ready to go above this predicted of this most recent high at 133 74, or just above the T cross long at about the 133 05 level. You can put a buy limit order there, so you can much like the way I’m playing gold here, or Bitcoin. Excuse me, if it goes up above that level, I’m sitting there waiting to go long again and stay with the primary trend. But the primary trend on the pound dollar is not to the upside guys, it is to the downside.
U.S. Dollar versus Canadian Dollar
Now, when we look at some of our main former commodity currencies which I know call equity currencies, the… You can see that is the market took a bit of a tumble there and the dollar index recovered then we hit the vantage point T cross long on the US Canadian pair at 127 52 and shot right back up. Now here’s the deal guys, the bank of Canada is also flip flopped, now they originally said that they were going to hike long before the federal reserve. They reiterated that in the bank of Canada statement then they flip flop last week and said, now at the very earliest, the bank of Canada is going to hike, is going to be in April. So this leaves us traders scratching our heads saying, you know what, make up your mind and they just won’t, there’d be influenced by the Canadian government saying, okay, lower for longer, we got to… We could be going into lockdowns again.
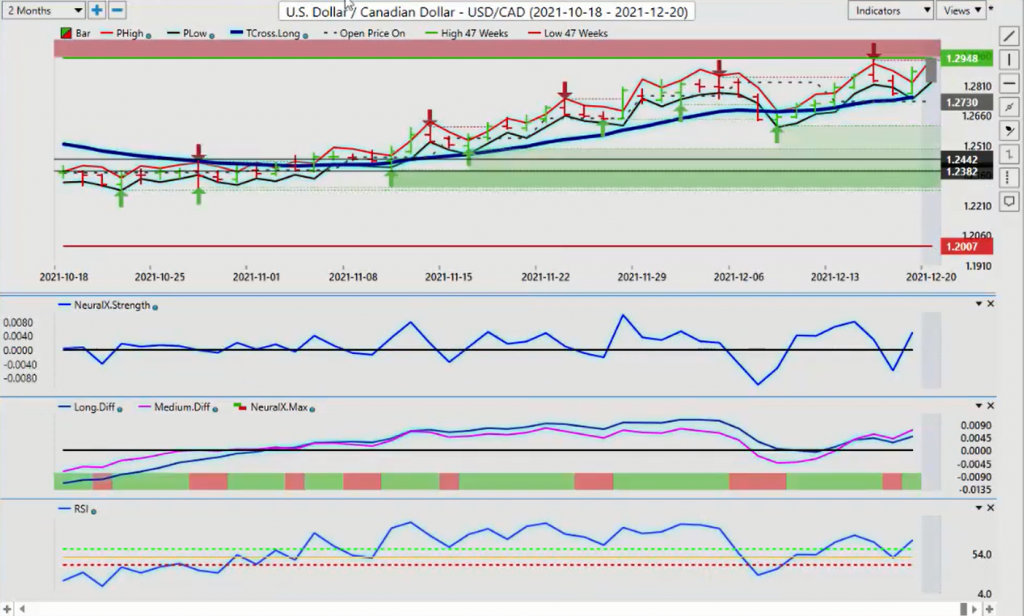
So they have flip flopped and the fed flip flopped, and now it’s reversed. It’s likely the fed is going to hike before the bank of Canada, so that puts pressure on the Canadian dollar. So the only thing that can save the Canadian dollar, if stocks recover, the Canadian to all will follow the S&P 500 and light sweet crude oil keep a very close eye on those two other markets. If you’re buying or selling this particular pair, we have significant verified resistance at 129 50. This will be the hurdle that it must overtake but you can see by using this lone longer term T cross long predicted moving average, it eliminates the subjectivity of short term crossovers, Long-term crossovers, this crossover, this indicator, that indicator, it’s very objective.
If I’m going to buy this, I need to hold above this particular level, the verified zone and the yearly high, the 52 weeks look back of 47 weeks look back, they’re all in that particular area. Now, if the S&P 500 cannot recover and that’s a big if here then the Aussie will not recover either.
Australian Dollar versus U.S. Dollar
Now, the Aussie recovered as I stated in the other week, weekly outlook that I anticipate the S&P 500 will recover so that means the Aussie will recover, New Zealand US will recover and US Canada will drop. So these three pairs are dependent on which of what the next move on the S&P 500 is. So if I’m looking at this, I’ve got my T cross long on the, Aussie will run through this again, 71 58. We combine that key point with the vantage point predicted high, which is 71 65.
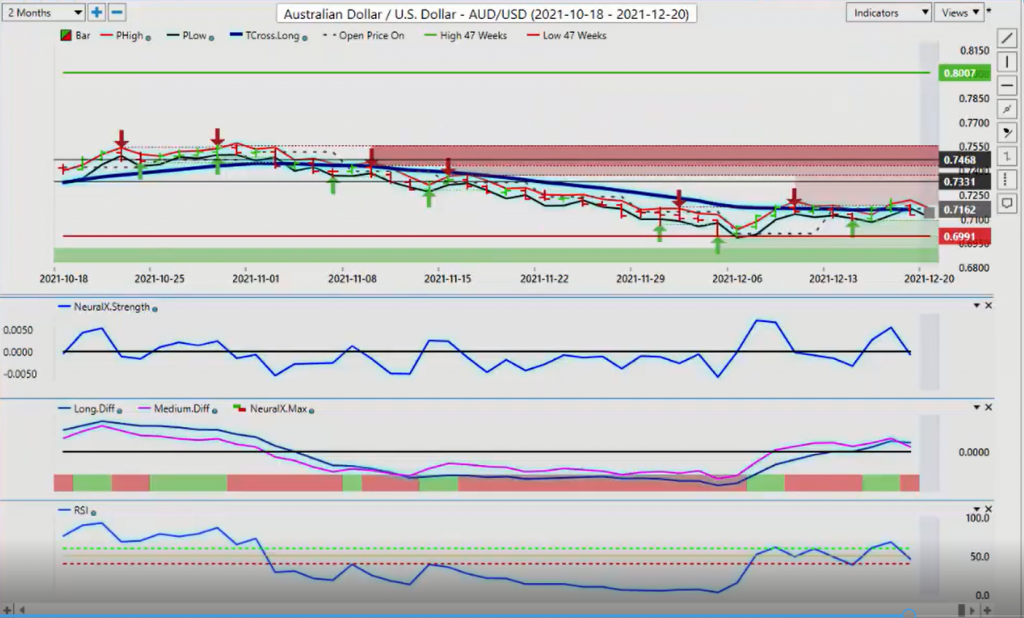
So in my respectful opinion based around the indicators, we’ve got our [MAIF 00:20:43] cross with our neural index and a falling RSI. That’s telling me that again we can attach whatever names you want to it, supply and demand, accumulation, distribution, whatever you want, just as long as you’re calling it and identifying it and what I would call this is supply being filled and there’s little demand when, the fed is going to hike and stocks are going lower. So that scenario changes, that’s what it would take to put to get the Aussie moving back up. But the also Aussie also has a very high correlation to the Euro, right? So again, keep a very close eye on stocks and know your levels guys, as long as you know your levels then you will be able to trade this with minimal risk and high reward.
New Zealand Dollar versus U.S. Dollar
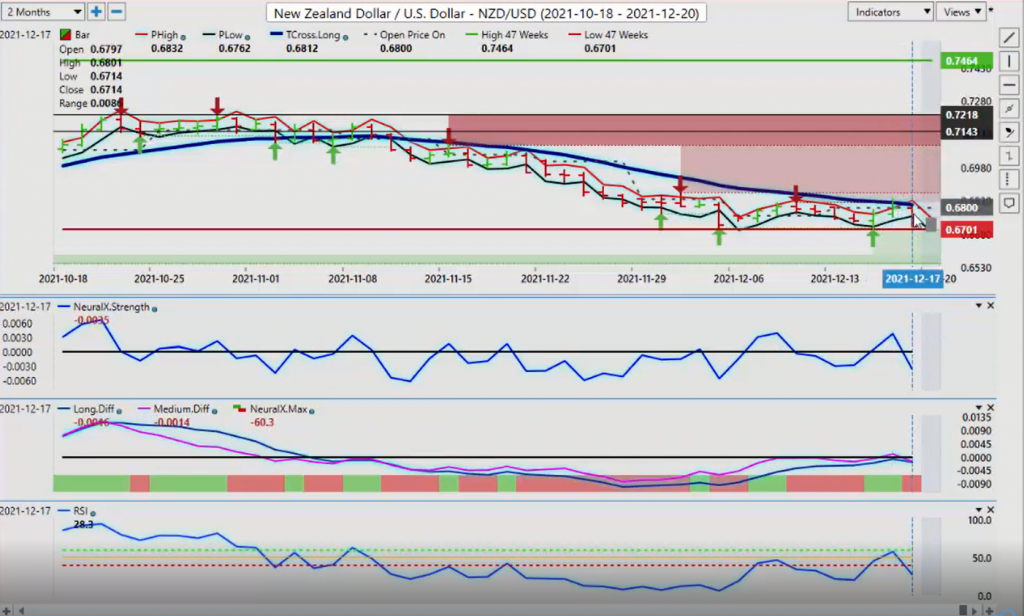
The same thing will, I don’t look at the New Zealand currency much different and you can see this entire week, it’s coming back up, it’s hitting a very specific level of the T cross long and it’s failing. So once again we are making yearly all-time yearly lows here, down in this 67 09 area. So we’ll keep a close eye on this but right now, this is pointing lower on New Zealand also. So the fed really has wrecked havoc in the market, I would’ve argued that original statement was not overly hawkish but the comments that came out afterwards on Friday certainly were by two different fed members, so that’s telling me we’ve got some dis centers in there and the fed is… He’s got some issues going into the new year with this particular group. So what that said, this is the VantagePoint AI market outlook for the week of December, the 20th, 2020.