


Welcome to the Artificial Intelligence Outlook for Forex trading.
VIDEO TRANSCRIPT
Hello everyone, and welcome back. My name is Greg Firman, and this is the VantagePoint AI Market Outlook for the week of August the eighth, 2022.
U.S. Dollar Index ($DXY)
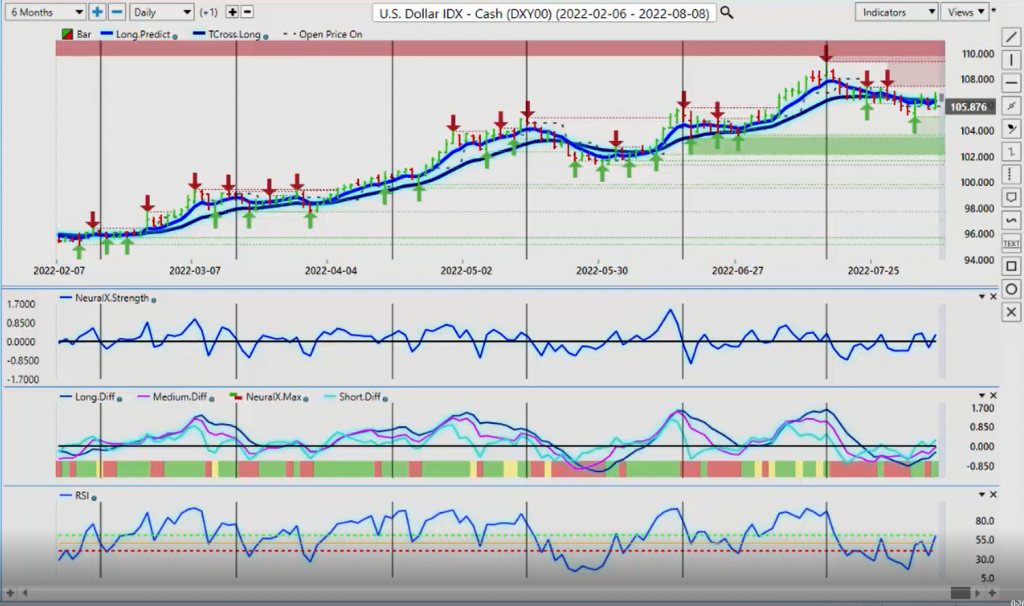
Now, to begin this week, we’ll begin where we always do with a very important US dollar index. Now, what I’ve done here this week to bring into perspective these monthly cycles in the dollar is we can see that I’ve drawn a vertical line over on or about the 15th of each month. Now, what this shows is that basically over the last, I would argue over the last five of the last six months, the dollar rallies on the fifth of the month. Now, you can see it here clear as day, the VantagePoint indicator’s very effectively pointing when these rallies start, but I’ve identified when they fail.
Now, during this period of time, we’ve had interest rate hikes. We’ve had severe risk off environments. We’ve had the strong unemployment numbers, strong inflation numbers. The Fed and the media keep telling us there’s no recession. That certainly could be argued strongly. But again, when we look at this as traders, we look at this and say, “Okay, is this repetitive pattern likely to continue this coming week for at least five, seven, eight days?” So right now, the primary indicators in VantagePoint, that predicted differences, the predicted RSI, the neural index strength. We’re starting to turn around here. This mirrors the previous months. When I look back at this from one year ago to the exact date, we can see the same thing where we’ve rallied into about the 18th of the 20th of the month. Then we go down again to that first week of the new month to the 6th of September last year, and then we rally back up again.
So again, when we look at these repetitive patterns where people are debating this indicator, that indicator, we look for repetitive patterns, and then identify those patterns with the VantagePoint software. So once again, it would be perfectly normal for the dollar to go higher this coming week. The unemployment numbers on Friday were very strong. However, two consecutive quarters of negative GDP equals recession. So despite what the media is saying, there’s a excellent article in the VantagePoint blog again this week about just that. And the media trying to spin this, the Fed trying to put spin on this. So the unemployment numbers are still lagging here, guys, in July. But once again, two negative quarters of GDP is concerning, to me at least, that a recession is already in play here. So I’ll continue, or we will continue to monitor this. But for now, coming into this week, the indicators are pointing higher in the dollar.
Now, once again, I’ve tried to warn a lot of people what I’m seeing every single week that this is what you’re seeing, is a big move down or a big move up on the dollar on the Monday, only to reverse on the Tuesday. We saw this again this past week, the dollar selling off on the Monday, and then a complete and utter reversal on Tuesday. This is happening across multiple different markets, but it’s being triggered by the dollar index and the S&P 500. So for next week, right now, at least for now, we’re pointing for a positive week for the dollar. But again, my concern is that the media is spinning that there’s no chance of a recession. There’s definitely going to be a soft landing. I totally disagree with that because the media, again, is trying to change the definition of what a recession is. And we shall see, but for now, the dollar looks to remain firm for now.
And I would anticipate we would at least get another retest of the high of 107.42. But somewhat of a dismal response to that payroll number, so I think the bulk of it is likely to show up Tuesday, Wednesday, Thursday of this coming week. However, we need to hold above 106.36, that is our key support level. 106.25 in the long predicted, but all indicators are pointing to dollar strength. Now, if that’s true, I believe gold and the dollar can go up next week and the week after, and possibly the remainder of August. I believe the dollar will break away and move lower where I’ve shown you around the 15th to the 20th of the month. That’s usually when the dollar sells off. So right now, if it’s true that, in actual fact, the media may not be being completely honest with us, I’ll just put it that way, and that there is a media, or there is a recession, excuse me, coming into play here, then gold could hold firm here.
Now, the indicators do warn that we’re going to be moving lower. You can see the medium term crossing the long term predicted difference. We’ve got some resistance up here. But once again, be very, very cautious on Monday, Tuesday trading. I’ve often talked about this at the seminars and in the VP live trading room each week. Be careful from Monday to Tuesday because there’s this reversal going on just about every single week across multiple different markets. So when I’m looking at this right now, I can see that last week we had the same thing.
Gold
We had a push up on gold on the Monday, and then we get hammered lower on Tuesday and Wednesday, for that matter, and then we turn around.
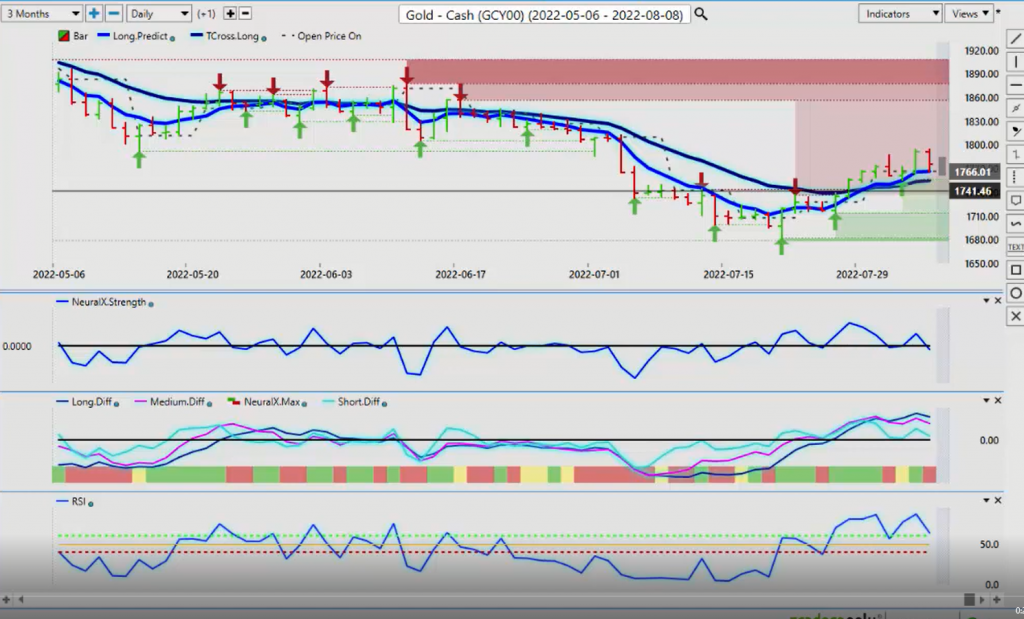
So for next week, gold is basically, in my respectful opinion only, gold is just biding its time and getting through a period of dollar strength, and it would likely pull lower. So that level we’re looking for is 1,754 to pull back into that VantagePoint T-cross long. Now, again, we’ve got heavy support down into here. I’ve shown this over the week. Gold remains still firm. And again, in my opinion, as long as we’re holding above 1681, when we look at this on a month over month basis on gold, it shows a very, very different picture from these shorter timeframe charts. So if I look at this over a two-year period, you can see using the VantagePoint verified support and resistance zone, 1,677. We’ve come down and hit that level back here on, that was in August of 2021.
You can see a nice rebound. We’ve taken a big push down lower in July of this year, hit almost exactly to that verified zone. And we’re bouncing off that again. So what I would like to see is to make sure that we hold above that low of 1681, and then take out the top of this particular bar high at 1813, and then stay above that. So again, we’ll continue to monitor this going in, but once again, if the US is going into a recession, 75% of the time at least gold goes higher during a period like that.
S&P 500 Index
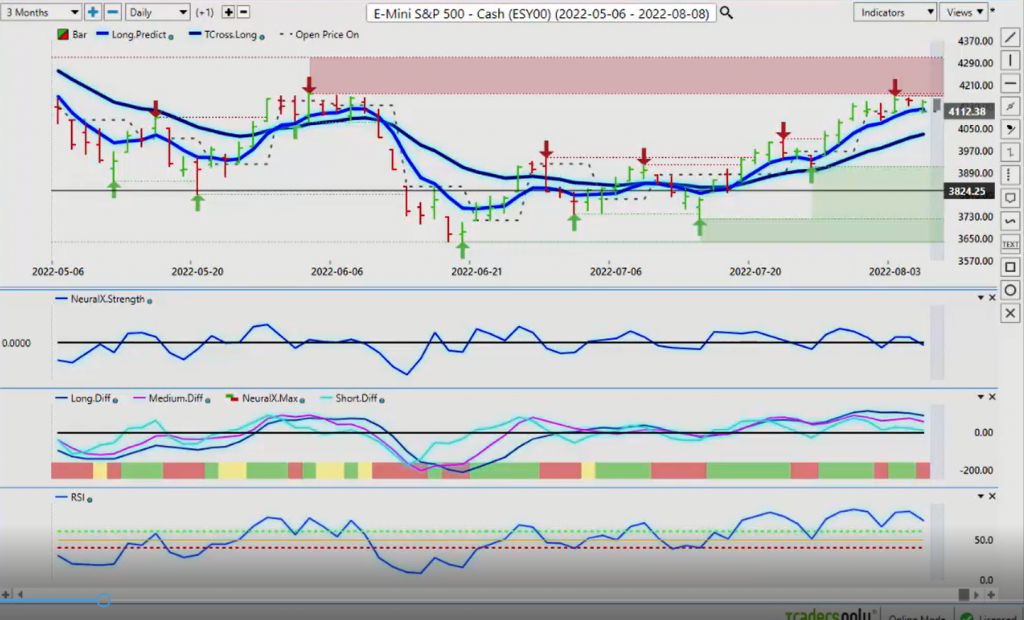
Now, when we look at, how is this likely going to affect stocks next week? My opinion would be, as I discussed last week, that I felt that it would be very difficult for the S&P 500 to break through 4177 and close above it two days in a row.
Now, we’ve come right up to that on August the third and we’ve hit. So once again, the inner market correlation here is the S&P 500 would be inversely correlated to the dollar. So we expect the dollar to have some kind of rally next week, maybe it won’t be as strong as what it’s been in May and June and July. That’s difficult to say at this time. But if it rallies at all, it will push the S&P 500 down. So if we break down below our long predicted at 4120, our next target price, which is very likely, I would say, would be down at 4030. Now, we would look for that level to hold and the dollar to reverse and go lower the following week. So again, we will monitor these levels, but the indicators are certainly pointing towards the S&P 500 moving lower.
But if, and only if we can get a sustained break of 4,177, and I mean closing above this level two days in a row, because this is a classic area for a bowl trap, so be very, very cautious. Now, one of the questions that I did get last week on this particular subject was, again, looking at, can we look at other stocks? Well, no, I’m not going to go in and look at a whole bunch of other stocks here because, essentially, 90% of these stocks are moving with the S&P 500. But if we were to look at this from the perspective of the FANG stocks, then I could briefly look at this and say, “Okay, well, there’s our major drivers of the S&P 500.” Now, when we look at it from a split screen perspective, and this is why it would take far too long to go into large caps, small caps, that’s not what this outlook is for. The S&P 500 will dictate all of that.
So if we look at the S&P 500 cash, we look at it versus Facebook. These charts are absolutely identical. If we look at Amazon and this chart, it is absolutely identical. When we look at Apple, again, almost identical. The queues, once again, when we look at this again, they’re virtually identical, so it would simply be duplicating the analysis. But it’s very important to understand, when you split the screen using the VantagePoint software, you can absolutely get to… and you can actually see that these are virtually the same trades. But I would further argue that the additional stocks that I’ve seen out there now, they’re being dragged up and down essentially with the S&P 500. So you could have very positive earnings, all these different things, only to see a stock mysteriously crash, even though the fundamentals fully supported the stock going higher. When the S&P and the risk off scenario took hold, that was the end of it. It dropped.
So the probability that, at least at some point next week, that stocks don’t do well is extremely high when we bring in the indicators. But we also identify that US dollar cycle, where it’s strong in the week of the non-farm payroll, the week after the non-farm payroll. But then subsequently, it mysteriously crashes again towards the 15th and the 20th during that particular period.
Crude Oil
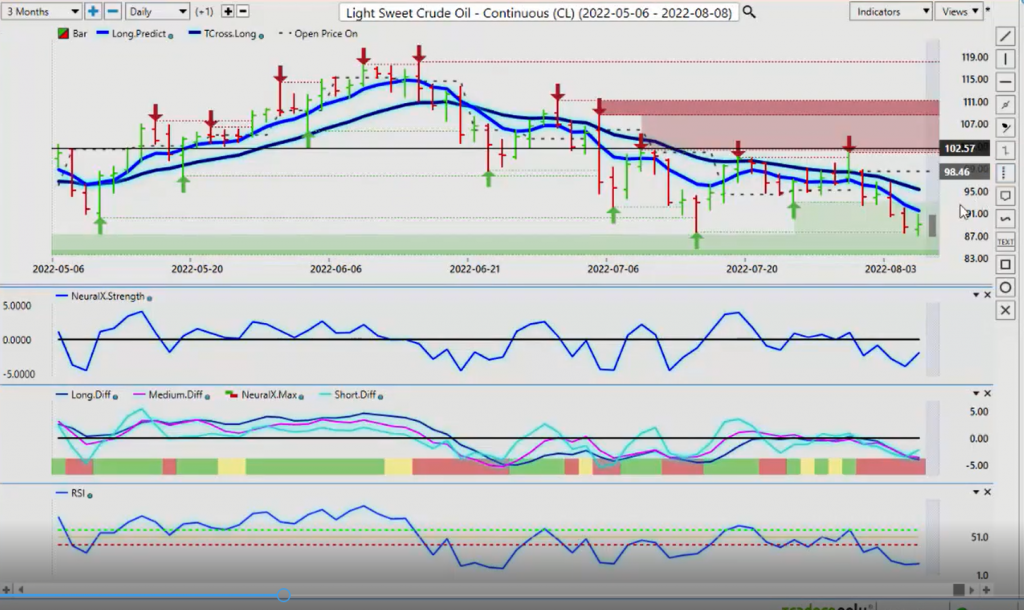
Now, with oil next week, oil under pressure again here. A tough week is it tried to break through here, and it just couldn’t do it. So once again, when we look at this down day on Monday in oil, we see a big reversal, or not a big reversal, but big enough to make some pretty decent money on that reversal. And then the real move shows itself, again, on Wednesday. Now, you’ll see how the market came up, hit that T-cross long at 96.79, and then subsequently went down even further.
So I suspect next week will be not that much better for oil. There are some signs of strength pending. We’ve got our medium term crossing our long term predicted difference. We’re flat lining on our predicted RSI. Reverse check mark on the neural index strength, which we’ll watch. But we do have a strong verified support low at 87.61. Be cautious of a bear trap around this particular area. If oil is going to remain locked in the current particular range, the bottom end of that range, guys, is 87.61. And I would argue the top side of that particular range, which I don’t anticipate hitting anytime soon, would be 118.06. So clearly a bearish biased, but loans, if you’re a buyer of oil and you believe that things will get worse with Russia. But again, recession and oil, not a great long trade here for the most part, but there are outside influences here indisputably with what’s happening with Russia and Europe and everything else. So we’ll continue to monitor that, but for now, it does carry a bearish biased.
Bitcoin
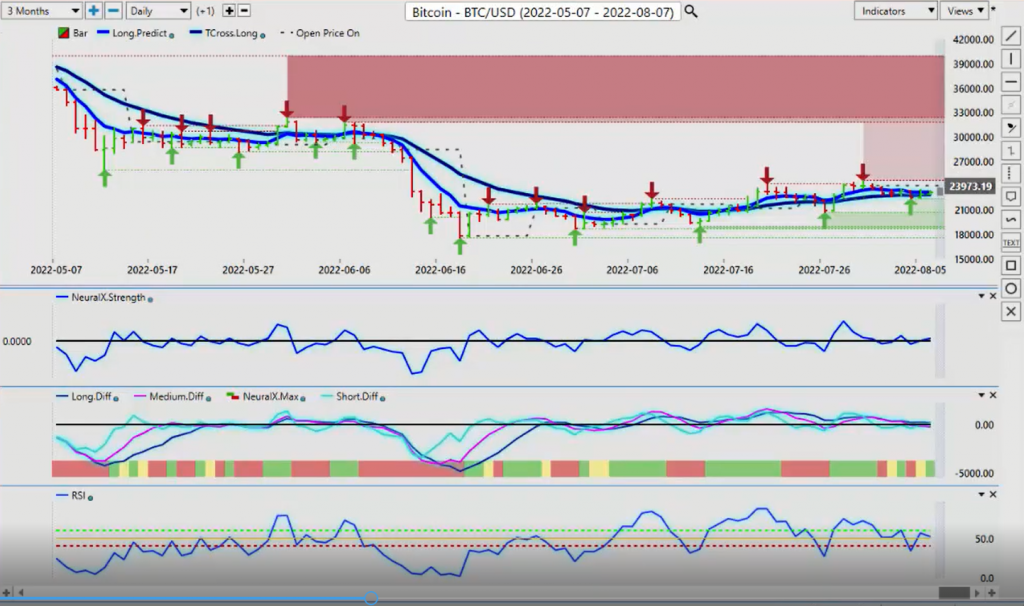
Now, Bitcoin, again, holding its ground. One of my favorite times to buy Bitcoin is mid-September through to about mid to late-October. So Bitcoin holding its own here, kind of sideways with a very, very slight bullish biased here. But we’re basically just locked in a channel here. I’m not sure that this channel will break prior to September. August is a very slow month here, painfully slow. Actually, I almost limit my trading to next to nothing in the month of August because, again, normally very, very low volume. Nothing to see here. But September, October, November, December are hands down some of my favorite months in all financial markets.
So I don’t want to overdo it in the month of August, I want to focus more towards September. But I think there’s still some opportunity here. I think we would be lucky if we could see Bitcoin moving into the lower 17, 18,000 mark to pick up those longs for mid to late-September. Right now, our key levels here on VantagePoint are long T-cross long 22,902. We would look for that to hold, but I think it’s very unlikely that it will hold going into the next week because you have about a 95% correlation between Bitcoin and the S&P 500. So if the S&P 500 slips next week, Bitcoin is likely to slip too. But the idea is that we’re prepared for that. We expect that to happen. It’s not a surprise because we’re buying too high on something like this. Now, when we move into our main 4X pairs for next week, starting with, of course, the main, the most heavily traded 4X pair out there, which of course is the Euro US pair.
Euro versus U.S. Dollar
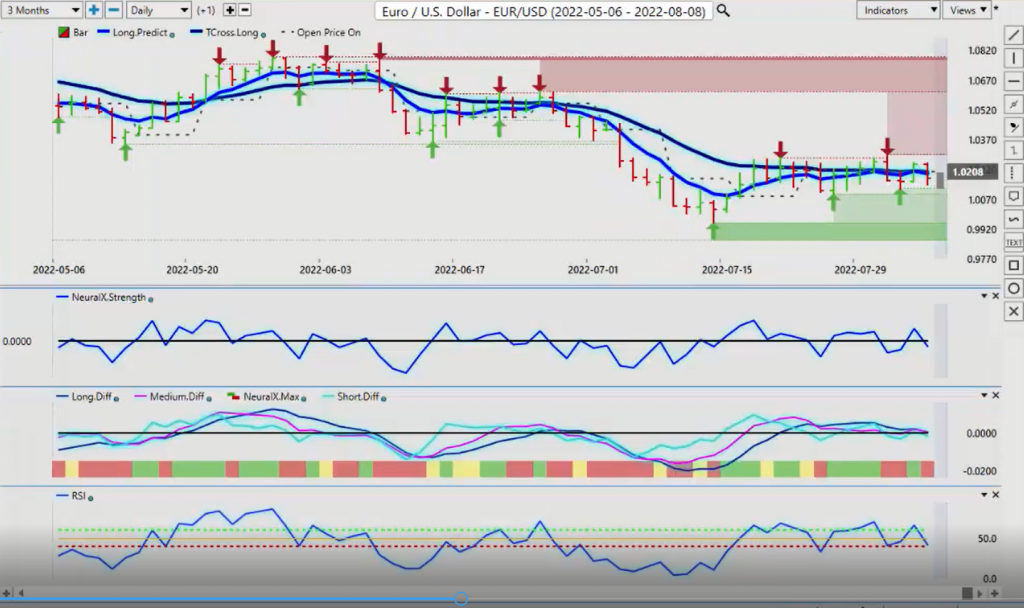
The Euro did actually have a pretty good week here. But once again, when we count back days here, you see this reversal phenomenon that I talk about every single week. Anybody that’s been in the VP live room or at the seminars, you see it clear as day again. The Euro at a good, strong rally out of the gate last Monday. And then it got killed on Tuesday and on Wednesday, slight recovery on profit taking Thursday day, only to go down again with that non-farm payroll number. Now, again, there is reason to believe the Euro could move below parody again here. And if that is going to happen, guys, it would likely be next week, because this would be the last hurrah, so to speak, for the Euro, or the dollar, excuse me, before we get into real, high volume trading September through December.
So once again, we’re locked here. We’ve got to break above the levels that I talked about. But here we are again, multiple weeks that I’ve been talking about these levels. 103, clean break of that. You can see how these brokers and banks trap retail traders right there. They push it just slightly above that verified zone. But again, I had already warned everybody about Tuesday trading. That if it rallies up, then you’ve got a problem. So respecting the fact that this has happened two or three weeks in a row, I would expect more of the same tomorrow. If there’s any kind of significant rally or even a mediocre rally in the Euro US pair tomorrow, that it would sell off on Tuesday. That’s what I’ve seen for multiple weeks here. We’re clearly running in a sideways channel here, but the indicators from VantagePoint are definitely carrying a bearish tone here, guys. The neural index strength, the slope of it, which is extremely important to me, the break of the zero line, the neural index itself is in agreement. Falling predicted RSI, predicted differences crossing lower.
All of this is suggesting the Euro ultimately goes lower next week. So look for a potential move. I think we certainly would be lucky if we can get above 102.50 to reset those shorts, at least for a week during this known period of dollar strength.
U.S. Dollar versus Swiss Franc
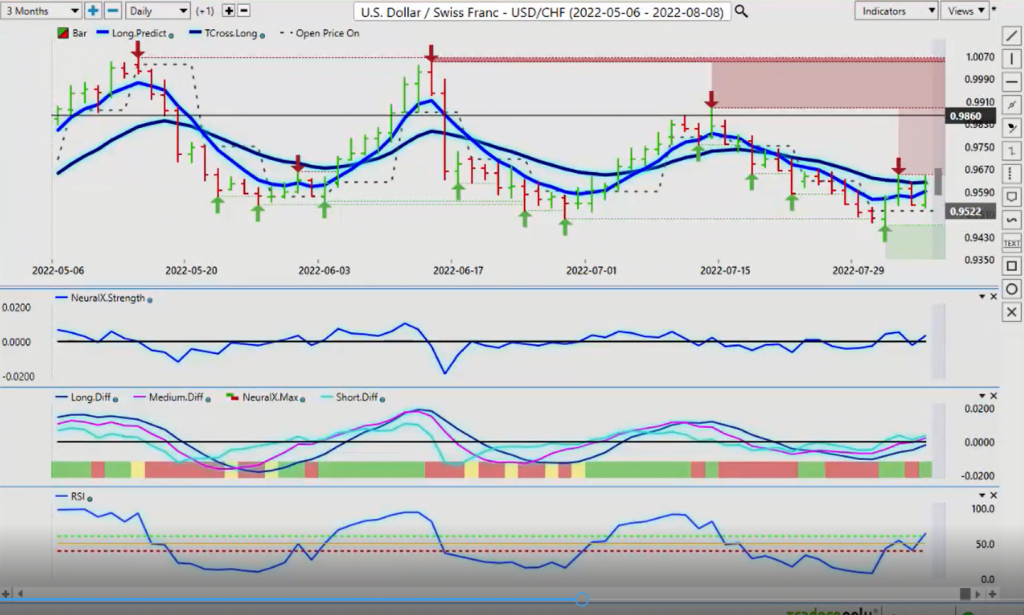
Now, the US Swiss strength, this pair sticks out like a sore thumb here. I’ve talked about this repeatedly, and you can see this clear as day. This is an excellent barometer for the dollar index. But again, right around that 15th of the month, 16th of the month, you can see a clear pattern here. But the pattern we’re currently in is this one where it’s rising for that period of about 10 days up until about the 15th. So once again, that would take us into the latter part of next week.
So right now, we’ve already got some very bullish undertones to this pair, the neural index point reverse check mark pointing higher, predicted differences moving up. The predicted RSI at 64.2. Now, very briefly, the way I would use the predicted RSI is I have no interest in overbought, oversold, anything like that. I’m looking for momentum in the market. I’m looking for a shift in a trend. This trend has been pushing down, and I would argue it’s still in a long term down trend. You can see we have a series of lower highs here using that red arrow. But again, I don’t believe that this is a long term play on the buy side, but they’re just the same if we’re clearing the long predicted and the T-cross long at 0.9623. Then I would argue we would get probably close to 0.9880 in the days ahead here it. The one slight side note that could hurt this is if the S&P 500 really tanks. That could hold this pair back.
And if gold can manage to push higher and outpace the dollar, then that would, again, support the Swiss Franc. So we’ll monitor this, but again, when we have a specific level in the sand, which is 0.9623, then that’s what we’re looking for a sustained breakup. The VantagePoint predicted low for Monday’s trading, 0.9581, keep a very close on that level for a potential long.
British Pound versus U.S. Dollar
Now, the British pound US dollar going into the next week. Once again here, guys, just to point this out so everybody can see it so you have some ideas, because I’ve talked to thousands of traders over the years. And some of the guys that write the algorithmic programs I work with, and they said the same thing, “We’re turning our systems off on Monday. We don’t know what’s going on. We can’t figure it out.”
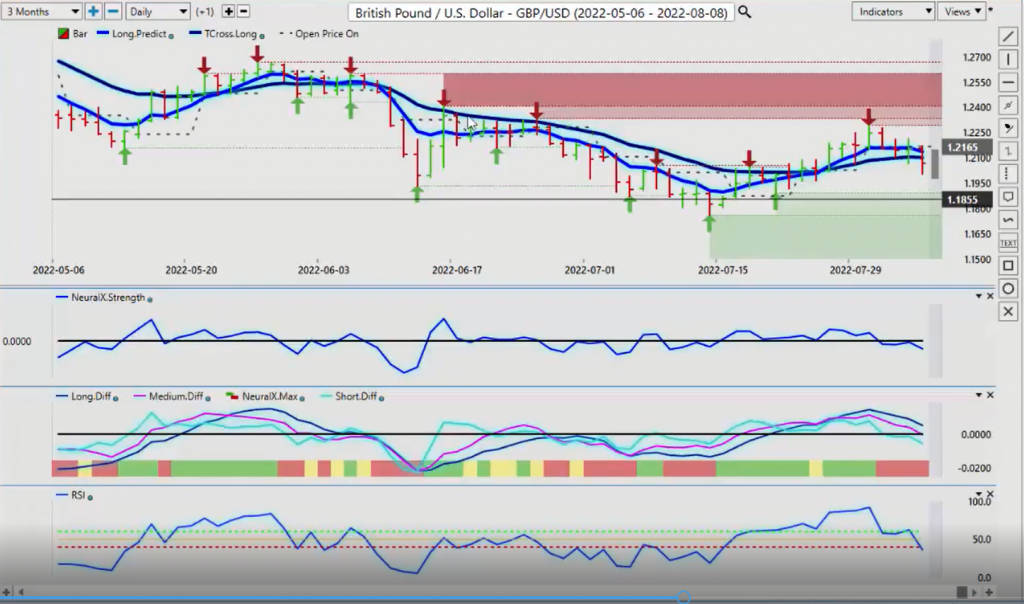
Well to shed a bit of light on that, again, you can see the market’s making a big push on Monday on this pair, and then it absolutely got slaughtered on Tuesday and Wednesday. But Tuesday is the main one to watch at. And if the same thing happens, we rally up on the pound dollar on Monday. You can use the high from Monday, like I did last week here. We hit a high of 1.2293, and then we use that is an actual level that, look, I need to get past that on Tuesday and Wednesday. If not, this whole bar on Monday was a complete head fake. A lot of traders, not just retail, but also some of your institutions are getting caught in this. So be careful of that is what I’m warning. But right now, these indicators are clearly pointing lower on the pound dollar, which goes to that period of dollar strength.
So right now, we’re looking for the market actually to hold below 1.2135, I think will be our critical area. When we look at the VantagePoint predicted high, 1.2145, I believe that’s a reasonable area to look for shorts for next week. You just have to get through Monday to Tuesday and Wednesday, and then I think the pound takes a hit again. So once again, the UK is already openly talking about a recession. So once again, that does not help the pound at all. Now, when we look at the dollar again for next week, a violent recovery off this verified support low. This is a classic example of a bear trap here, guys. And this one actually pretty much caught me in it too, because I wasn’t prepared to hold a counter trend long for very long. But once again, they flushed it out and that’s all it was.
They pushed it about 60 pips below that verified low. Actually, excuse me, almost about, I would say close to a hundred pips below that. Yeah, basically right on 1% of the value per day. So it pushed it below that and re-reversed. But now we’re failing at this particular high.
U.S. Dollar versus Japanese Yen
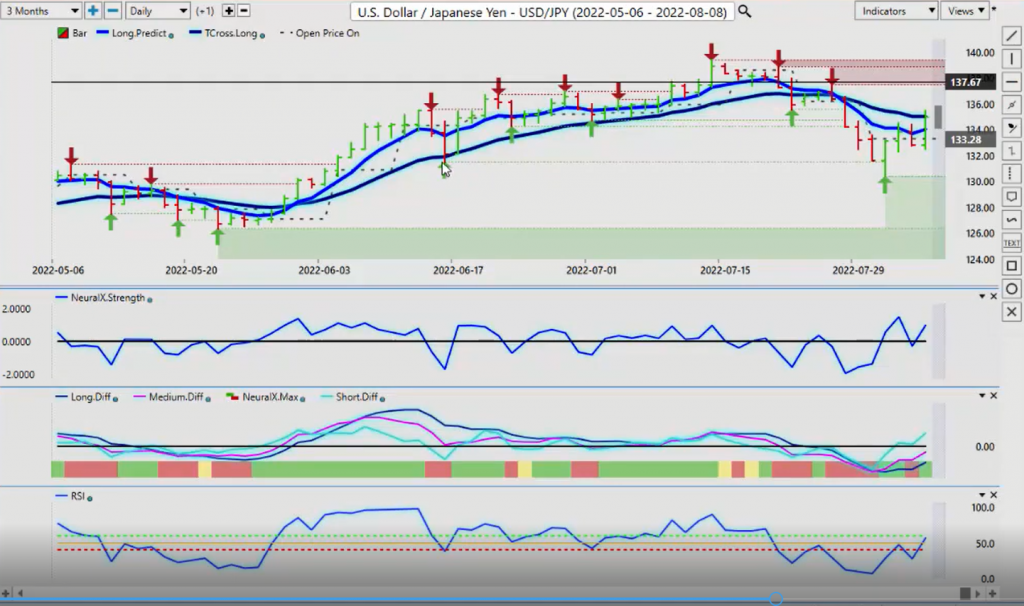
Now, in most cases, the dollar yen does not fare well the later we get into August towards the end of the month. So I would be looking for a potential short mid to late month on this pair. But right now, the VP indicators are clearly pointing this particular pair is going higher. But be careful with this pair, a lot of whipsaw action in this thing. Now, with our main three equity-based currencies, the Aussie, the New Zealand, and the CAD, then the CAD here is really looking vulnerable here. You’ve got the potential of a stock market sell off or significant move lower next week. You’ve got oil prices down.
U.S. Dollar versus Canadian Dollar
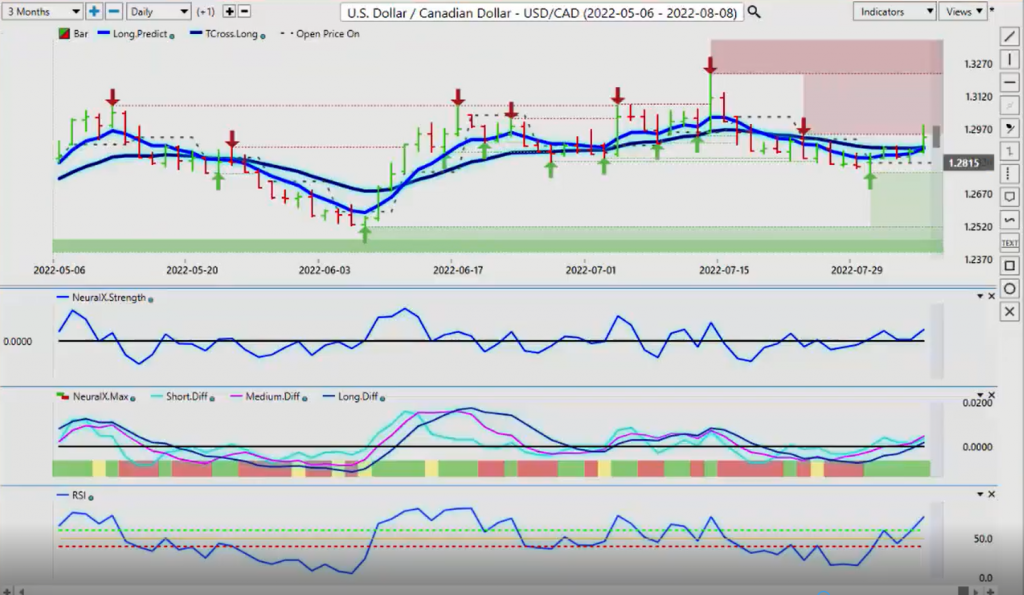
And then on top of all that, a horrendous Canadian payroll report on Friday. I think we were supposed to get 20 or 30,000 jobs. We lost that. We didn’t gain any. So that’s got to have people scratching their head with The Bank of Canada, including me. But again, these central bankers, that’s a whole nother webinar to say the least. But we’ve got a verified resistance high, 1.2946. I would say that area is vulnerable to be overtaken this week. I don’t know if we will head back up to all the way back up to 1.32, but if stocks and oil go lower and the dollar index rises, then that’s not going to help the CAD here. That definitely gives the US dollar an advantage. The indicators are clearly pointing that that’s going to happen. But again, remember this pair is the most notorious of that Monday, Tuesday reversal.
So if we get a big push lower down towards the 1.2887, but I would argue a little bit lower. But you can see the long predicted, the T-cross long, all of our support, plus the VantagePoint predicted low is sitting at 1.2887. So we would look at that area again. And we also have one of my favorite levels too, again, the yearly opening price. But unless we see the dollar buck the cycle and move lower, just the key thing is be prepared and watch these inner market correlations and know your levels and saying, “Okay, well, everything is basically stacking up just around the 1.2880. So on Monday, I could see them trying to push this 40, 50, 60 pips below that potentially. And then on Tuesday, it violently reverses back to the upside.” That’s what you’re looking at. These indicators are warning that the CAD is vulnerable here.
Australian Dollar versus U.S. Dollar
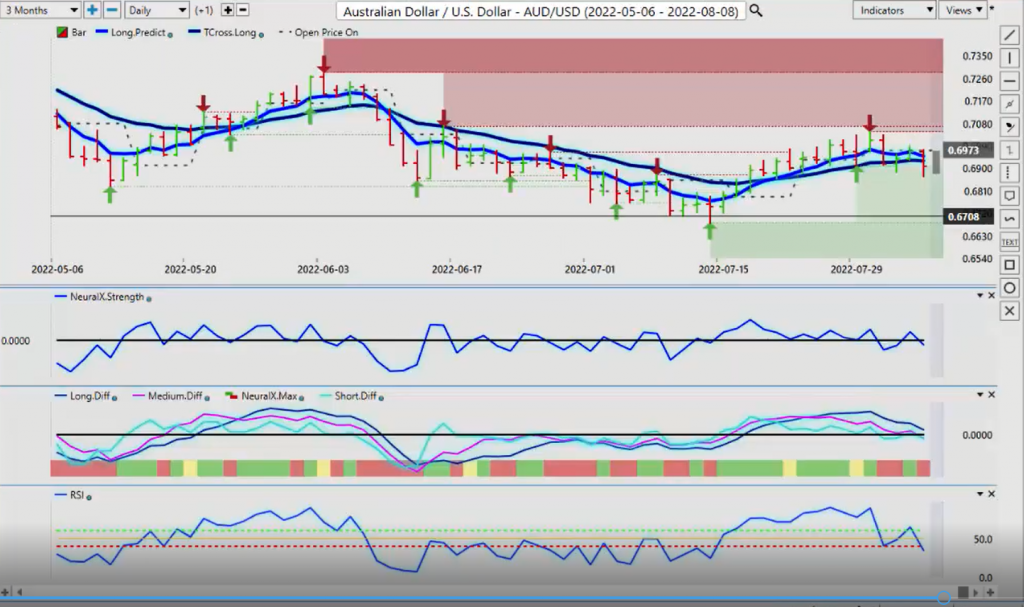
The same thing is absolutely going to apply to the Aussie and the New Zealand. They’re virtually the same trade, just an inverse trade. The CAD goes up, the Aussie, the New Zealand go down. I have the same signal here, a breakdown below the T-cross long, 0.6928, 0.6949. The VantagePoint predicted high is 0.6965. So this pre-identifies a potential short area. And then, of course, all stops would have to be above here. But here’s the deal again, guys. There’s your last Monday bar, a great big strong rally up. But we know that we’ve got a verified resistance high up here at .7069. We have a big rally up on Monday creating a bull trap, and then it gets pounded lower on Tuesday. I can’t tell you how many times I’ve seen this, guys, over 10, 15, 20 years repeatedly, but it’s becoming more significant weekly.
So right now the, Aussie carries a bearish tone.
New Zealand Dollar versus U.S. Dollar
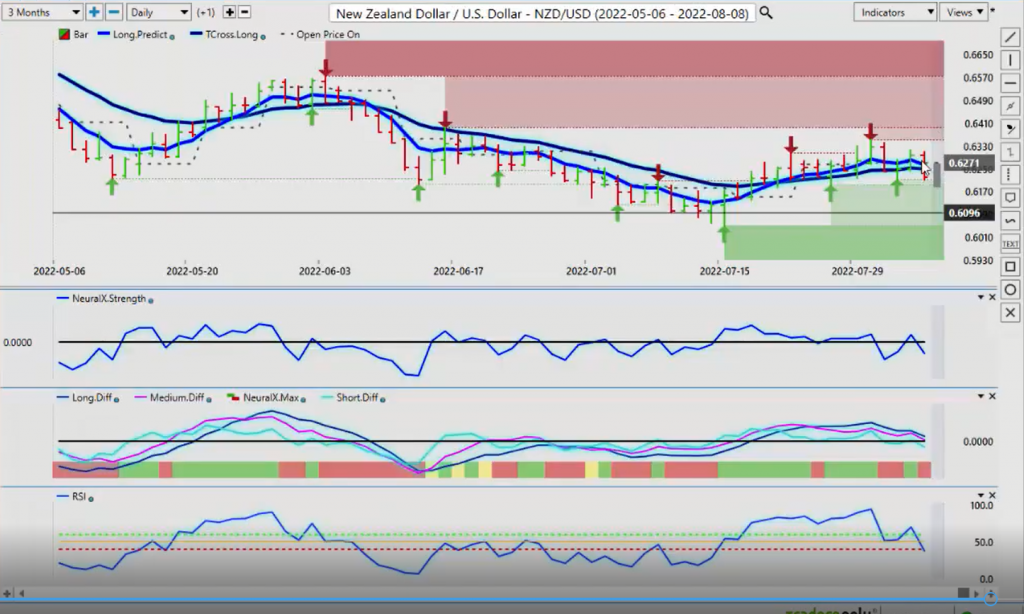
I would argue the New Zealand is very, very similar in that regard. We’ve got heavy verified support here at the low of 0.6192, but that I would likely come under selling pressure once we make a move up on Monday. I would be looking at 0.6265. But a premium short, in my respectful opinion, would be all the way up to the high at 0.6395. But I don’t anticipate that being tested next week based around what I’ve discussed. The indicators, our neural index strength is down, predicted RSI is breaking down below the 40 level.
And again, the breakdown below the 40 level here, guys, what that means, so you understand, is that I’m looking to use the RSI, again, in my respectful opinion only, how it was designed to be used, to show us momentum. I’m not interested in overbought, oversold. I don’t even think there is such a thing. You’re telling the market to stop at a certain point, turn around, and go back higher because too many people have sold it. Trust me, the market isn’t listening to you anymore than they’re listening to me. These things can go lower and higher for significant periods of time. And again, that’s something you want to be very, very cautious of. So with that said, this is the VantagePoint AI Market Outlook for the week of August the eighth.