


Welcome to the Artificial Intelligence Outlook for Forex trading.
VIDEO TRANSCRIPT
Hello, everyone and welcome back. My name is Greg Firman, and this is the VantagePoint AI Market Outlook for the week of August, the 29th, 2022.
U.S. Dollar Index ($DXY)
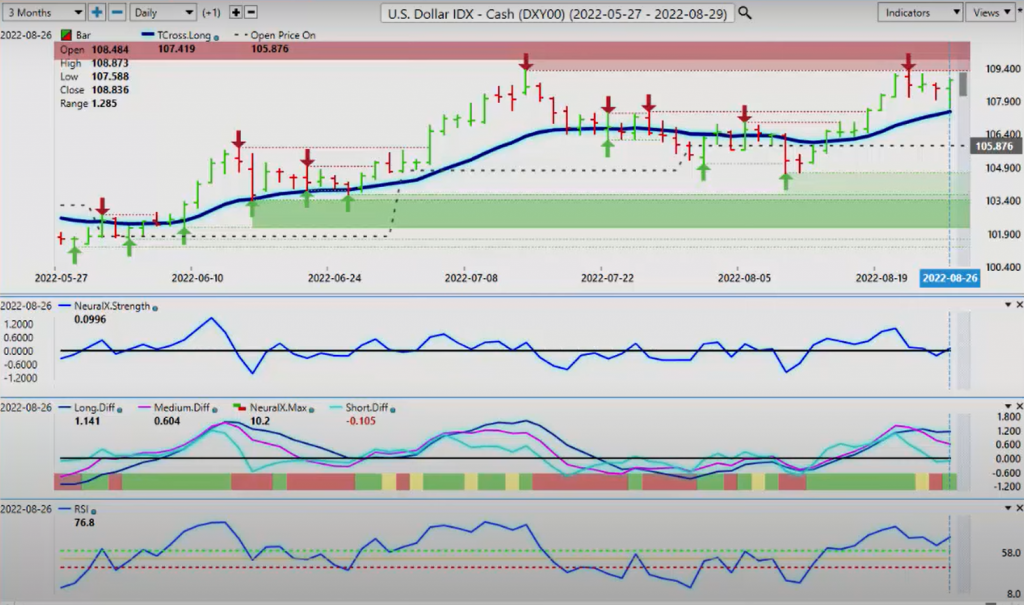
Now, again, to get started this week, we will begin with the very important US dollar index that is driving the main currency pairs, the equity markets, commodities, pretty much everything is revolving right now around the direction of the US dollar. We’ve come through Jackson Hole. The Fed reaffirming that businesses are going to experience and homeowners are going to experience some pain. It appears he is not backing off on the rate hike.
The dollar immediately recovering, but let’s look at a slightly different trade setup, because again, the reason for these videos is to provide VantagePoint users with alternative strategies. Not always black and white, a little bit outside of the box, but different. You can assess them. If you like them, you can use them. If not, then again, that’s totally up to you. But what we’re doing this week in the indicator list here, I’ve once again customized it. I’ve got the triple EMA cross, and I’ve simply removed the T cross short and medium so we can focus on the T cross long solely. This is a trend defining predicted moving average, above it long, below it short.
However, the further we move away from this predicted blue line, the more likely it is we’re going to retrace to it. Now, on Friday, that is exactly what has happened. The dollar experienced profit taking on Thursday. Jackson hole came out. The Fed spoke. We had an MA diff cross that took us back down and we stopped exactly on the T cross long. That level for next week is 107.41. I will also remind, because I do get emails, sign up for the YouTube notifications. This video presentation is being done on Sunday morning at 10:24. All of these outlooks are actually outlooks. They’re done before, not after the market has opened or at the end of the week.
We’re looking at what we’re going to do coming up for the week, identifying critical levels, trade setups, et cetera. This is then transitioned into the VantagePoint live training room, and then we also do seminars. Again, looking closer at this on the dollar index, we can see we’ve had a full retracement. The MA different cross tells us the medium term trend is weakening against the longer term trend. We have a verified resistance high that I have mentioned many times over the last several weeks, and that comes in at 109.29. I would argue that from a seasonality standpoint, the dollar is very strong in the month of September, regardless of the Fed.
I would say that 109.29 in the month of September is likely going to be breached, but it will definitely be challenged at the very least, potentially as early as next week. Now, we have the payroll number. The Fed’s already also warned about that, that we’re going to have probably slower labor markets. It puts less importance on the actual nonfarm payroll next week, because he’s kind of already saying, “I’m expecting it to be softer.” That was interesting in the Fed statement. But at any rate, right now, we’ve got our neural index strength is crossing back over the zero line. We’ve had our full retracement down to the T cross long.
Again, as you can see, there is no Fibonacci waves. There’s nothing down here, guys. There’s simply the predicted moving average, and that level is held, which tells me we’re looking at further dollar gains. Now, when we apply this to the correlated markets and we look at gold… Now, the one quick note that I will go back on, I just missed that, sorry, so I can set a foundation or an anchor point for this presentation is this line down here is the monthly opening price. The monthly opening price, my view in my respectful opinion, again, only, we are trading month to month. I’m not looking at three months out or four months out.
This is a weekly presentation. In my direct trading, I look at things from a month to month perspectives, applying critical levels, seasonal patterns, seasonal percentages, all these different things. Right now the monthly opening price or our point in time, price on open, 105.87. The dollar has had a very good month. You can see we’ve been holding above this. But in this presentation, what I’m going to show you is, again, if we’re holding above the monthly opening price, the predicted moving average is above the monthly opening price. The market crosses over, closes above that predicted moving average two days in a row, fire at will.
This setup is very seldomly wrong. Again, nothing is 100%, but when you know your levels and you have anchor points. I have two anchor points actually here. I’ve got the T cross long and the monthly opening price. Once it crossed over… And a seasonal pattern, which tells me that the dollar is not super strong in the month of August, but it is still strong. But September and part of October, it shines. Again, this trade set up has warned me that we’re going to head higher. We get up to a top, near a verified zone, and then we start to slip back down. But this move is corrective in nature. Again, for next week, that’s what we’ll be looking at.
If we apply the exact same trade setup, excuse me, with the same methodology, with the same indicators in a different market, we should come up with something very similar.
Gold
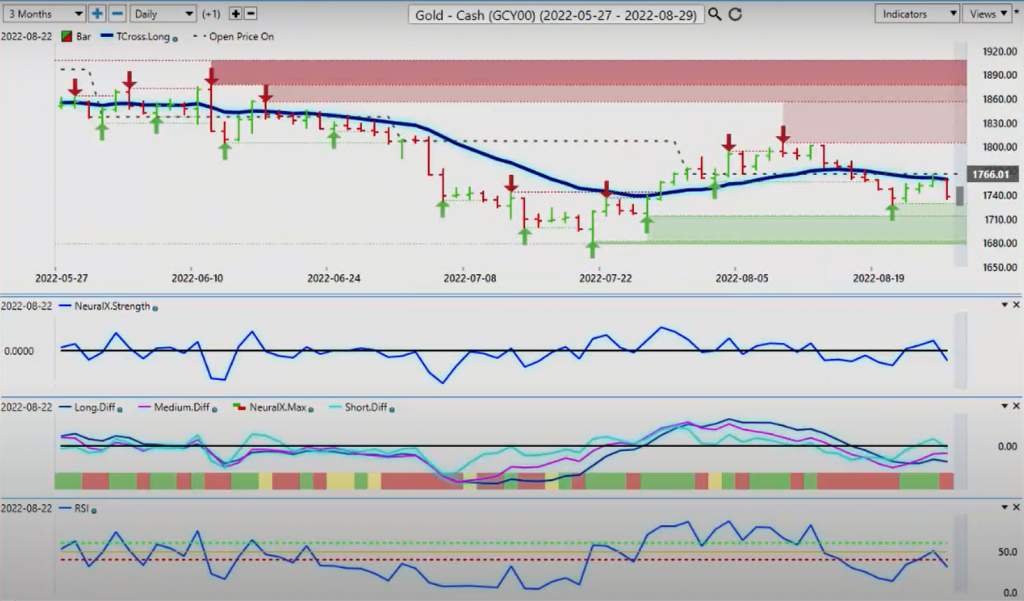
Gold started the beginning of the month where the dollar was struggling a bit and it moved higher. But again, when you can see, we crossed over the T cross long and at the same time we cross over the monthly opening price, we close below them both two days in a row and down we go. We had a full retracement back to that exact same level and down it went again. For next week, we’re looking at most of our resistance is going to be at the open price of 1766 and the T cross long at 1759.
This would be your sell point. The indicators are very mixed, but it’s still pointing for further losses in gold. Now, again, we keep moving in this particular direction.
Crude Oil
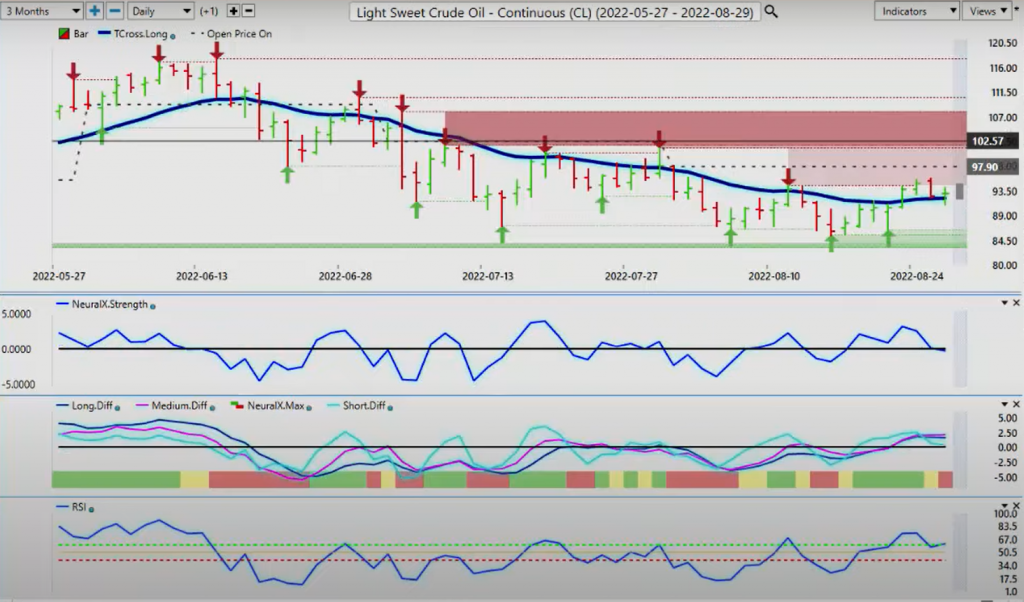
We go to light sweet crude oil. We have our anchor point of our monthly open. With oil, it was very different this month. We immediately crossed over the T cross long. We’re below the monthly opening price, and it led to a significant sell-off. We’ve had a retracement back to the T cross long, and we come back down again. Now, we’ve crossed over the T cross long, but we’re still below the monthly opening price. It is still bearish on the month. We can’t say something is bullish, guys.
If it opened at this price over here and we’re currently at this price, then it’s not bullish. It’s actually bearish. Again, we would have to maintain and stay above the T cross long at 92.16 if we have any hope of moving higher here. But again, I think that oil has been extremely manipulated over the last seven months, along with natural gas. But again, the neural index strength is pointing down. We identify our price on open at 97.90. In order for this to turn bullish, we would have to clear that. But I would further argue that the predicted moving average is also below the monthly opening price, which tells me that oil is going to struggle here, especially if we have that pending US dollar strength.
Bitcoin
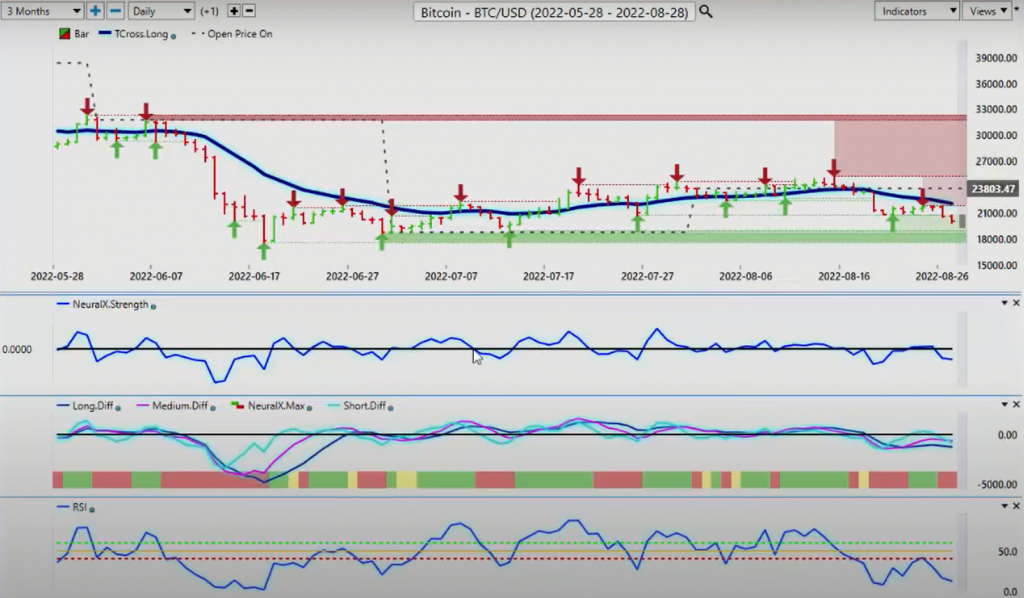
Now, Bitcoin moving lower at the time of this video, which is perfectly normal. But again, we’re looking for mid to late September to follow those seasonal patterns where there’s buying in Bitcoin. That’s when I would look for potentially the equity markets to turn around a little bit. But for now, as you can see, this is the month of August. We go back here to August the 1st. Even though we’ve had some very good rallies in Bitcoin, we’re still basically in a channel low between… Maybe I would argue a little bit lower around 17,006. It’s moved up a little bit here guys to about 18,680. That’s the level that I imagine we’re going to test before we go higher.
But we are still or I’m still looking for Bitcoin to play the seasonal pattern where it’s very strong mid to late September through to mid to late October, maybe early November, and then I’m not interested in it again. But for now, the indicators are definitely bearish. We’re below the monthly opening price. We’re below the T cross long. Our two key levels that we want to watch are right there, guys, 22,470, excuse me, 22,047 and the price on open at 23,803. Bitcoin remains bearish while below those two levels. That’s the two anchor points that I’ll use throughout the rest of this presentation and do a quick review of the month of August as we come to an end.
I’m happy, by the way, to end summer trading. I’m not a fan of the month of August to begin with. It’s been a choppy August, but September, October, November, December are very, very good trading months.
S&P 500 Index
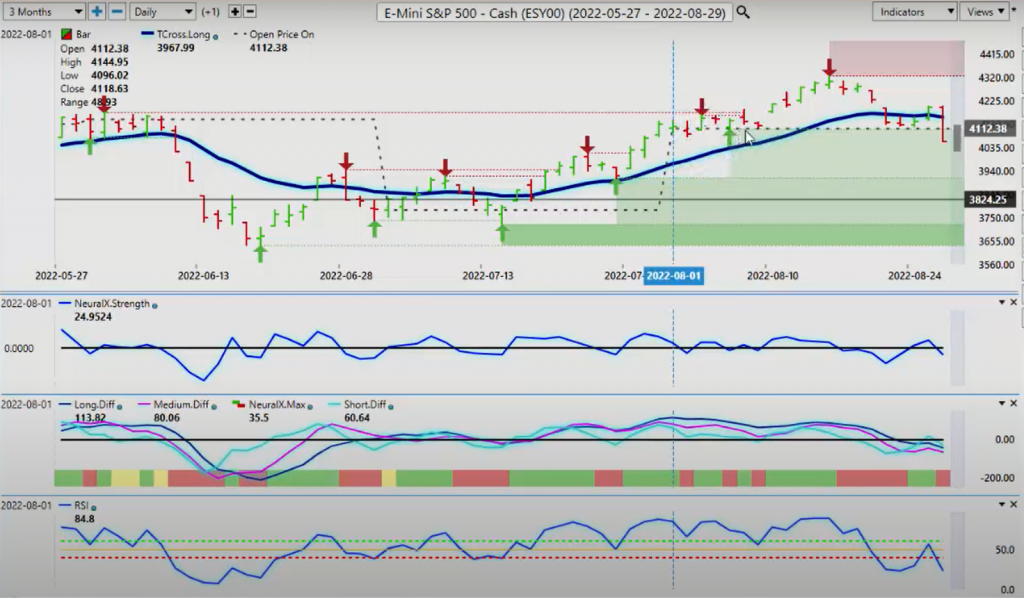
When we look at the one that everybody has their eyes on, which, of course, is the S&P 500, it simply was unable to make any significant gains. Once again, it’s a tall order with this dollar strength. When I’m looking at this right now or we do a quick review of the S&P 500, we look at the start of the month here. We had some bullish momentum that was building. We were holding above the monthly opening price.
The T cross long also moved above the monthly opening price. But now you can see we’ve slipped down below the T cross long and we’ve closed the week below the monthly opening price. My only concern is that equities tend to rally into the end of the month. Be careful around Wednesday. I could see this thing turning around just for fund managers. They’re wanting to show the best monthly percentage they can for their capsules, et cetera. We could see a relief rally there towards midweek, but right now, the two key levels we watch for next week, 4158 and 4112. These are our two main points that we would have to clear in order to start buying stocks again.
But again, if we know these levels ahead of time, then we know how to react to them. Some people, some of the direct clients of mine, they will put limit orders above, sit there and wait, because they only want to go long, but they’re not willing to buy in a down market. When it clears the VP level at 4158, they’ve got longs sitting there ready to go and they avoid whatever is going to happen on the downside. It could get ugly next week after Jackson Hole, so we shall see, but that is the main trade setup.
Euro versus U.S. Dollar
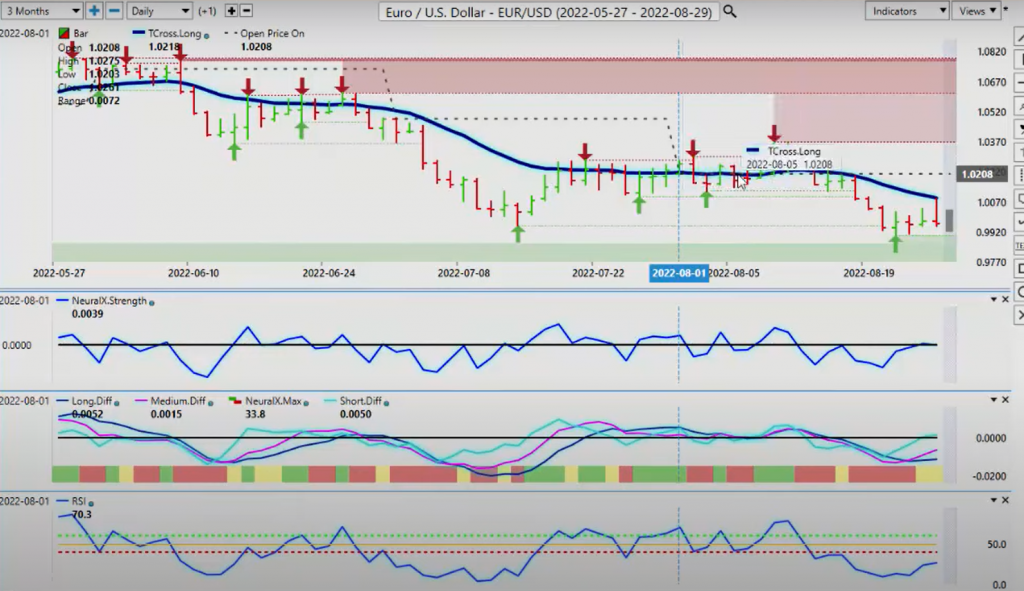
Now, when we look at euro-US and we look at it for the month, we can really get a good visual of what kind of month the euro actually had here.
Again, some buying in the early part of the month. There is basically I’m going to call this one the media bar, where the media started twisting the words of the Fed and he responded back. I could tell Jay Powell was a little angry when he came to the podium there on Friday. I don’t blame him because the media did twist his words saying they’re going to cut. They’re going to do this. They’re going to do that. He’s saying, “I didn’t say any of that.” Data dependent, we are still on track to hike is what he’s saying. As you can see, the euro immediately after that conference or the press release, the euro started dropping again.
When we look at this for now, you can see, again, the anchor points that I will use and provide for you guys can gauge it yourself if you want to have a trade set up like this, is the predicted moving average crosses over the actual monthly opening price. That leads… Again, it’s very difficult to script it because you can see the levels happening in there. I’ve removed all the other moving averages for this week just so we can focus on the one. I won’t do this every week, but I will do it just the same. Again, on Friday, like a moth to a flame, the market moves back to the T cross long and then an epic failure.
Again, there’s no other indicator around this particular level, and that level is 1.0090, just above the parity mark the second they got confirmation, we had a problem. But you can see that the MA diff cross here warns us not to actually keep selling it down here. When that crossed, it’s telling me that the pink line is the medium term trend, the blue line is the long term trend. That’s why the predictive moving average crossovers are not on my screen. I can see them via the predicted differences. When it crossed up, it tells me, okay, I’m not going to buy down here. I’m going to let it retrace and get back up to this level.
To begin the week, this is the level we want to keep our eye on. The main indicators are still net bearish.
U.S. Dollar versus Swiss Franc
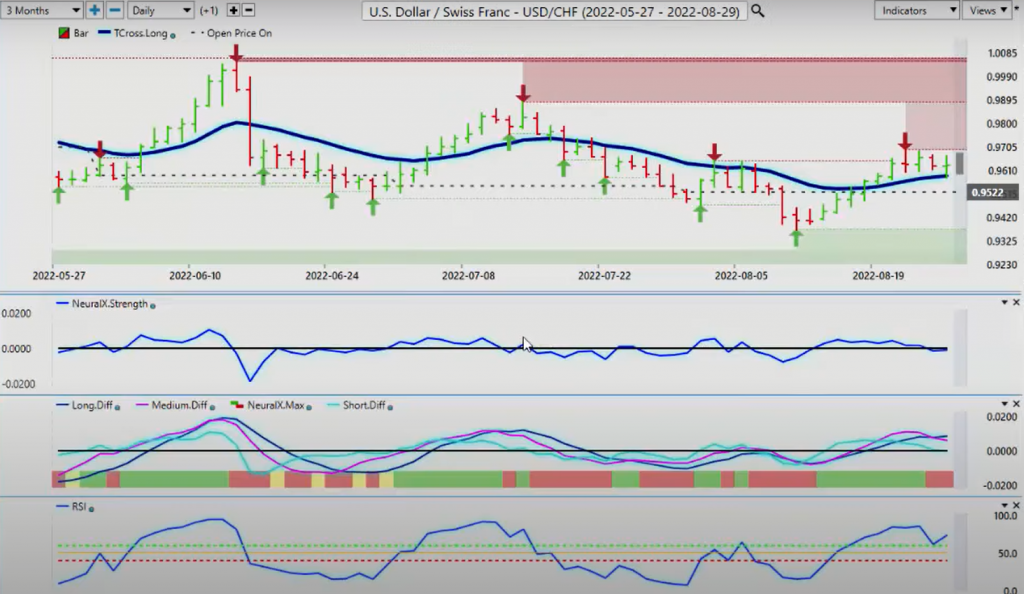
When we look at the US-Swiss franc, again, a dollar index trade, but the Swiss franc is still indirectly part of the carry trade, like the yen. But as you can see, when the market came up, that retraced back up to the monthly opening price. The VantagePoint predicted moving average was sitting right there. We closed above the monthly opening price and the T cross long. That’s what triggers longs here. There is zero lag in this particular setup, guys. Zero. Nothing. I’m not waiting for a crossover.
I’m not waiting for this. I’m not waiting for that. All I need is the condition to be met. I’m now positive on the month. Okay? I’m positive on the month. I’m above the T cross long, which is a trend defining indicator, that could be anywhere from 10 to 30 to 60 days while it’s above this level. It could be even longer on some of your stocks. But the fact remains that once it clears it, it retraces back to it and then gives me an entry point. If the predicted high and predicted low are not there, that’s not of any interest to me. This primary setup is telling me this is shifting. This trend or this push to the downside is shifting to the upside. That sends it higher.
We break the verified resistance zone. To begin the week, we have two main anchor points, our monthly open, .9522, our T cross long, .9588. Long while above these two levels. If it breaks down below there, you can actually have, again, a sell stop below the monthly opening price. If it breaks down, then you can cut your longs and go short, but you have an actual trade setup and a trade plan.
British Pound versus U.S. Dollar
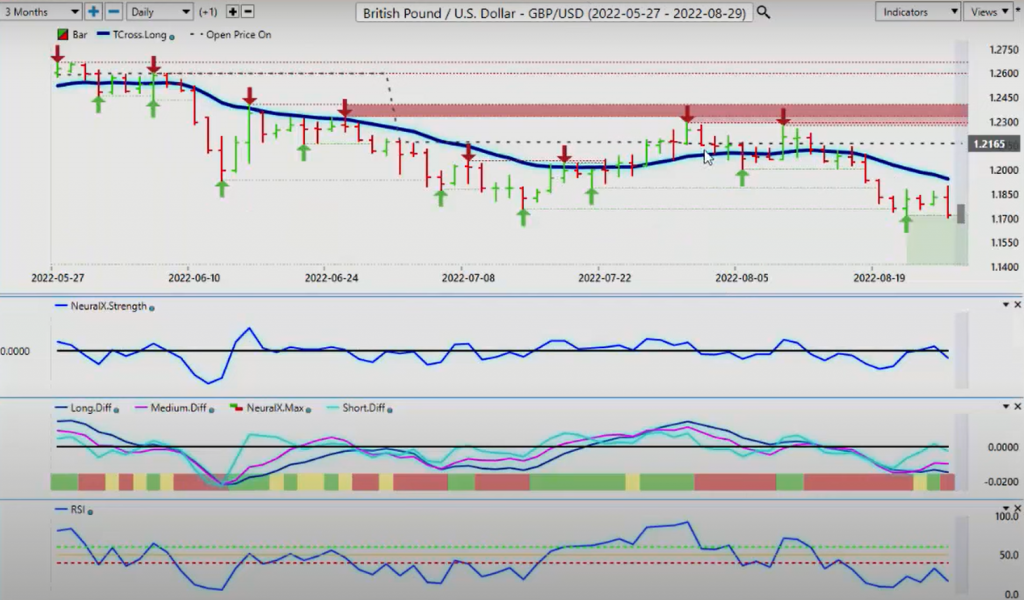
Now, with the pound-dollar, another very strong example of this type of trade setup here when we look at this. On August the 1st, you can see we’re running along the monthly opening price. This is a point in time indicator in the VantagePoint software.
That is extremely powerful when used with the predictive indicators. You can see that I’m running along here. There’s our media bar that threw the Fed, that really ticked off Jay Powell. Then you can see that they’re turning, they’re getting ready to exit dollar longs, or dollar shorts, excuse me. And then next thing you know, we slipped down and we’ve closed below the monthly opening price, but not quite the T cross long. But then we start to accelerate. I can assure you that up to a degree of about 85 to 90%, these same types of setups will form in September. I think it’s very unlikely it’s going to be long on the pound given the strength of the dollar, but it could be.
Either way, we don’t care as long as we have a plan. On September the 1st, we will have a new monthly opening. When I do the weekly outlook next week, I will be leveraging that monthly opening price with the core VantagePoint indicators. Right now our resistance for the week is the T cross long. 1.1945, and our monthly opening, 1.2165. Very often like a month to a flame, the market tends to retrace back to the monthly opening price or it can at the end of the month. These are our two levels, but this also will assist traders in proper stop loss placement, excuse me. Again, watch those two levels.
I could argue that your premium sell zone is between 1.1945 and 1.2165. We’re looking for a Monday-Tuesday type of reversal. I think if it sees any strength, that it could possibly be on Monday. And then on Tuesday or Wednesday, the real trend shows itself again. We do have strong verified support down here at 1.1717. But as you remember from the previous weeks, we’ve also broke major support at 1.1760. This setup is still bearish. The neural index strength is down. The reverse check mark there pointing back down on the predicted RSI, the predicted differences. The neural indexes, that looks like a stoplight right there, horizontal stoplight, yellow, green, red.
It’s ended in red, which tells us, okay, we just need to know those retracement points. Of course, you can use the predicted high and predicted low. I’m not suggesting you can’t, but I will suggest that that is a significant gap between the predicted high for the day, the T cross long, and the monthly opening price. That is too big of a gap for me to short down here. I want this to retrace.
U.S. Dollar versus Japanese Yen
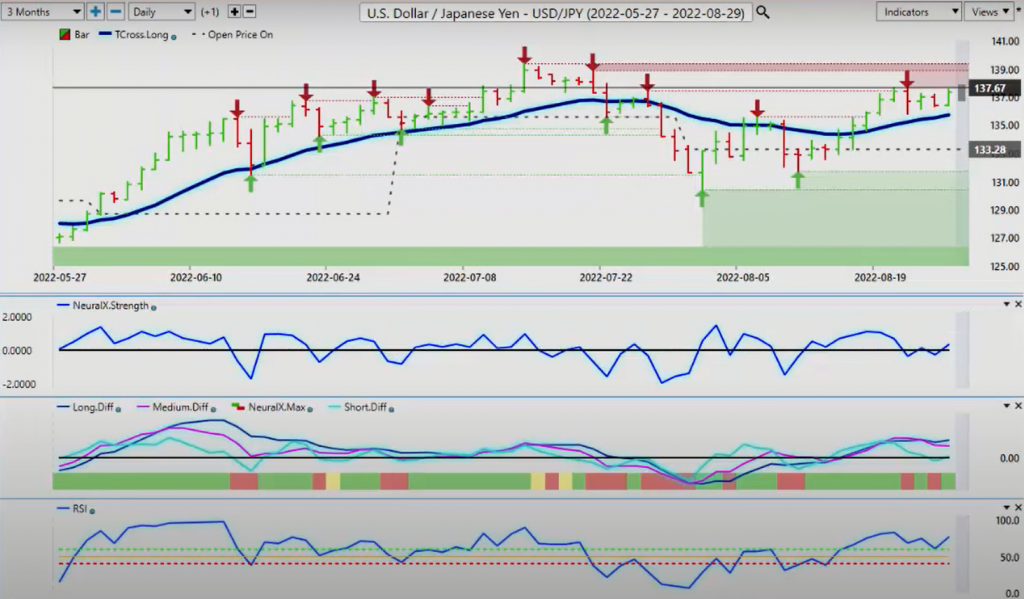
Now, when we look at the dollar-yen, the dollar-yen is truly on a month to month basis. This thing is basically all over the map here. It truly is. This is something I see all the time with the dollar-yen pair when we’re dealing with potential rate hikes, because the yen is part of the carry trade.
Essentially even if the dollar is weak, it’s probably strong against this pair because of the interest rate differential between Japan and the US. It heavily favors the US. Meaning somebody enters a long position, the brokers have to pay them a dividend or swap payment every day. They have to pay that times three on Wednesday. If big banks move a couple hundred million or a billion dollars into a long dollar-yen trade, that swap payment and that interest payment is substantial. And that is by definition, guys, for anybody who doesn’t know that, it’s the carry trade.
Right now, when we look at this, we look at this from the standpoint of what are our support levels to begin the week, our T cross long 135.74 and the monthly opening price at 133.28. Again, we would like to see the T cross long hold. And if it doesn’t, then the backup is the monthly opening price. The indicators are mixed here, but they’re still primarily bullish. Again, the seasonal pattern of the dollar in the month of September, it’s almost as good as your February and March. The dollar usually shines in the month of September. Just a warning and I’ve seen this many, many times before, you could have a bad nonfarm payroll number.
You could have a bad this, bad that. That is all noise, guys. If there’s real money is buying the dollar in September, then they still will continue to do that. The dollar-yen, just be careful with this particular pair. It’s certainly not my favorite.
U.S. Dollar versus Canadian Dollar
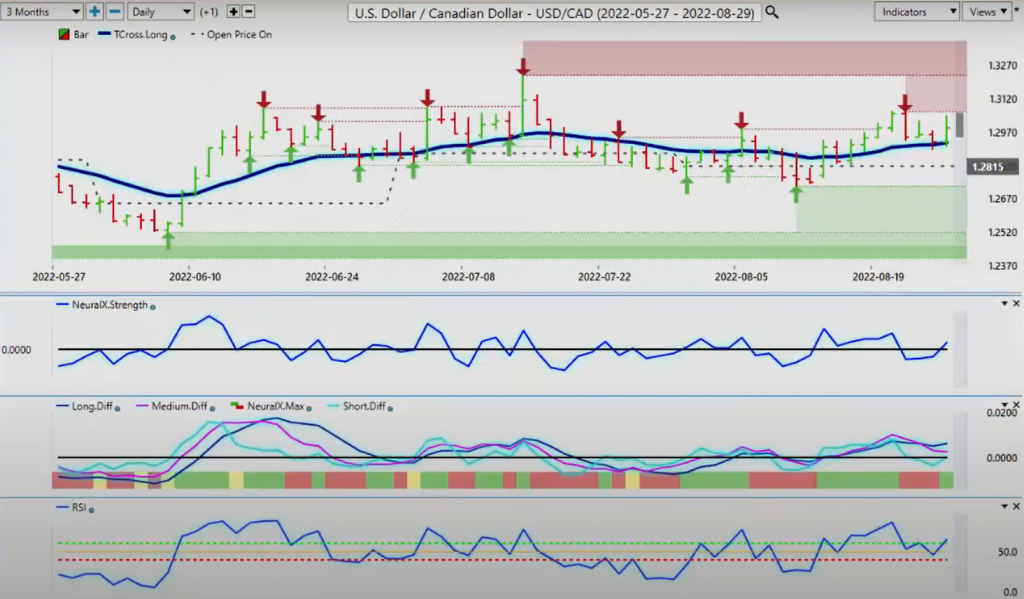
The US-CAD, a very, very good trading week on this. We were doing this in the VantagePoint live training room. Once again, just a really quick note on the Monday-Tuesday reversal, this pair, guys, is notorious for this. Whatever it does on Monday, it does the exact opposite on Tuesday 90% of the time.
You can see we had a rally up on Monday, then it gets hammered on Tuesday, leaving traders and investors scratching their head, only for the primary trend to turn around and go right back up. Again, we’re above our monthly opening price. That’s coming in at 1.2815. That assists traders with stop loss. The T cross long, 1.2921. Again, we were doing this in the VantagePoint live training room. I’ve advised with my own direct clients, you’re long while above the monthly opening price and a very good entry point last week is around the 1.2921 area. For next week, we’re going to be looking at this again.
But with the predicted moving average above the monthly opening price, that usually tells me we’re going higher. Neural index strength is up. Reverse check mark predicted RSI at 64.8. It warns me that oil potentially could be getting ready for a spike lower, same with the S&P 500 and the dollar index higher. Those direct intermarket correlations, guys, these are things you want to learn. There isn’t that many of them. Just the main ones, the really big ones, dollar to equity, dollar to gold, dollar, dollar, dollar is what this comes down to. Again, we will watch these levels next week. The gap on the predicted low is not horrible, 1.2950.
The T cross long again is coming in at about the 1.2920 area. That type of gap I can live with. And then all stops should be based on your own money management plan. Hence, the risk disclosure in the YouTube channel here. But always make sure that you’re not over leveraging and you’re keeping that leverage in check, because again, most currencies moving 1% of their value per day max. That’s it.
Australian Dollar versus U.S. Dollar
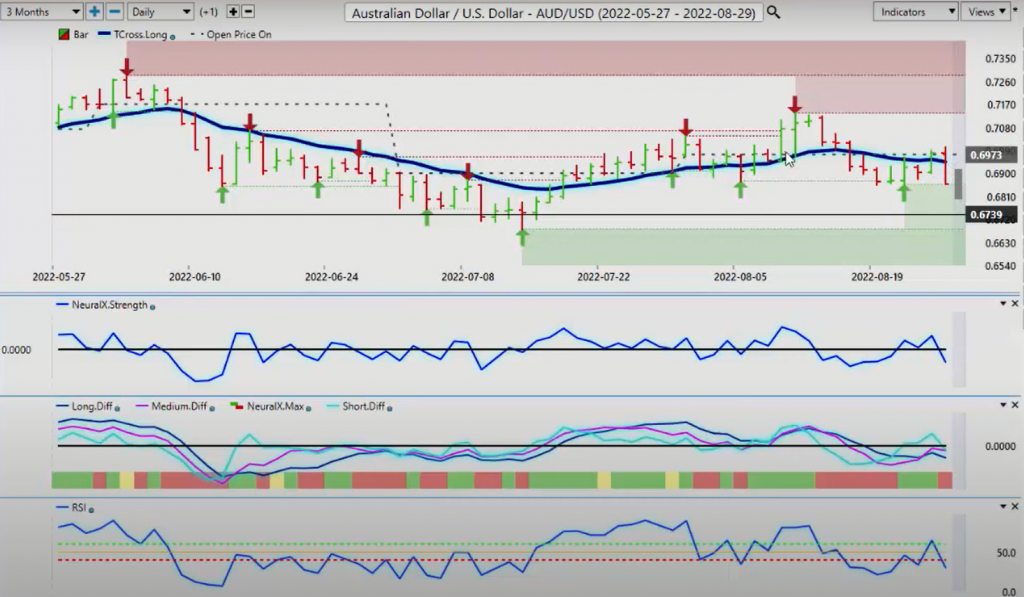
Now, the other two main equity based currencies, Aussie-US and New Zealand-US, we can assess here that once again, they had some bullish momentum at the beginning of the month.
But soon as we moved too far away on that media bar, again, the media caused this, the Fed caused this volatility, that it moved too far from the predicted moving average and that mean revision theory kicks in and down it goes. But the real trade here, guys, this is the one right there. The market closes below the monthly opening price and the T cross long at the exact same time. When that happened, that led to a substantial downside move. Now, again, you can see it happening up here again on Thursday and Friday last week. Now, the main indicators are again mixed, but they’re again pointing down.
We’ve got a verified support low that I can warn you about, that’s .6870. If we get a sustained break of .6870, then it’s reasonable to suggest in the month of September, we are likely going to target the low back into the .6746 level, but we immediately need to deal with this particular level. That’s the one we need to watch. We’ve had a full retracement back up and a massive sell-off back down, which is likely to continue into next week.
New Zealand Dollar versus U.S. Dollar
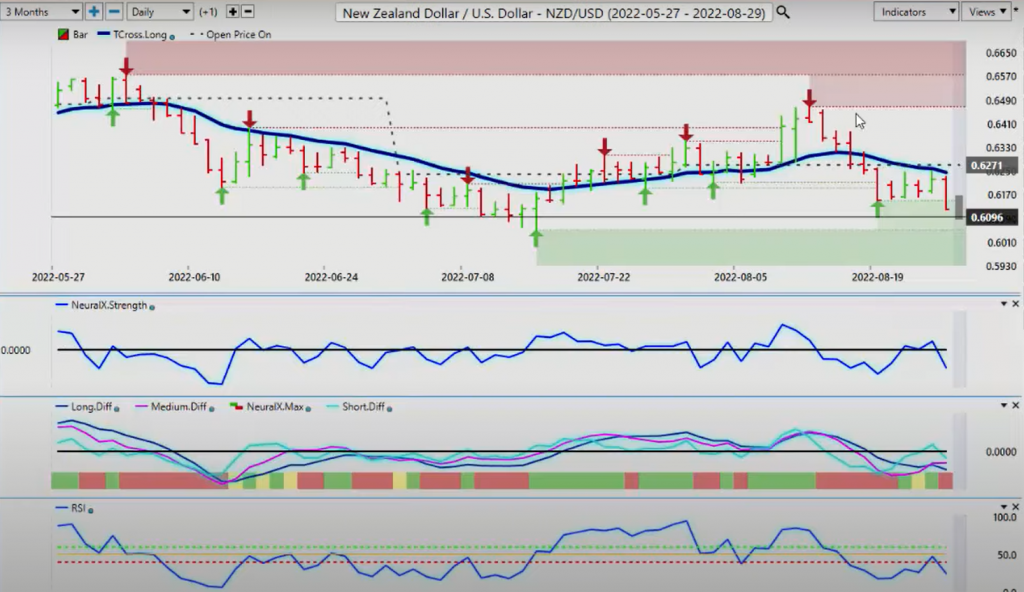
You will see the same thing with the Kiwi next week. It will follow New Zealand, the same predominant move in the middle of the month, only to turn around.
The second the market closed below the T cross long and the monthly opening price, we got the confirmation we were actually looking for and down it went. I would further argue that we can see things like this, the MA diff cross had warned us one day after that, but this is still higher risk because the stocks could have gone higher. The Fed could have flopped. But ultimately, he didn’t. He held the line and he plans on hiking. Once again, we are going to have a very choppy end of the month, and I’m sure that there’s going to be lots of fireworks in the month of September, but with that brings opportunity. With that said, this is the VantagePoint AI Market Outlook for the week of August the 29th, 2022