


Welcome to the Artificial Intelligence Outlook for Forex trading.
VIDEO TRANSCRIPT
Hello everyone, and welcome back. My name is Greg Firman, and this is the VantagePoint AI Market Outlook for the first week of August, 2022. Now to get started this week, we’re going to begin with the very, very important US dollar index.
U.S. Dollar Index
Now what I’ve stated in the last couple of presentations, that essentially it’s been the dollar up and all the other markets down, the inverse correlation to the dollar. But some of those primary inverse correlations have resurfaced again with the S&P 500, oil, gold, and most of your forex pairs. So when we look at this now, once again, an excellent article in the VantagePoint blog about the fed causing this excessive volatility. So now Powell is flip flopping, or pivoting, which I had forecasted he would probably do anyway, come November on these interest rate hikes. But it is causing a lot of volatility in basically all markets.
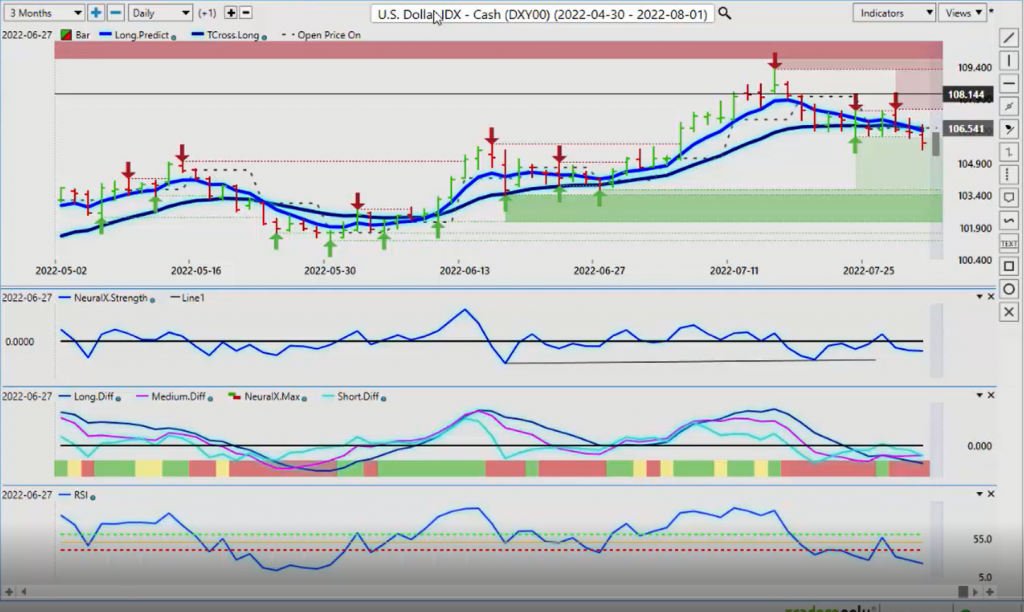
So when we look at the week on the dollar, dollar failing miserably here again. But when we look at this in Friday’s price, the verified support low coming in at 106.11, we’ve lost that level on a Friday, but you can see the bulk of the week it’s been holding. So my optimism on further dollar losses remains guarded. Usually we have a dollar cycle around the beginning of the month, which is not always that prevalent in the month of August. August is a very slow month. Now I can’t say for sure it’s going to be that way, with everything that’s going on, with Russia and all these different things. But again, we will have to see what the month of August brings, but for now the primary trend on the dollar is shifting to the downside. Our T cross long 106.52. This is the level that you want to keep your eye on, to begin the week and for the better part of the week. Because again, if we can retake that, then the dollar would still have life in it.
But in my respectful opinion, only the dollar is grossly overvalued against most of your currencies across the board. So again, I’ll be watching that, the primary indicators in VantagePoint are still down, but there is a warning sign here from that MA diff cross showing that the dollar could be getting ready to turn back up. Now, again, my viewpoint here is that the price was… You’ve got some profit taking on Friday, a lot of things still benefit the dollar, but again, I think it has to come down a bit further. I would potentially be looking at these breakout points. Now this was a significant breakout point at this high of 105.78. So again, you can see how that’s kind of intersects with what’s going on up here right now. So again, if we can hold below the VantagePoint T cross long, that would be the first step. That’s coming in again at or about the 106.52, but we would also need to break down cleanly under 105.80 in my respectful opinion. And the indicators are very mixed around this.
And of course that’s largely being caused by the Fed. Now after the Fed’s comments, or after he’s flip flopping again all over the place, gold immediately responding to that. You can see that we’ve come up to our T cross long on Wednesday after the Fed, but then we had some follow through on Thursday and Friday as we pushed higher. But I would argue that gold had a fairly bullish tone to it to begin the week, when we look back here to Monday. We can see our Monday price bar, we’ve moved all the way down, but there were no further losses on gold. Which is surprising considering that the Fed was talking about excessive right hikes, or an excessive right hike.
Gold
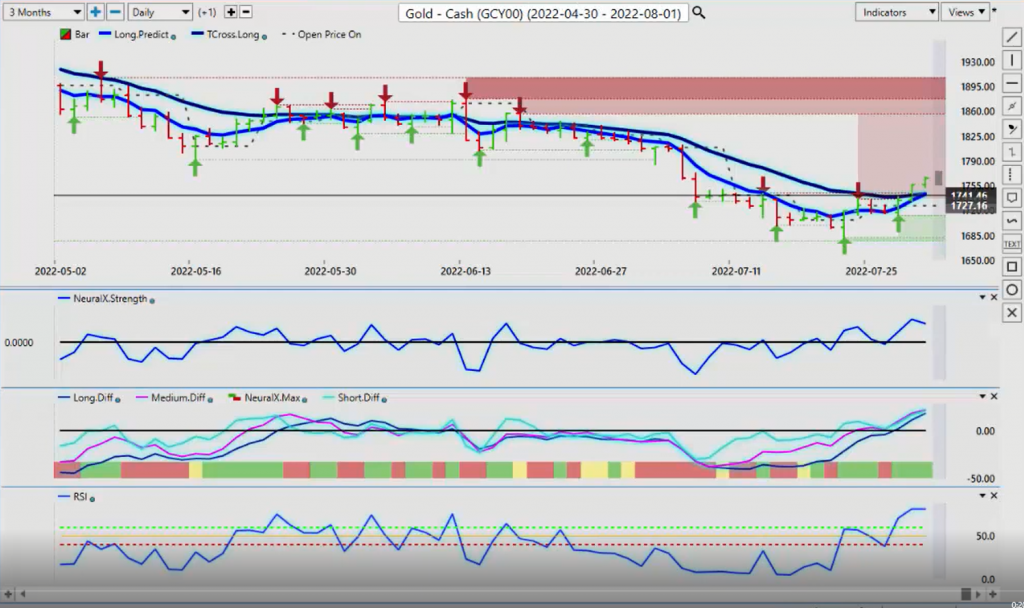
Some people even calling for a 1% hike. Of course we didn’t get that. And he is insinuating that you might not even get another one at .75. So we’ll see. But for now, gold is extending higher. So we look at this inversely to the dollar index. This is now gold has a support low, that’s all tangled up here, 1743 and 1743 on the T cross long. Both levels there, so if this is a true break on gold, then that level will hold next week and we will extend higher from there. Now, again, if the US is going into a recession, 70 to 80% of the time, gold goes higher in a recession here. So this trade does make sense. We will continue to monitor it, but for now we need our line in the sand. And that line in the sand is 1743.
We need to continue to close above that level if further longs on gold are viable.
Crude Oil
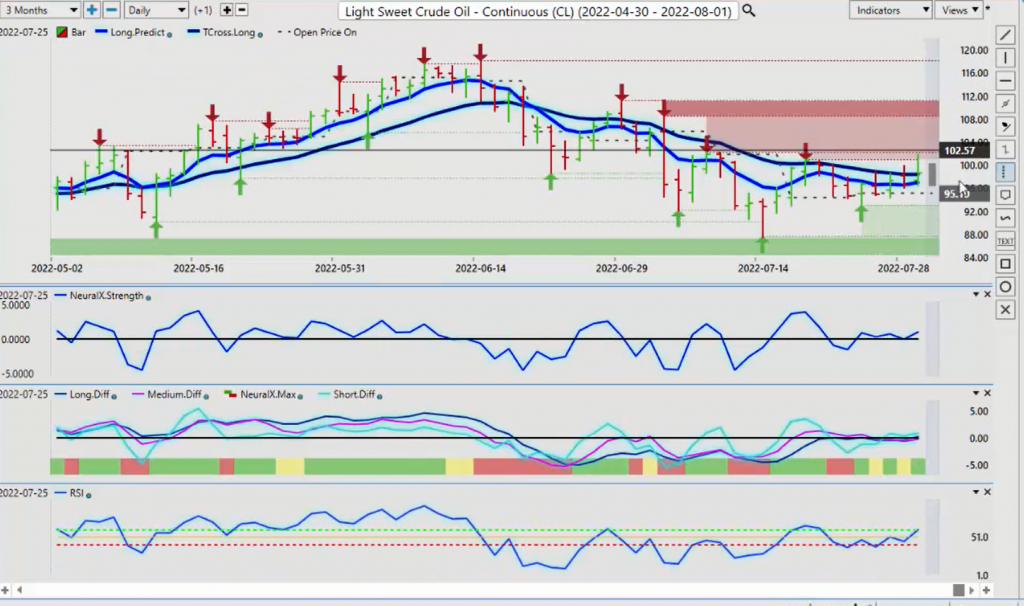
Now, when we look at oil, oil getting a boost from a very good week in the stock market, it just seems like it was just a matter of weeks ago when they were calling for 3,200, 3,500 on the S&P. And of course we didn’t get anywhere near there. The S&P went completely in the opposite direction. But that has helped push oil up a little bit. Going into next week, once again, our T cross long 98.31, and then we’ve got 96.99 on our long predicted, which provides that additional support here. So again, if oil can stay above these levels, then we would be looking for probably another test of at least the 100 level. Our indicators here, our neural index strength, our neural index itself are both positive.
The predicted RSI 60.1. Now the RSI here has been modified to a nine period, and I’ve used a 60/40 split because I’m not looking for any kind of play on overbought or oversold or accumulation distribution. I’m looking for momentum in the market. Trading these types of market, obviously we have consistent momentum. So as long as we’ve got that momentum building, then oil still has a shot of going higher. But again, I think that if they can start job owning us a little bit more, then we could see oil push down lower. But again, as long as we know our main levels, we can react to that.
S&P 500 Index
Now, the S&P 500 has had a very, very good week, to say the least. And you can see how we’ve had a… And I often talked about this at the VantagePoint seminars and in the live training room and here on the YouTube channel. Is you have this Monday, Tuesday reversal.
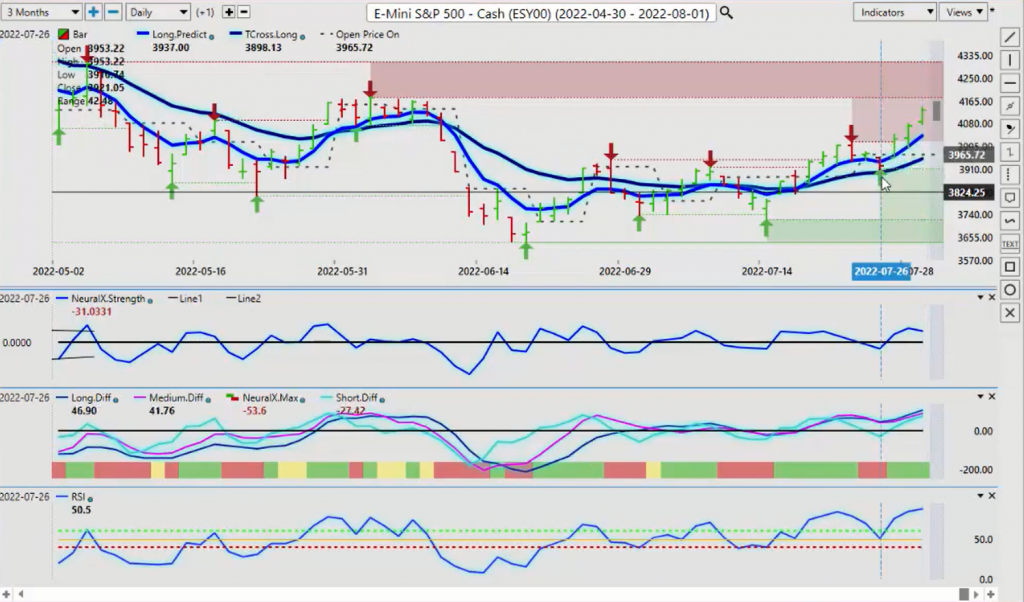
So we have a popup on Monday, then we have a selloff on Tuesday, and then the real price starts to show itself. Now that’s with some assistance from the Fed, of course, but we are moving higher. My concern going into next week that yes, we’ve had a very good week on stocks, but we do have 41.77 as a verified resistance zone. So we must clear that. Now what I also did in last week’s presentation is shown the currency pairs that respond very, very well to a positive stock market, the Aussie, the New Zealand, the CAD. So if we fail at this high, and the S&P 500 subsequently turns lower, then those currency pairs like Aussie US will go lower, New Zealand US will go lower, US Canada will go higher.
But if stocks break through here and continue to advance, then those are still going to be good places of value to sell US dollars. But again, the indicators right now are decent. My little bit of a concern here is the neural index strength is not advancing. Now, the neural index strength is a window inside the actual neural index. You can see we’ve got the standard green and red, one being up one being down. But the neural index strength really lets us see into that to see if we’ve got momentum building there. And the slope of it is something I watch. And I find that after that big day on Friday, we are sloping downward on there. So then that’s a little bit of a concern when we attach that to a verified resistance zone. The verified zone is a failure point in the market.
There’s nothing to debate, the market failed at that high, where we’re tracing back up to it. Now we need to push through this. Now, with once again, one of my favorite trades in the month of July and again in September is of course, Bitcoin. Now once again, with Bitcoin, we’ve had solid buying down here. When we look at the seasonal pattern in Bitcoin, it usually does very well in the month of July. And it does very well from mid-September into about late October or so. These are two of my favorite times, you can see last year at this time, the same thing happened. We had a big rally up.
Bitcoin
Now, the Bitcoin is about 95% correlated to the S&P 500 and the NASDAQ, obviously. So this can also be considered a leading indicator as to whether stocks are really going to go higher through that 4177 mark.
So this level up here at the high, we want to keep a very, very close eye on this level. Because again, if we can’t break through it, that could indirectly warn us that we’re going lower on the S&P, there could be multiple trades spinning off if Bitcoin turns down, or if it turns high. The level next week you want to watch is 24,243. If we can break through this, then that would tell me that the stocks are healthier than what we think they are. Still in a down trend in 2022, but we could see some life. So I would advise to keep a very, very close eye on Bitcoin to see what it actually does here. Because as I showed you in last week’s presentation, there is about a 95% positive correlation between the S&P, the NASDAQ, and our Bitcoin contracts.
But again, when we look at it into this week, we always want to make sure we’re identifying our two major support levels, our long predicted 23,123 and our T cross long, the big one, at 22,419. As long as we’re holding above that, the seasonal pattern in Bitcoin still is indirectly pointing towards longs.
Euro versus U.S. Dollar
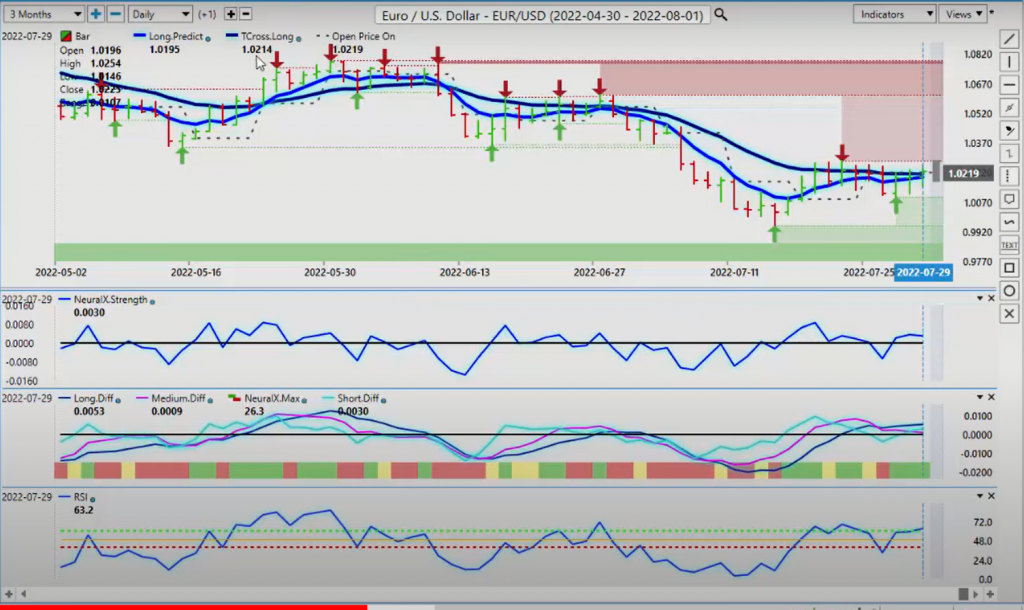
Now, with this week that’s coming up in the forex market, once again, the Euro out of the G seven currencies, most of your G seven currencies, your Aussie, New Zealand, your CAD, British Pound, they all were pretty tough on the dollar this week. So was the Swiss Frank and the Japanese Yen, all making gains against the dollar. But I would argue that the Euro really didn’t do that well. Their CPI numbers or the Euro zone, a lot of that stuff, but we did close slightly above that T cross long. But it’s not enough to really, at least not yet, to get aggressively long, the Euro.
Now that T cross long is 102.14, we’ve closed at 102.25, but we have a strong verified resistance high also coming in at 102.78 that must be breached. If we can’t get above that, then clearly the Euros in a down trend, I would certainly not dispute that. But there’s building support here. And that support low from last week, that’s coming in once again, down around the 1.0097 level. And we’ve again, rallied off this, but the indicators are mixed. What I do find interesting, and I don’t see this very often, where we’ve got an MA diff cross to the downside, but positive neural index. And then we’ve got the RSI suggesting we’ve got momentum building to the upside. So one of these is not… Something’s a little bit off here, is what I would argue. And the MA diff cross from VantagePoint, what I would argue is it’s very seldomly wrong. Warning that we’re likely moving lower.
So again, be very, very cautious and just understand that out of all the G seven currencies, the Euro is clearly the weakest against the dollar. Not that there aren’t good long trades there, but shorts clearly have been working very, very well. Using that T cross long as a pivot level, they’ve worked extremely well. So in this particular case, we’ve got our T cross long coming in at 102.14, but we have a verified resistance that’s basically controlling the market right now at 102.78. If we break through that, then you’re going to have a pretty decent run I would argue, potentially over the coming months, maybe towards the 106 level. But this is the level right here, guys. So obviously shorts are a reasonable play here, but I would’ve a buy limit order ready to go just above 103, maybe 102.80 in case this snaps in here and we go higher.
U.S. Dollar versus Swiss Franc
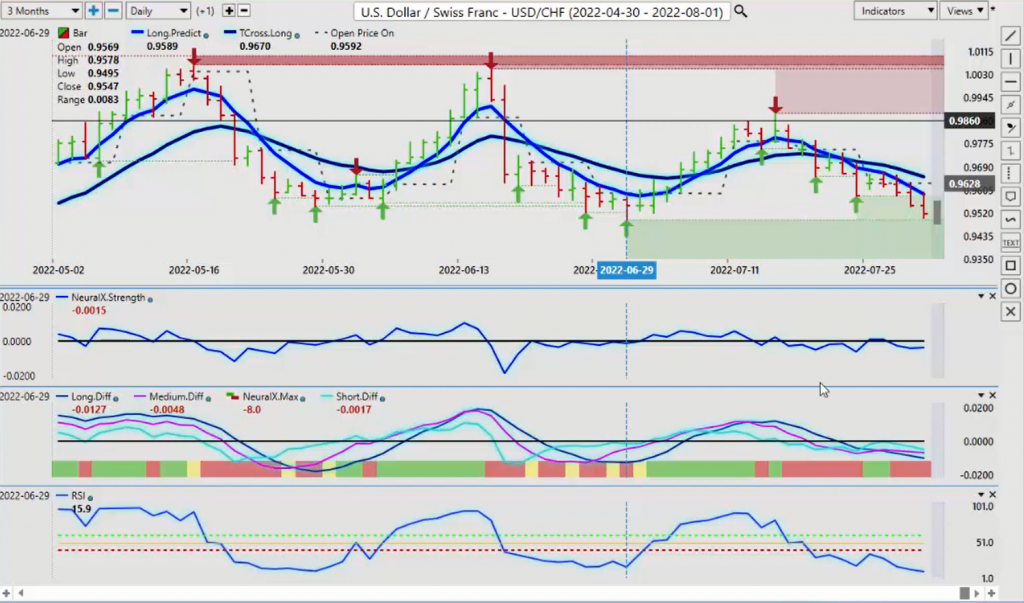
Because clearly the Fed is pivoting all over the place here. Now with the US Swiss Franc for next week, still the dollar losing considerable ground here against the Swiss Frank, after they finally hiked 50 basis points, the Swiss National Bank. But we’re coming down into another verified support low at 9495. Be very cautious with shorts down here. Because again, you’ve got that MA diff crossing to the upside warning of dollar strength. We know there’s a cycle in the dollar where it’s strong at the beginning of the month, into the first week of the new month. And the dollars predominantly been… You can pretty much time it when the dollar is starting to turn. It’s right around the middle of the month, each month. Do we really believe that this is a coincidence over a three month period that the dollar failed around the 15th of the month?
This is a monthly pattern that I have seen for many, many years here guys. It’s not a perfect pattern, but it’s a pattern just the same. You’ve got buying into the beginning of the month, we get to the middle of the month and down it goes. There’s a potential for a turnaround here in dollar strength with this particular pair. The warning sign we do have is again, is that MA diff cross. I will be monitoring it through the week. But again, there’s just as many reasons for the dollar to go down, as it is for it to go up.
British Pound versus U.S. Dollar
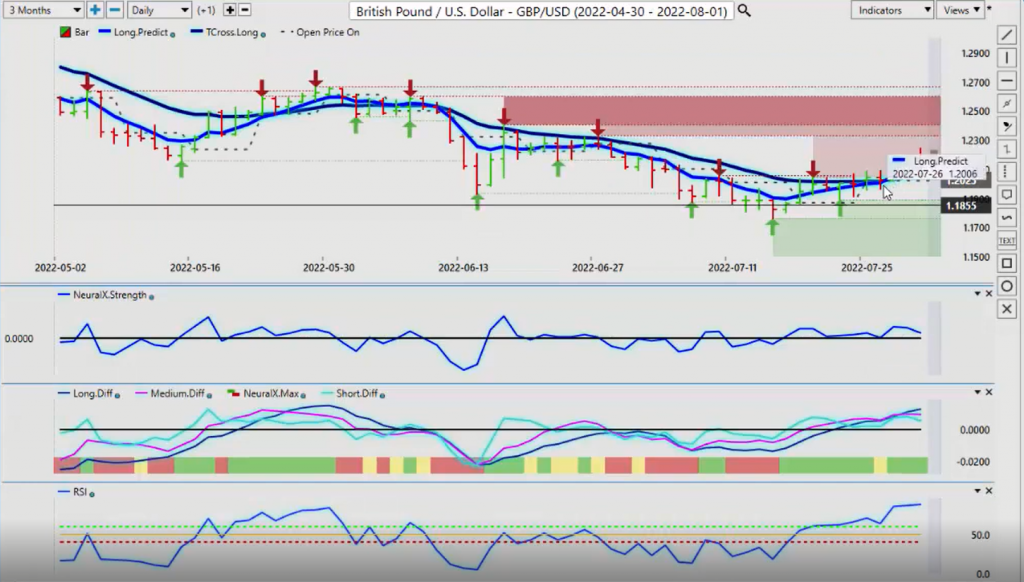
Now, the Pound dollar has made its move this past week against the dollar again, but some pretty heavy selling on Friday. And once again, this is a very different way of using the VantagePoint software, but using that T cross long as a pivot level, despite what the predicted high and predicted low, they’re fantastic tools, but this is always the line in the sand for me.
So we came right down to that several times last week, we had this big rally up right off the T cross long. Then we kind of went sideways. Then we went up a little bit more on Friday and then crashed right down. But once again, this is not a coincidence. I see this on a regular basis, stocks, futures, commodities, it doesn’t matter. The T cross long is used the same way. So I’m sitting there on Friday, just basically cherry picking this saying, okay, well, my T cross long is, or when VantagePoint’s T cross long 120… I think it was 120.88 is what the reading was for Thursday night for Friday morning’s trading. So we get slammed all the way down there and soon as it hits there, it completely reverses off of that. So again, this not only will help you with your entry point, but it will also help you with proper stop loss.
I don’t use the predicted high predicted low for stop loss basis, always the T cross long or the verified zones. Because I don’t want to get caught up in this intra day nonsense. And there certainly is a lot of it. So right now, again, a bit of a concern here is the level of the predicted RSI. The MA diff has crossed, the slope of the neural index also is concerning to me, that the British Pound is still in a big down trend here, guys. There’s no disputing that. So we look and we draw our line in the sand to start the week. 120.65, as long as we’re closing above that, we still have a shot of moving higher towards the 123.32 area because the good news is we don’t have to deal with a Fed again until September. So the nonsense from these guys is put to the side for now.
And it allows… August is usually a very slow month either way, but at least this will get the Fed out of it for now. So we do have the possibility, particularly how it’s spring boarded off of this on Friday, there’s still hope that the dollar will lose further ground against the British Pound and ultimately push higher. Now with the dollar Yen, the dollar Yen, once again, at least with my own client group, I’ve warned them against this because the dollar, again, is very similar I would call it to the housing market in Canada. The housing market has just gone parabolic. It’s gone crazy. Small houses selling for a million dollars, but that has stopped. And soon as it’s stopped, people are starting to realize after COVID that a lot of things are grossly overvalued here, and they’re not willing to pay it anymore.
U.S. Dollar versus Japanese Yen
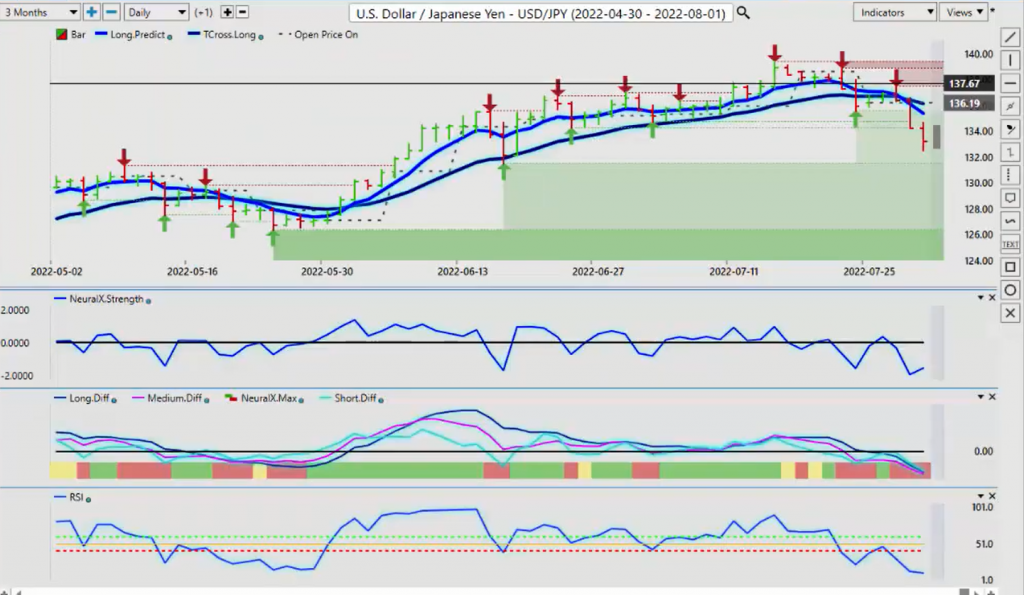
We are definitely running out of buyers on dollar Yen at this 135, 140 level. I would still argue that this pair had no business being at these levels to begin with, despite the Fed rate hikes. Even when the US was at 5, 6% in their interest rates, the dollar Yen was not at these levels, and it certainly didn’t make a move at this kind of speed. So once again, that volatility from the Fed. But starting next week, your key levels, again, 136.13, 135.38. This is a crossover using the long term crossover or the F 8 on your VantagePoint software crossing over the T cross long. So again, it’s a modified crossover, but I’m using my two favorite predicted moving averages, the long predicted, the T cross long. And I’m using them as pivot levels because there’s zero lag in using them as a pivot level.
So the market, I know exactly what those two levels are. The indicators are negative saying it’s going lower. My bit of a concern is this reverse check mark. Every time I’ve seen that, it’s come back to life. Now full disclosure, the carry trade is still very much in play here. The bank of Japan is not hiking. The US is still, the Federal Reserve, is still hiking. The interest rate differential between the two countries clearly favors the US dollar here. So I think that probably our verified support low of 130, 149 is in the cards. And we may see buyers reemerge down at this particular level. Now the US CAD, once again, like Aussie and New Zealand, this is an equity based currency in my view. Yes, it is affected by oil, absolutely. But if the S&P 500 is doing well, so is the Canadian dollar, guys.
U.S. Dollar versus Canadian Dollar
Australian Dollar versus U.S. Dollar
So is the Aussie dollar.
New Zealand Dollar versus U.S. Dollar
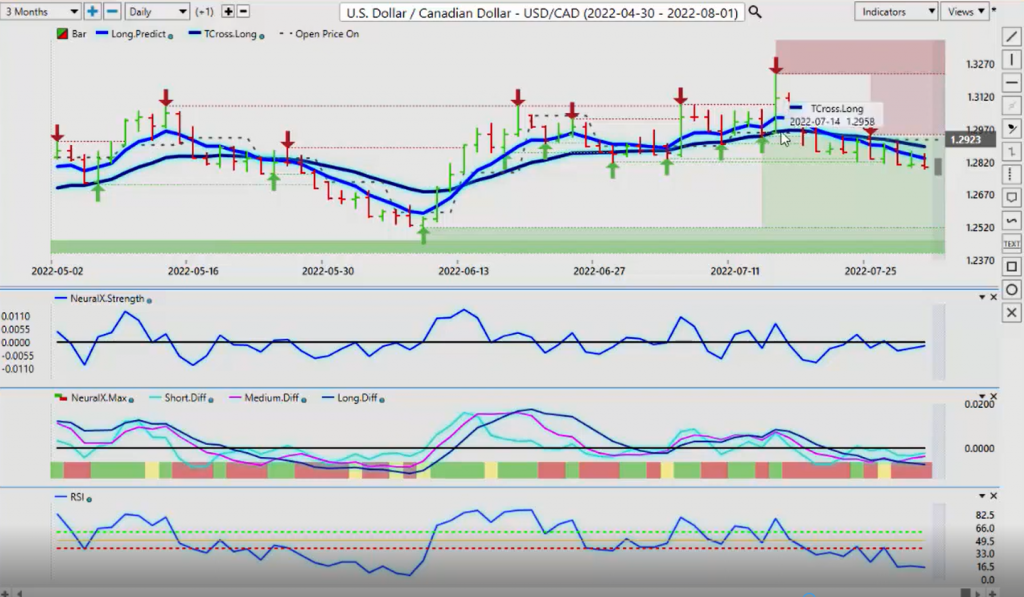
So is the New Zealand dollar. So right now we do have a separation in the predicted differences. Now, the predicted difference measures the medium term crossover against the long term crossover. So it’s not single market analysis. And that is starting to rise, which is again, a warning sign for me. We’ve had major support at 128.19. We’re closing a little too close for my comfort here, to be perfectly blunt. That little bit of a close below that verified zone is still concerning. Because again, the predicted, the neural index strength is starting to turn back up. We’ve got an MA diff cross. This is warning me that, again, the stocks may not be as strong as what we think they are. But if they turn lower, US Canada will turn higher. So for next week, our key level 128.89, 128.38. We must close two days in a row above 128.89 if we want to even consider longs on this to be viable.
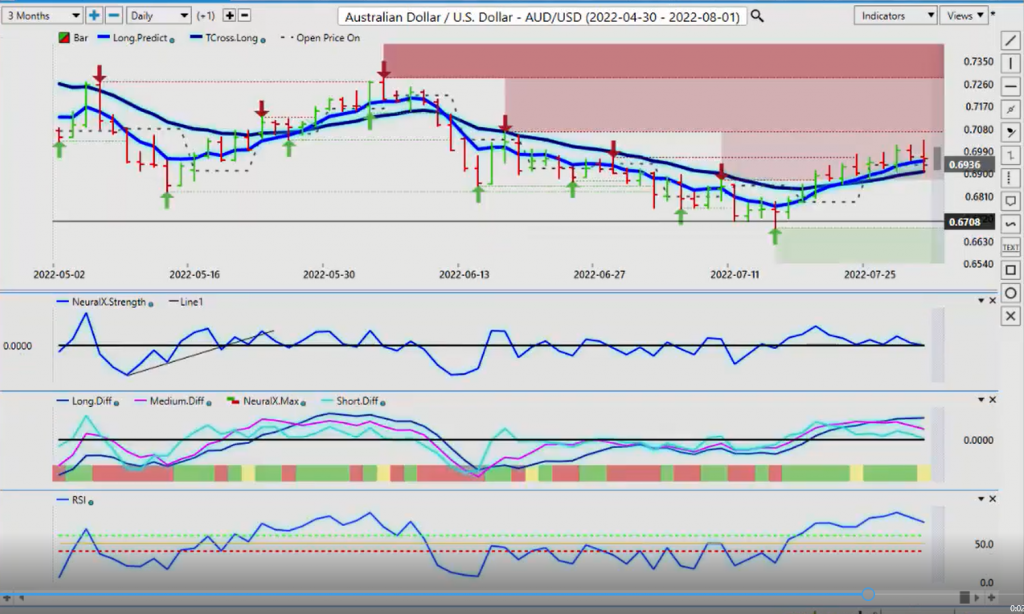
So as long as you know that level, then you can patiently wait. I do anticipate, if nothing else, we will come up and test this level, if nothing else. Now, when we look at the Aussie and New Zealand for next week, once again, the Aussie will follow inversely to the CAD. So if stocks are going well, then this will be doing well also. But once again, despite that strong move on the S&P 500, Aussie closed down, even though the S&P closed up. Again, using direct intermarket correlations can show you what’s could be happening across multiple markets, not just one. So the Aussie needs to keep going, and the Aussie needs to hold above 69.07 next week. If we can’t hold above that, then the dollar cycle is in full display.
And meaning that the dollar will go higher into that first week of the new month. Now I should also forewarn everybody, there’s a holiday in Canada on Monday. So that’s going to affect your oil markets. You’ve got the Bank of Canada coming up. You’ve got a lot of things going on that can indirectly affect the Aussie in the New Zealand also. But right now, 6907 is our key level. Our indicators are, again, warning that this is not strong. The slope of the predicted RSI, the slope of the neural index strength. We’ve got an MA diff cross. Our neural index has gone from green to yellow, just like a set of traffic lights, guys. The yellow means caution, so that’s exactly what I will advise. But this level is the one we really need to take over 70.69. If we can get above that and start pushing higher, then and only then can we start looking at getting back up into the 72, 73, 74 levels.
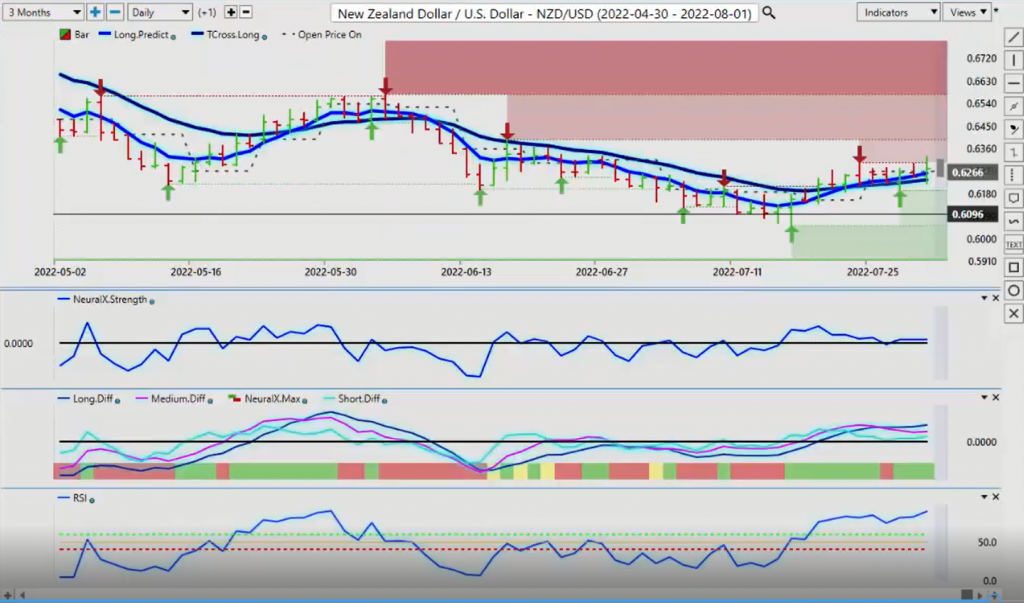
I believe that’s possible. I just don’t think that’s going to be into the third and fourth quarter, meaning more towards the September and definitely towards late November and December is a very poor month for the dollar. Now the same thing would apply with New Zealand, basically the same trade here you can see, but once again, we’re getting tangled up on the July 22nd verified resistance high. We need to push through here. You can see that little bit of a bull trap right there on Friday as they pushed above it. But ultimately we closed below that level. So our T cross long that’s coming in at 62.33, this is the level that we need to hold. Or, again, if we break down below that level and we close below it two days in a row, then there’ll be another good short trade here. But in my respectful opinion only, the Aussie and the Kiwi are grossly undervalued, grossly, grossly undervalued.
So again, just because something’s very low, doesn’t mean it’s a good buy. We’ve all seen that with penny stocks and everything else where it’s such a cheap price on a stock, but then the stock gets de listed. So we always have to be cautious, but as long as we know our levels and our inner market correlations, we can definitely navigate through these very choppy, volatile markets. So with that said, this is the VantagePoint AI Market Outlook for the week of August, the 1st, 2022.