


The Hot Stocks Outlook uses VantagePoint’s market forecasts that are up to 87.4% accurate, demonstrating how traders can improve their timing and direction. In this week’s video, VantagePoint Software reviews forecasts for Scientific Games Corporation ($SGMS), Gamestop ($GME), Ford($F), Interactive Brokers ($IBKR), and DRD Gold ($DRD).
Register for a Free Live Training
Hello again, traders and welcome back to the Hot Stocks Outlook for May 28, 2021. Hope you all are having an excellent week out in the financial markets, and as always, plenty of opportunities to cover here today in today’s outlook. We’ll start out with shares of Scientific Games Corporation. We also have GameStop, Ford Motor, Interactive Brokers and lastly, DRDGOLD here. So starting out with shares of Scientific Games. What we have here is daily price action. And regardless of the forecast if you’re using VantagePoint, every forecast works the same and utilizes that end of day daily price action data. And what you have right up against those daily bars is you’ll see that there is a black line and also a blue line there.
Scientific Games Corporation ($SGMS)
Now the black line that you’re seeing is a regular simple moving average. So a very common technical indicator. In this case, it’s looking back over the previous 10 closes, adds those together, divide by 10. And simple moving averages act as a good measure of where market prices have already been because it’s going to smooth out that price action and really let us know what’s the average price where things have been trading at.
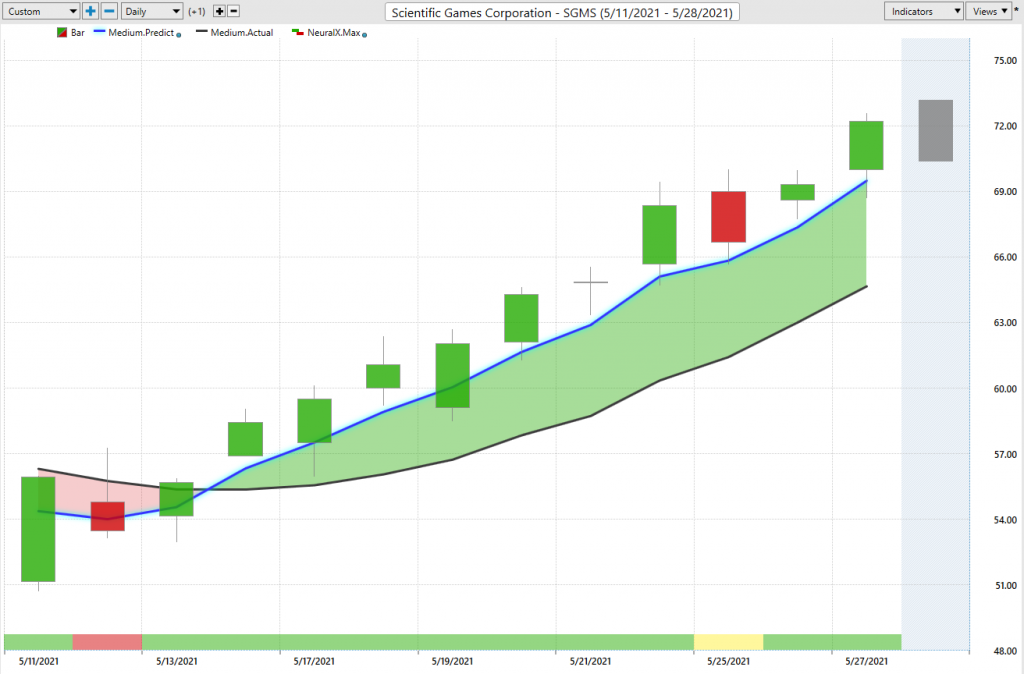
But obviously a trader needs to understand where’s the market likely to go moving forward, not where it’s already been. And so what VantagePoint traders are able to do is compare that black value or that lagging simple moving average to this forward-looking what we call a predicted moving average. And so for that value to get plotted and calculated against the chart each and every trading day, VantagePoint is utilizing its technology of artificial neural networks to do that intermarket analysis approach. That means that it’s going to look at the S&P 500, the Dollar Index, ETF groups, interest rates, global currencies, commodity prices. And it’s able to use that information and actually generate a prediction for where average prices are headed into the future. Not like a simple moving average that’s just looking at the past, but a true prediction of where our average price is likely to go.
And it’s able to take that data and use it to construct these indicators. So turning what was a lagging tool, that’s only summarizing the past into a forward-looking predictive tool. So whenever that blue line crosses above the black line, it’s suggesting average price are going to start moving higher. Therefore, most likely your trading strategy call is to go ahead and take a long position. Now at the bottom of your chart you see that there is a green bar and every day as well, this will get updated either green or red. And what it’s doing is it’s actually an indicator predicting the next 48-hour window for very short-term strength or weakness.
So this is also utilizing that technology of artificial neural networks, but it’s designed and tuned to specifically look at a very short-term period just 48 hours into the future. And this often really helps us as identifying some higher highs or lower lows over the next 48 hours in the context of the bigger trend and what we may be going for. So you’re going to notice if we take a close look at that neural index, here you see you get some lower lows over the next trading day, but the overall trend is up. Again, some lower lows coming through here. Some weakness over the subsequent price action over these subsequent 48-hour periods, sort of really choppiness as you go from back and forth as there’s no real clear direction. And then you see as things get clear again, the market consistently moves higher from there.
So it’s going to act to help guide you over those short-term windows to help sort of throttle your position when you want to get cheaper prices, when you should do expect volatility and stick with your overall game plan. And lastly here at the very right-hand side of the screen, you’re going to see there’s a shadow candle here. And this is actually an intraday predicted high and a predicted low. And you’re provided that at 6:00 PM the night before for the next trading day. So you can set limit orders, profit targets, whatever you need to do. And what we’re seeing here is the actual prediction. And what we’re going to have is an actual market data fill in with price here.
So what we can do is actually look back and see how accurate have all of those daily price predictions been against the actual market data. And you’ll see here as we go back you get a very accurate intraday view, especially if you’re going long, well, you’d want to buy at the predicted low, target predicted high. Vice versa if going short and same thing for going long. But I wanted to bring this market specifically through to highlight the broader markets and to drive this point across of intermarket analysis and what’s going on out there.
If you remember, we got a big sell-off in the S&P 500 in the broader indices a couple of weeks ago. And what was interesting is as we run our IntelliScan feature coming out of that period, it was just extremely strong. We’re getting tons of blue line over black line crossovers all across the marketplace. And it made it very clear that if you want to benefit off of what the S&P 500’s doing right now, you want to go ahead and be long. But you see how VantagePoint still does a good job picking up on this short-term weakness coming in? And then from all the way back here, understanding that, “Look, this market’s trading lower at least in the short term as far as these forecasts go.” You can be out of the market during all of that weakness as things sort of go crazy and then understand, “Look, this is now in an uptrend again, look to go ahead and get long.” And we can see the accuracy again of those forecasts.
And look, this past week if you want to get long, where are the levels coming through? Well, you’ve got excellent entries. And now some of these markets you’re really starting to see breakout here. So again, early on when this market gets going, really nice predicted low levels here. But very clearly here saying, “Look out for this weakness coming through, potentially even short.” We have other markets that look potentially more weak from this perspective, but an area where there’s some weakness coming in and you see how the broader markets share that same relationship of the markets doing well as far as the S&P, big pullback and now you want to benefit off of that strength coming through again.
Now more recently, again, as we run the IntelliScan, you see a lot of crossovers coming through in this midpoint here in May.
Here’s GameStop. So some of these stocks that are driven highly by what’s going on in the internet and message boards and all these sorts of news announcements, things coming out. Well, here’s the past two weeks of GameStop. So if you’re a trader here, you understand, “Look, it’s telling us the overall trend is up. We know the stock market broadly is seeing a lot of trends move to the upside here. But if we want to be a buyer, do we want to get really specific with what levels we get in, especially when volatility is high, we want to get the best price level possible.”
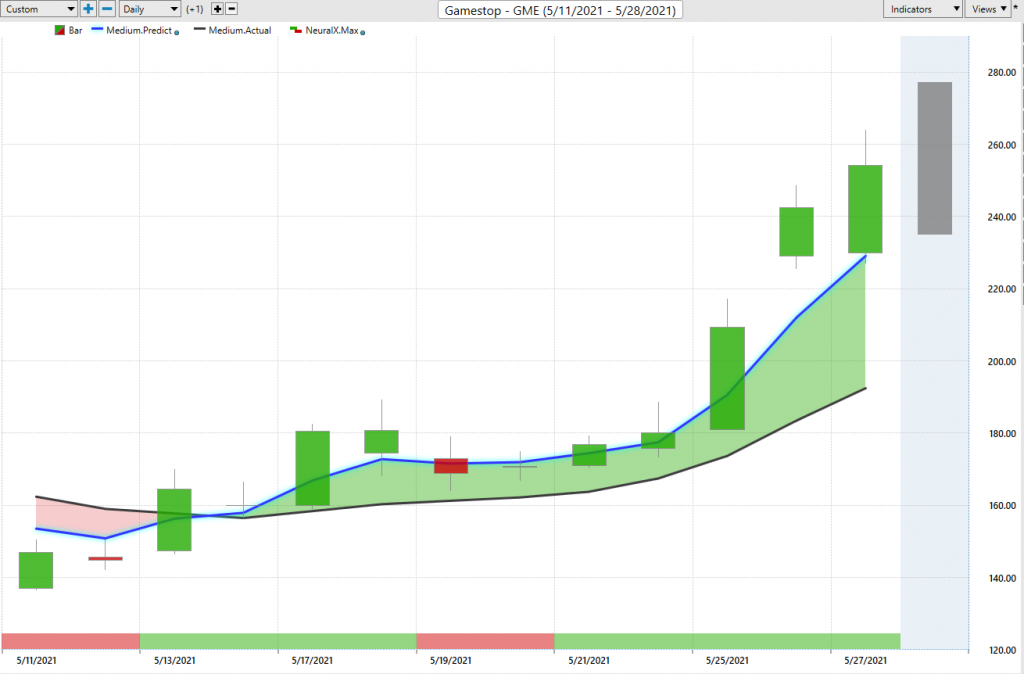
So you see on a daily timeframe, pretty much within the next 24 hours that market’s never touching your entry and breaking out to the upside. And I’m sure this thing is continuing to breakout here. So really nice opportunity in GameStop, but what I’m really trying to highlight here is what are you benefiting from here? You’re benefiting from broad-based S&P 500 global risk on sort of strength. So this whole move, yes, it’s GameStop and it can do wild things on its own, but does it look all that different from Ford Motor company or a lot of other stocks in the market? Because they’re all benefiting from the same similar correlations that are gripping a whole a basket of the broader stock market.
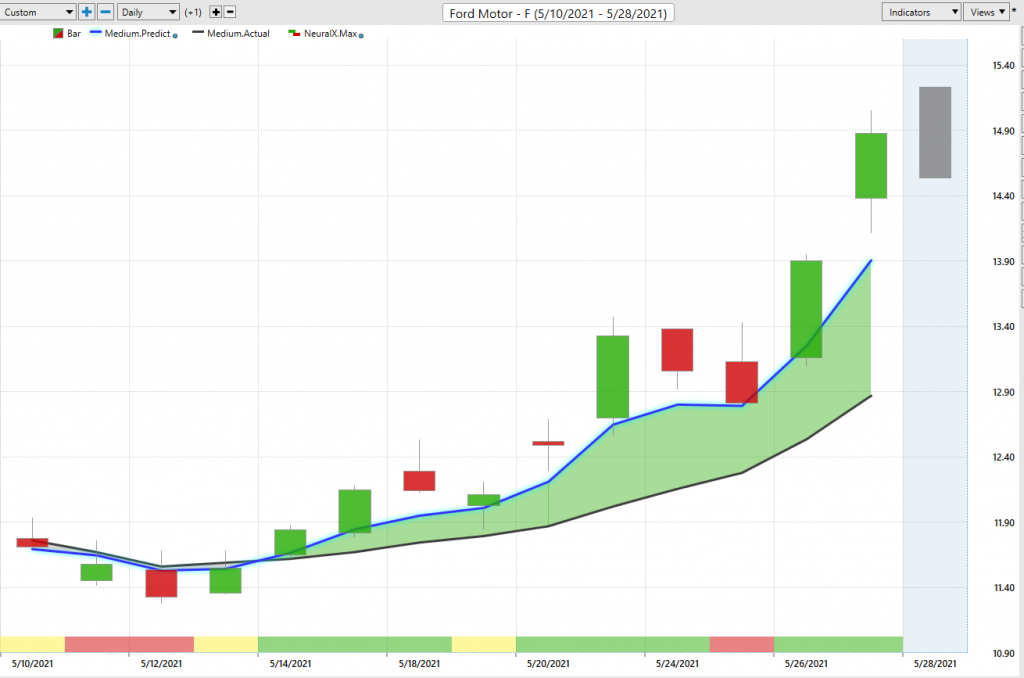
So here’s crossover the upside. You see same time period, blue line over black line. Very clearly here you only want to be a buyer in shares of Ford. And you see a similar situation where you get this pullback here, but that’s the buying day. And then we’re breaking out and things moving to the uptight. A couple more days here were great intraday levels to buy and then benefit off that breakout the subsequent trading day there. So again, really nice trends breaking out here. We can take a look at a Ford here. I think it’s up about 20% or so. It’s about 18 and a half percent just in the past nine trading days here.
So again, how similar these situations are. Same thing with Scientific Games. Everything’s benefiting off of this time period here. And then you can go ahead and pick your spots where you want to go ahead and do that, potentially pick your volatility and find the markets that are really ready to move. And those on a percentage basis are probably going to really benefit where we see this strength come through. But here’s Interactive Brokers. I like to bring through always some bearish opportunities to highlight. Well, where is VantagePoint highlighting where we should not be looking for long opportunities? Where isn’t there strength in the market?
Well, clearly you can see Interactive Brokers, this past couple of weeks it’s been telling you steer clear.
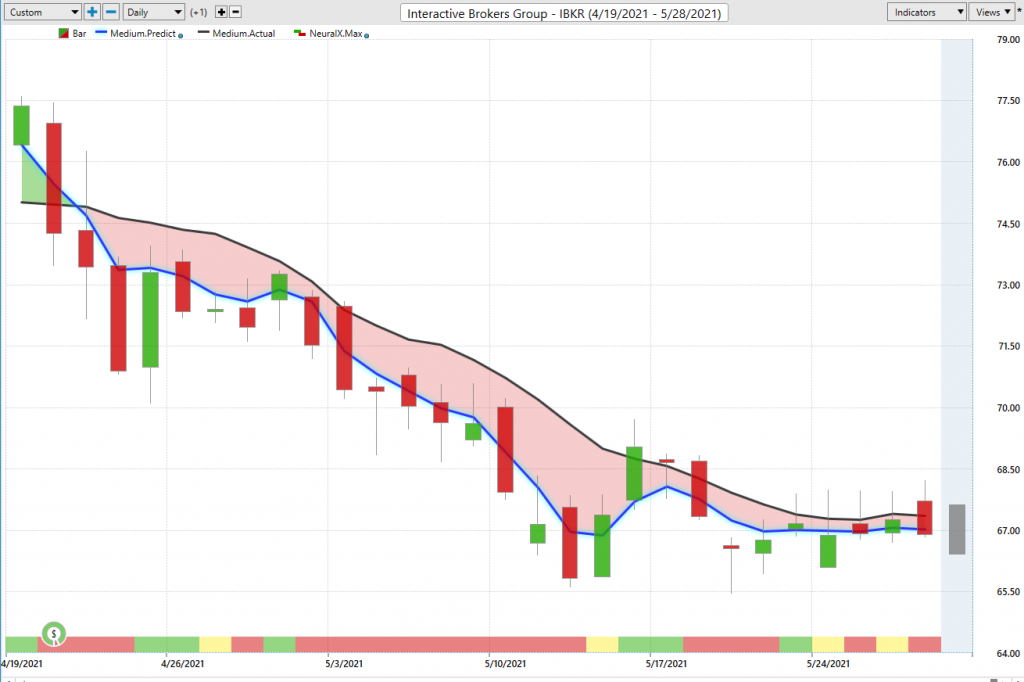
The blue line is still below the black line. Trend is still down. And those predicted highs and lows of course can help guide you if you want to get short, although there may be some better areas in markets to actually go ahead and take a short position. But the point being that if you’re going to trade, you’ve got the guidance here to help you moving forward to let you know that, “Well, let’s focus on Ford. Let’s focus on GameStop. We’re not going to get long here. Maybe in the future here it’s at lower prices. We’ll start seeing those crosses to the upside and there’ll be a great opportunity to buy, but we’re not there yet.” So just avoid the market and focus on potentially things like gold over the past couple of months.
So I definitely encourage people watching this video is go back watch the videos from five, six, seven weeks ago. We’re talking about Franco-Nevada gold mining stocks because the gold commodity itself is turning around, going into an uptrend. Now, when you go back and look at the gold chart it seems quite obvious that the market’s in an uptrend in doing well, but you needed to know that two months ago to really benefit as we saw like Franco-Nevada go from 100 to over 150. Well, here’s DRDGOLD. So when you see these gold miners and they’re saying, “Okay, well, we’re seeing crossovers to the upside, some strength.” Well, how are you going to benefit from gold the commodity moving higher and potentially Dollar Index moving lower?
Well, this is a great place to do that. And you see you get that crossover to the upside, a lot of choppy price action here. You see, you get this gap up move lower. But even in stocks with that sort of price action it does a good job of taking a step back and saying, “Okay, well, where are these markets likely to trade?” You got to understand too down at these levels, not a whole lot of volume trading down there. But when you have your limit orders waiting, you get a really nice fill get picked up and then benefit as the overall trend continues.
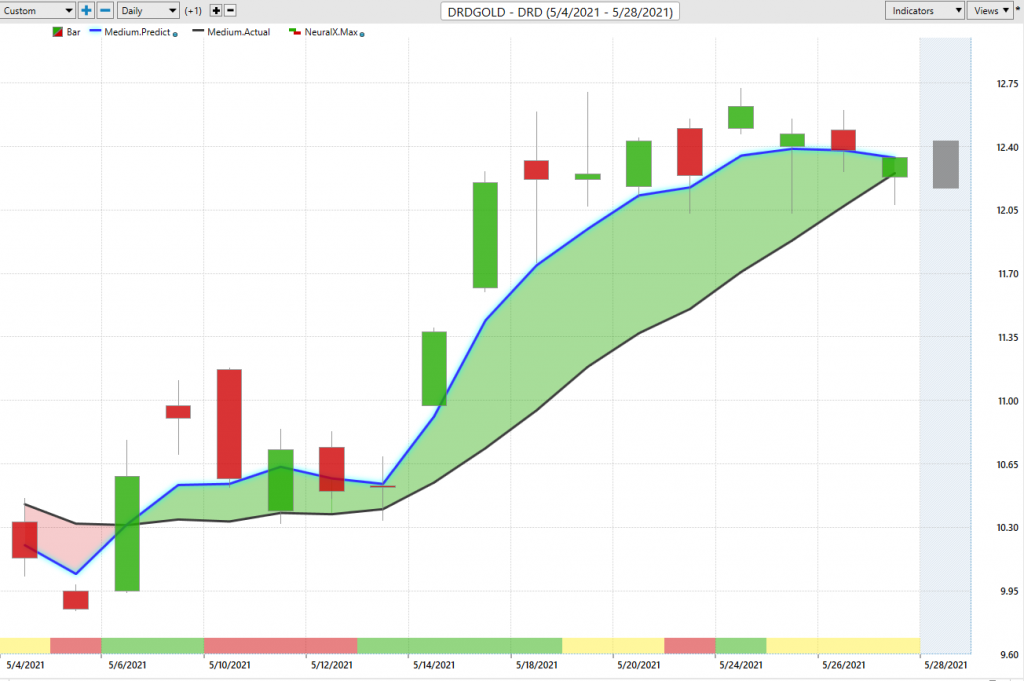
So we’re kind of at the point where we’ve been talking about gold for a couple months here. The commodity looks like it could certainly make a little bit of a pullback here, but this past couple of months has been very clear. Look towards your VantagePoint crossovers, use your predicted highs and lows, only be getting long in any of these stocks. And you see here again about 17 and a half percent move just over the past couple of weeks here of trading here in this stock.
So again, really nice opportunities seeing a ton of strength come through. But I come back to the Scientific Games Corporation chart because if you’re an active trader and you know what’s been going on in the markets, you want a tool that’s going to pick up on those bigger correlations. And you see here how when the market’s moving higher, great. Scientific Games up. Little spats of short-term weakness, but overall trend is up.
Here you see you get that more sustained weakness from the neural index. You get that crossover, and this is where the market is just having a fit. And you don’t want to be involved there. You want to wait for these windows where, “Hey, everything’s clear because you can buy it the predicted low here and you don’t have to run a huge stop-loss, where you can see getting involved in here, who knows how low this market is going to trade or how big that gap down might be on that Wednesday from a couple of weeks ago?
But you get that guidance that says, “Okay, well, downtrends here down. Maybe get out of the market.” Well, coming on this day, get reinvolved and really benefit as the trend resumes to the upside. So once again, this has been our Hot Stocks Outlook for May 28th, 2021. Thank you all for watching. Best of luck to the traders out there in the markets. Thanks again and bye for now.