


Welcome to the Artificial Intelligence Outlook for Forex trading.
VIDEO TRANSCRIPT
Hello, everyone, and welcome back. My name is Greg Firman, and this is the VantagePoint AI Market Outlook for the week of May the 3rd, 2021. Now, to get started this week, we’re going to begin with the Dollar Index again. Now, things pretty much going to plan here. Now, what I had discussed in last week’s weekly outlook is that there’s a cycle in the Dollar, and it’s usually at the very end of the month into the first week of the new month when we see predominant Dollar buying.
U.S. Dollar Index
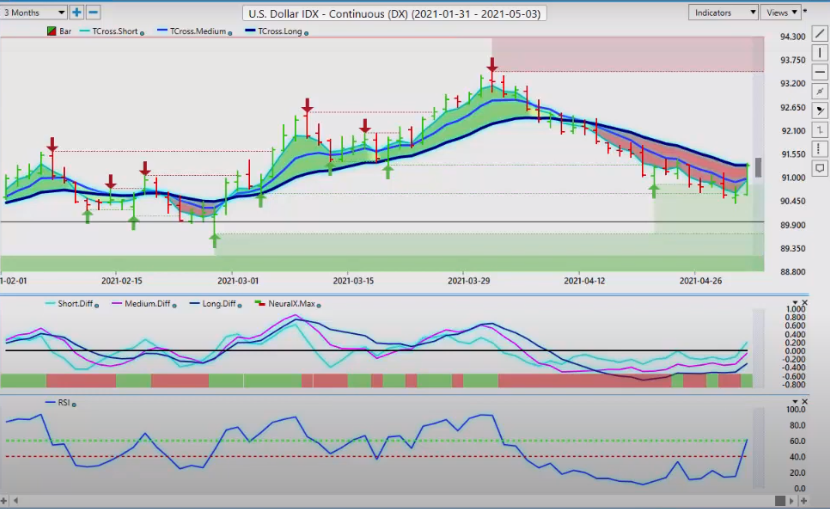
Now, we’ve had a very bullish move on Friday in the Dollar. That led to a move higher in Bitcoin also, a move lower in the Euro, but we’ll talk about all these different markets. The key thing we want to look at is the strategies that I suggested in last week’s weekly outlook, where we see these trades ahead of time, instead of reacting to them once it’s already in progress, so we’ve stopped dead on 91.29, the VantagePoint long predicted. Now, one of the strategies I suggested is using that predicted moving average and putting buy limit orders above the blue line if we anticipate that it’s going to break. Now, the Dollar was having a pretty tough week most of the week. You can see selling off, but this is very often what these bigger players do to you at the end of the month.
They get you going the wrong way only to violently whipsaw it the other way, but I’ve been tracking them for years, and this is usually when they do it. When the Euro is at its strongest, that’s usually when it’s about to fail, so the Dollar is broken above the key VantagePoint level, 90.92. I’ll talk more about that with the Dollar/Yen pairs and a few of the other ones, but the key thing to watch is we’ve got momentum now building in the market, that momentum, the RSI is rising. Our medium-term crossed our long-term predicted difference actually probably a week and a half, two weeks ago, and you can see we’ve just been running dead flat, but the market’s been moving lower. We’re waiting for these predicted differences now to breach this zero line for the Dollar long trade to accelerate.
Now, what I would anticipate is, again, what I’ve seen many, many times is fake price on a Monday. Remember, this Monday is a U.K. bank holiday, so the liquidity is going to be much thinner in there, so we’re going to see more Dollar strength, I would anticipate towards Tuesday and Wednesday, but we should still see Dollar buying, maybe just not as aggressive as what we will midweek. Now, we’ve got the nonfarm payroll number on Friday. The Dollar is, as I’ve stated many times on here, the Dollar is usually strong right into that payroll number until the Tuesday after the payroll number, so again, we would be looking for places of value potentially to buy U.S. Dollars, so it’s buying Dollar/Yen, selling Euro/U.S., buying U.S./Swiss Franc, maybe buying U.S./Canada. I’ll talk about that one more in a minute, but for now, we want to watch this blue line that we’ve predicted moving average at 90.92.
Gold
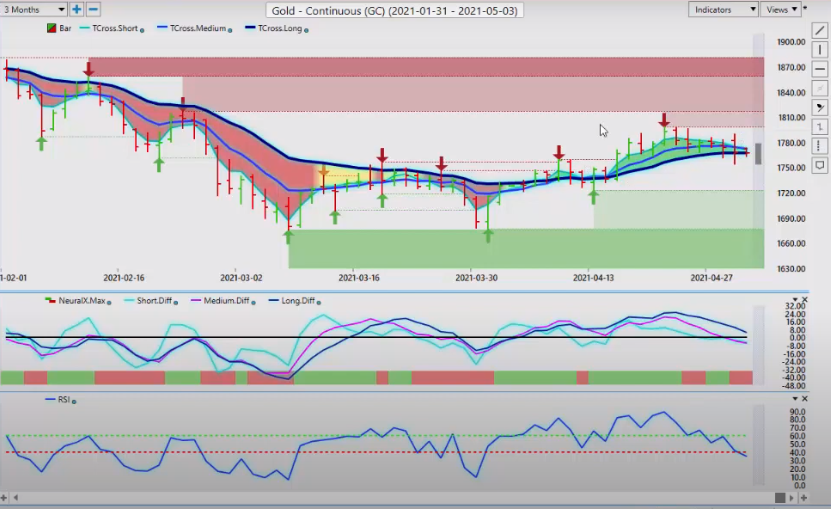
We want to see and make sure that we’re holding above that. I usually like a two-day rule, where I close above this two days in a row, but at the end of the month, it’s usually pretty safe to do that. Now, I did expect a little bit more out of gold this previous week, I must say, and I knew it would sell off, but I just, I did expect at least to try and make a run back towards this 1811 mark, and we just couldn’t get it. We formed a new verified resistance zone the previous week, and that verified resistance held the entire week, this week. Now, we’ve come down.
We’re sitting right on that TCross long. 1767, that’s the level you want to watch very closely. If we lose that level at 1767, you’re going to see a much deeper pullback in gold. When we look at comments from the Federal Reserve, what I saw, I don’t know about you guys, but I saw a genuinely annoyed Jerome Powell. Very frustrated. The questions were getting tougher and tougher, asking him, “What exactly is it are you doing here?”
“You’ve got more than enough inflation. Why do you keep saying no raising rates until 2023?” I don’t believe I’ve been very vocal about that. I believe he’s got it wrong yet again, and they will have to hike before then. The GDP numbers are good.
The jobs, I’m willing to bet this jobs number on Friday is going to be a blowout, and if that’s the case, that is really going to be tough for gold to recover from, so we want to watch this level, but once again, if we look at this, the kind of week that gold really had when we come back, and we use this predicted moving average, the long predicted by itself, you can see that really, gold never had a chance. Just the one day, we closed … Well, actually, we didn’t close. We opened above the blue line only for it to move down below it again, and you can see how it’s using that predicted moving average as a pivot level, so to start the week, if you’re looking for shorts on gold, 1774, the long predicted is a very reasonable area. Now, with gold moving lower, two things that I’ve noticed, gold, directly inversely correlated.
Bitcoin
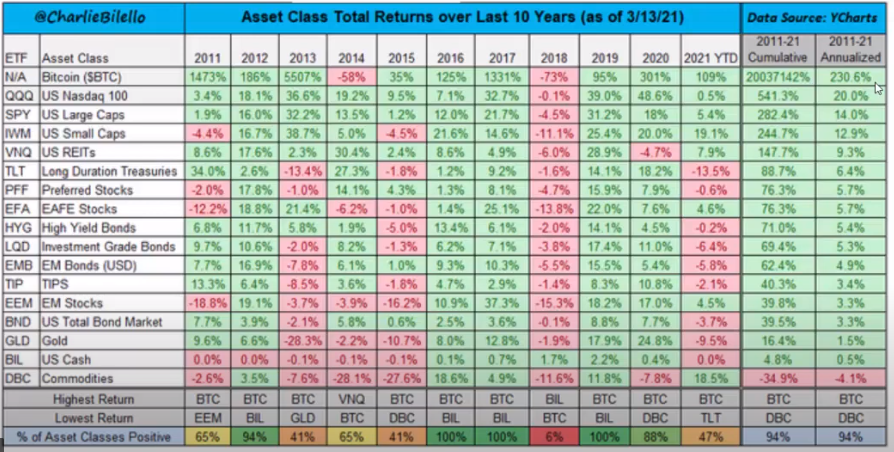
If gold is moving lower, Bitcoin is moving higher, but I’ve also noticed as of late, and Bitcoin is still relatively new, that there’s an inverse correlation to the Euro/U.S.. Now, in last week’s weekly outlook, I did make a statement, a flip statement, saying basically Bitcoin has doubled every year for the last 10 years. I stand by my comment. I may have tweaked that comment a little bit, but let me clarify it. If we look at Bitcoin here from its inception, and remember, I did make the comment over the last 10 years specifically, this is the cumulative gains in Bitcoin, which is just an absolute massive number, but in an annualized return every year, 230%, that’s its return.
If you put $1 into the Bitcoin 10 years ago, the next year went to two, then to four, then to eight, then to 16, so I’m putting a little bit of a spin on it, but Sam likes to keep me honest, and he’s correct. I did spin it a little bit, but the thing is we want to look at is I should have said yes, what I was referring to is annualized returns. When you look at those gains, the next best investment is the NASDAQ-100. Then, you have large caps. They’re running on basically an annualized return of 20%, 14%, 12%, but when you come down here to gold, it’s interesting when I break this down, that it’s only really, the annualized returns are just one and a half percent, so this is where I had stated over the years that I was getting very frustrated with some of the comments that were coming out of these so-called market gurus that were telling us that Bitcoin’s a scam, Bitcoin’s this.
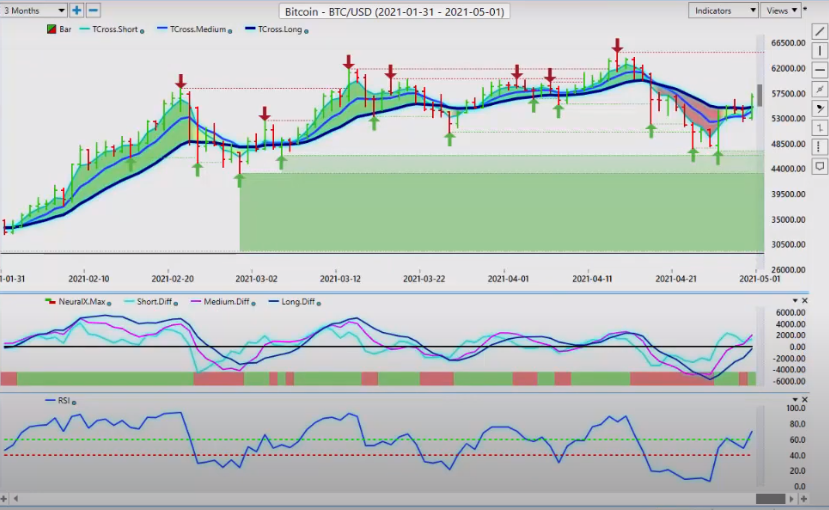
Bitcoin is real, guys, and that’s all I have to say. I threw in the towel on shorts on this thing in early 2018, where I’ve said, “Okay, I’m looking at all these numbers.” I don’t agree with anything that these so-called gurus are saying. I believe they’ve got it dead wrong actually. Like your Berkshire Hathaway, these guys, they still to this day say that they won’t … I believe they are invested in it, but I have nothing to prove that, but right now we’ve cleared the VantagePoint TCross long, at 55,000, and this is what I find very interesting here, guys, is that when we look at that Euro/U.S. currency, when it took its big sell-off, and I’ll just run over here just for a minute so you guys can see it, I’m not saying that this is going to be a long-term inverse correlation, I’m just saying I am noticing it.
Asset Class Returns
Again, on Friday, this big sell-off, soon as the Euro started to sell, sell off, I immediately started buying Bitcoin because I’ve seen this correlation, and buying Dollars, of course, but Bitcoin and the U.S. Dollar appear to be in their own camp, and gold and the Euro appear to be in another camp, the losing camp, to be honest. That’s the way I would kind of look at this right now, that just because of the U.S. Dollar’s going up doesn’t mean Bitcoin can also. The charts, I think are starting to prove that, but again, with the Euro, we have stalled right on that key level, so for next week, I believe that Bitcoin will have a reasonably decent week, even with the U.S. Dollar strength, pending U.S. Dollar strength. Again, when we look at this, you can see when this actually started, and there’s that two-day rule I talked about so often, that we moved back up above the predicted moving average, same thing for the next day, and then that triggered a bigger move. I think that this move may be just getting started.
Medium-term crossing the long-term predicted difference, everything looking good there, the RSI, the neural index, closing well above that long predicted at 54365. That’s the level you want to look at to start the week. Now, with oil going into next week, oil is going to follow the S&P 500. I think the S&P will be a little bit softer next week, which could lead … Well, it doesn’t necessarily mean that oil is going to be softer because obviously, most of the economies, except Canada are starting to pick up again. I’ll talk about the U.S./Canadian pair in a minute and some of the comments from the Bank of Canada, the economic data, but right now, when we look at this, the Canadian Dollar is benefiting from these higher oil prices and the S&P, so when we look at it, 62.49 if we’re hold …
Crude Oil
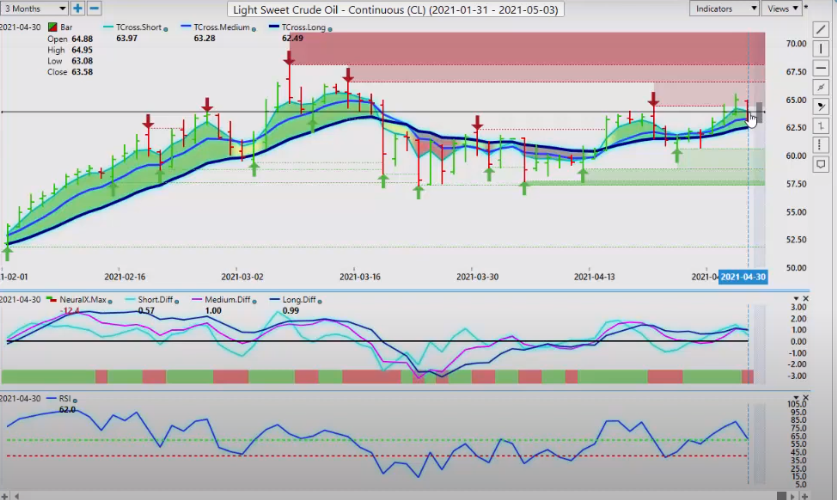
As long as we’re above 62.49, longs are still reasonable, but again, you want to watch that predicted moving average by itself. Make sure you’re continuing to close above 63.54 if you want to get long, but this very ominous verified resistance high at 64.38 definitely has my attention for a potential short.
S&P 500 Index
That directly applies to the S&P here. When we look at the S&P 500, we’re getting very toppy. I’m just going to come down here, and I’m going to bring that up to the cash price here.
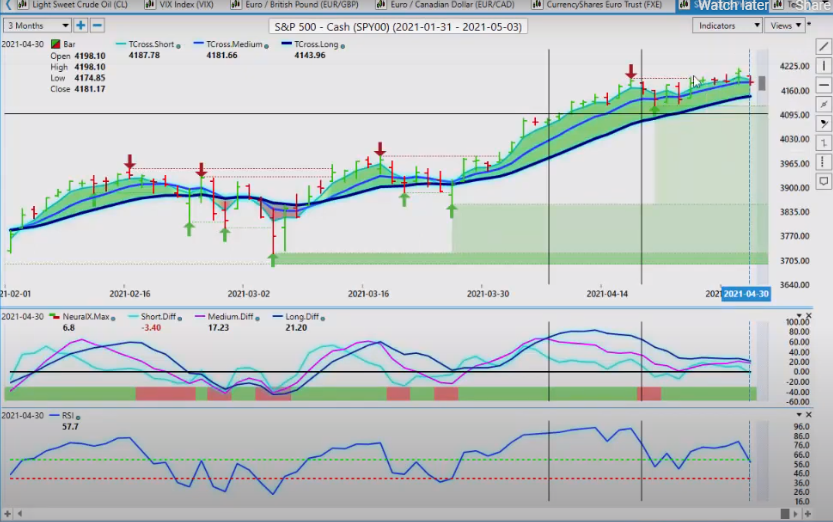
Where are we? There we are. Okay, so we’ll have a look at it from that perspective here. Once again, we can see that we’re a little softer up here. We’re holding, but it’s very, very toppy.
We’ve got this verified high from April the 16th, and we really haven’t done much since then. We’re just kind of wandering around between … So we could see a deeper pull back, but again, the way we would look at this is we would still remain long while above the TCross long at 4143. If we click on our F8, we can see that this blue line, the predicted moving average by itself is being challenged here, and we actually did close about 10, well, about eight points below it, so we want to be a little bit cautious buying up here. I think with the pending Dollar strength, the stocks are going to struggle a little bit this coming week.
Euro versus U.S. Dollar
Now, as we look at the Euro pair, once again, I’ve just shown you, guys, the two bars, the inverse correlation that I’ve been picking up on over the last several months. Whenever there’s a big rally in Bitcoin, usually the Dollar follows, not the Euro. It usually means the Euro’s going lower, so for now, once we break down below 1.2014, we should see a deeper pull back into the, somewhere between 118 and 119 on the Euro, I would anticipate, but here’s how we look at it to begin the week, guys. We click on our F8, and we can see that we power through that VantagePoint predicted moving average, but we’ve been trading off that all week on longs, so in my respectful opinion, how you would pinpoint your trade entry point for the beginning of the week is you would use that long predicted as a pivot level, 1.2068, so give yourself 10 or 15 pips because Monday, remember what I said, it’s a U.K. bank holiday on Monday. That’s going to affect the Euro and the Pound, so around 1.2080, maybe I would look at and say, “Okay, well, all the indicators are lined up here, so we’re looking for a minor retracement.
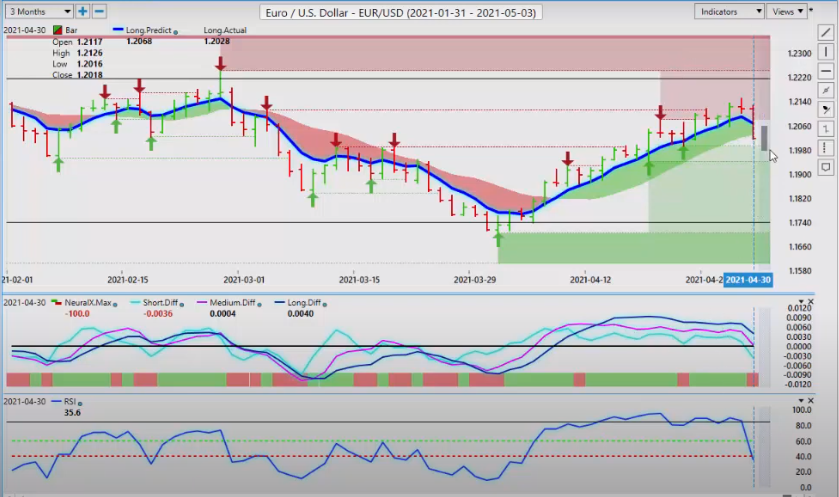
We’ve got the VantagePoint predicted high at 1.2057. I believe it will go a little bit higher than that, probably, like I said, around 1.2070, 1.2080, that’s where you would target your area, because again, the advantage of using the VantagePoint software is we want to see this trade, not react to something that’s already in progress. We let our prey come to us, and we pinpoint the exact level where we want to target a trade, and then just make a decision. Do we want to be long or short? In my respectful opinion, I think a short is a better play because of the aforementioned reasons. The Dollar strength, the very confused fed, that not sure he knows what he’s doing.
U.S. Dollar versus Swiss Franc
All of these factors, not really … Not to mention, the U.S. economy, the engine of the U.S. economy is starting to rev up. Euro’s not the Euro … European zone, not so much, right? If we continue to look for places of value to buy Dollars, the U.S./Swiss Franc longs next week, I think would also be a reasonable area, so we know where our key resistance is, 0.9178, so we click on our F8 and we look at this and say, “Okay, here we go.” This is just like what I had stated last week in Dollar/Yen, and I’m going to look at that one next, and I’m going to show you the exact same trade, but this time it’s going to be with the U.S./Swiss Franc for next week, so we’ve got our key pivot level at 0.9129.
You can see that the market’s been containing the price below here, so we’re looking for a close above that level. We actually got it on Friday, right? This level, it’s entirely possible that it could just break out right off the open on Sunday night, but if you want to use the VantagePoint predicted low, you want to be a little bit more conservative, then you wouldn’t use the 0.9111 area to set your longs. Make sure all your stops are at least, at least 40 to 50 pips below these support levels that are basically all bunched up. You got the three of them all sitting here down around this low at 0.9088, so I’m not in the camp.
I’m not convinced that we’re going to come down that low. Like I said, you make it a breakout right off the open. Well, we’ll see, but the main thing is you’ll know the level, 0.9129. Put a buy limit order, say 0.9136, 0.9138. As soon as it starts to break up, boom, and then we use our upside target on that high of 0.9472. That’s a reasonable target here, guys, and could we get that in one week?
British Pound versus U.S. Dollar
Possibly. Absolutely, and if you get a below nonfarm payroll number, not only could you get that level, you may be able to surpass it, so keep an eye out on that for a longer term trade. The Pound/Dollar, unlikely to have a great week next week. Again, with a period of Dollar strength coming in, you can see the medium-term crossing the long-term predicted difference. We’re just simply waiting for the neural index to come on board and the RSI to break down below the 40 level, so the Pound is likely going to take a hit next week, but it’s still above its yearly opening price at 1.3670.
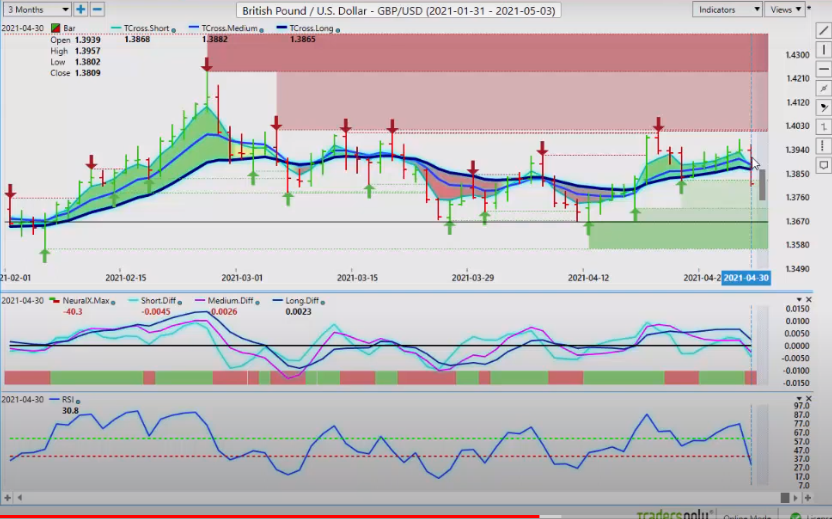
I wouldn’t get overly bearish regardless, unless we get below 1.3670 here, guys. It’s still bullish on the year, okay? The Euro, however is not. The Euro is below its yearly opening price, so most money is going into the Pound, not the Euro. When we click, again, click on your F8, you can see that we broke down below there our natural retracement point to start the week would be the long predicted at 1.3884, so that’s the area you would target.
You’ve got the VantagePoint predicted high, 1.3862, so I would argue that you’re where you would want to set your trap for your limit orders is between, the 1.3862 and the long predicted at, again, when we look at that long predicted, we’re coming in at 1.3884. Now, the Dollar/Yen, this is the trade that we did last week, and again, like I said, remember, the U.S./Swiss Franc right now in my respectful opinion is the exact same trade I showed you in last week’s weekly outlook, using that predicted moving average by itself as a pivot area and straddling it.
U.S. Dollar versus Japanese Yen
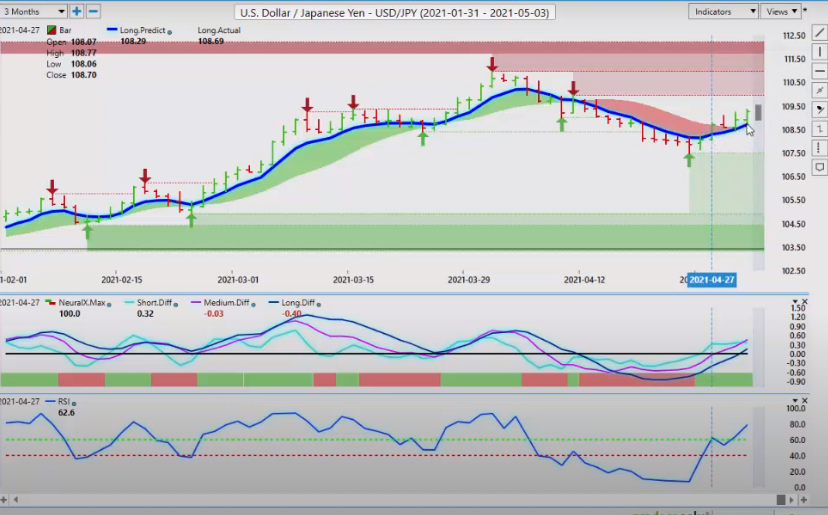
Right now, the Dollar/Yen has made its move and we’ve closed above the TCross long, at 108.71, but this is what we looked at last week, and what I had stated was is you would put your limit orders just above that blue line. The Dollar/Yen is likely going to break up above that based around a period of known Dollar strength that we discussed in last week’s weekly outlook, so putting your limit order just above the 108.40 area, you can see that that led to a very nice move here, multi-day move, but we could be looking at a bigger move to the upside on the Dollar/Yen now. We’ve got our predicted differences above the zero line, the neural index is positive and our RSI is firmly above the 50 and the 60 level.
U.S. Dollar versus Canadian Dollar
Once again, you use that blue line as a potential pivot area, 108.71 to pick up longs early in the week. Now, with the U.S./Canadian Dollar, the Canadian Dollar has been on a very, very strong rally, but this is falsely induced by the Bank of Canada. The Bank of Canada is telling the market that the data coming out of Canada with retail sales and jobs and all this is doing better and the economy’s coming around faster, and they even went so far as to say they were going to raise rates before the fed, but what’s happened since then is that Ontario has, again, gone into a full-blown lockdown from, again, the middle of April to May the 20th at the earliest, so there is no economic activity in Canada’s biggest province, which is Ontario, were in full-blown lockdown, so the Bank of Canada is using lagging data to prop up the Canadian Dollar here. I would be very, very cautious about further shorting it down at these levels. If nothing else, we need a major retracement back to 1.2446, and I anticipate we will get that this week.
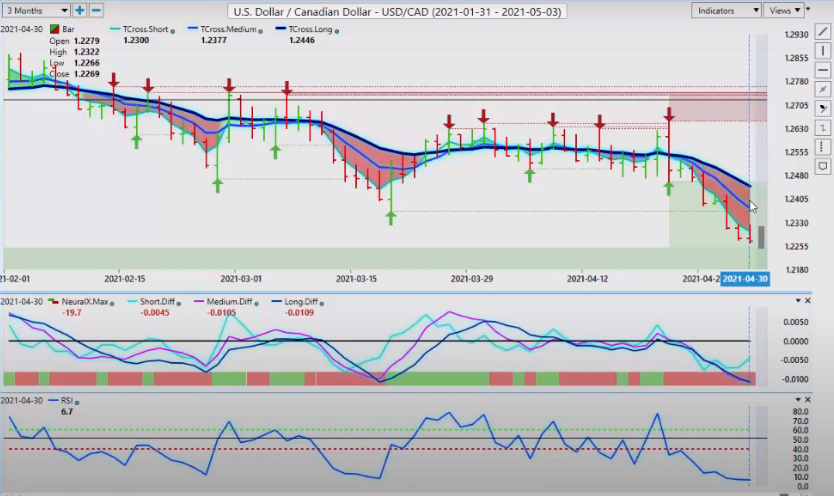
Now, again, the reason I’m saying this is because the Bank of Canada is giving false information, in my opinion. Well, it’s not false. It was accurate, but it’s way back, going way back to February and March, well, April and May are not going to look anything like February and March because of COVID, and the failure at the federal government’s level to shut those borders down. We’ve got variants that have come in, devastating consequences because of that, so this is slowing the economic engine down. Canada will recover, but there’s going to be a bumpy road here that the Bank of Canada is not taking into consideration, so if we look at our F8, I can anticipate that we will challenge this level very early in the week at 1.2352.
Australian Dollar versus U.S. Dollar
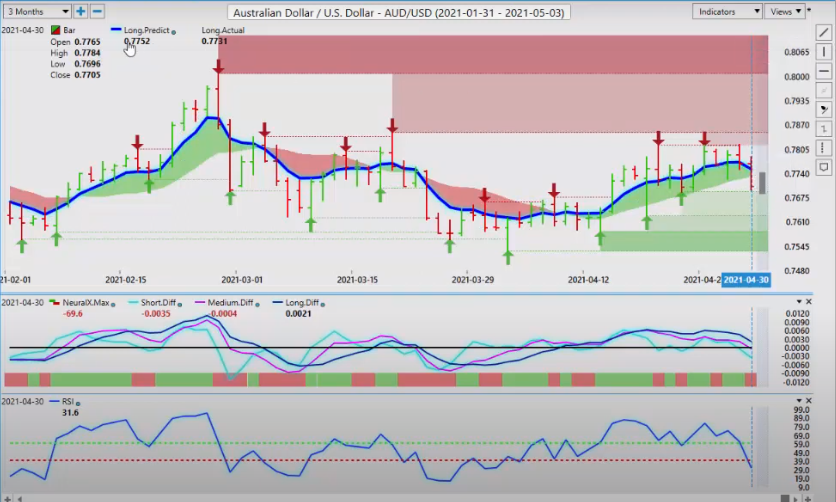
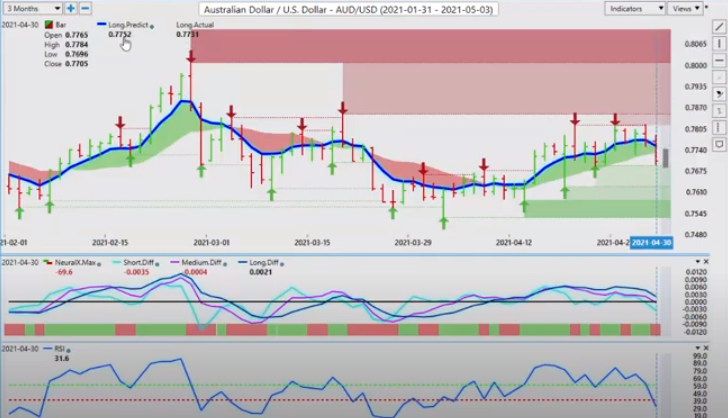
You have the option again here, guys, based on what I just said, of putting a limit order just above 1.2352, and if I’m correct and the data catches up to the Canadian Dollar, it’s likely going to go higher before it makes its next lag down and you can profit from that. When we look at Aussie, U.S. and New Zealand, U.S. next week once again, they’re unlikely to have a great week here because of this known period of Dollar strength. Once again, we’ve broken through the TCross long at 0.7731. When we click on our F8, once again, our two-day rule is in play here. Our long predicted, 0.7752, that’s the area.
New Zealand Dollar versus U.S. Dollar
If you want to continue a shorts, that’s where you would do it. That is supported by the MA Diff cross, the neural index, a break of the long predicted and the TCross long, and the RSI pushing below 40, suggesting that momentum is building to the downside. You will see the exact same trade here, guys, with New Zealand/U.S., virtually no different here. That one’s a little bit … It’s actually lagging behind the Aussie a little bit here, so we’re just closing below that at 0.7168.
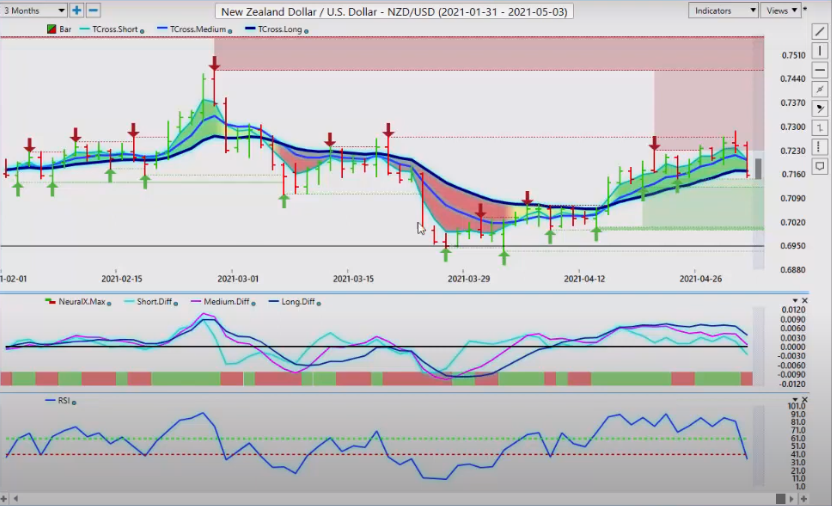
Once again, if we click on our F8, we don’t necessarily have a two-day rule here. New Zealand’s been a little stronger than the Aussie, but it’s still following the Aussie down, so that key pivot area to start the week, 0.7205, and you can see the market getting all tangled up in this previous verified resistance zone, and that area is coming in at 0.7269. That could be considered a very, very significant failure, and we could very likely be heading back towards the 70-cent mark. We do have a very busy week next week with the nonfarm payroll and the U.K. banking holiday, but there is some very good opportunity coming up in the market. With that said, this is the VantagePoint AI Market Outlook for the week of May the 3rd.