


Welcome to the Artificial Intelligence Outlook for Forex trading.
VIDEO TRANSCRIPT
Hello everyone. Welcome back. My name is Greg Firman, and this is the VantagePoint AI Market Outlook for the week of May the 24th, 2021.
U.S. Dollar Index
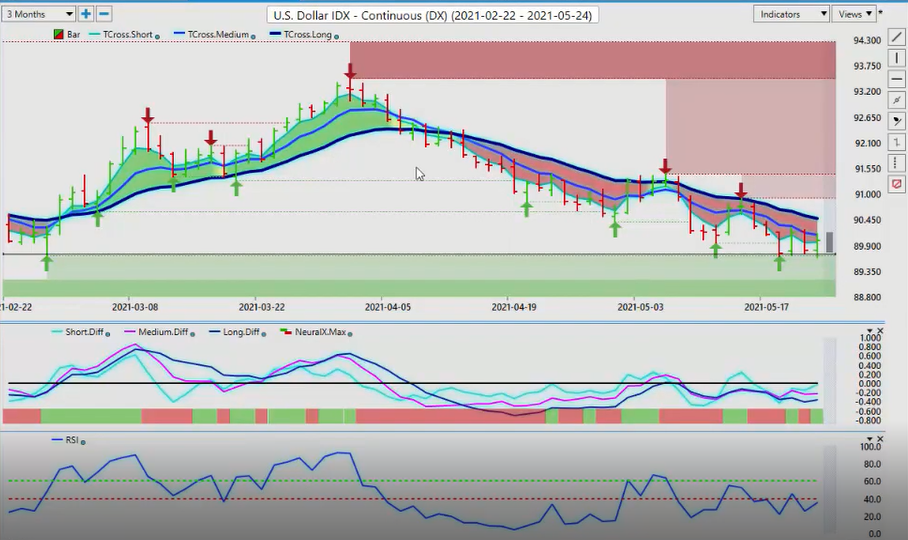
Now to get started this week, we’re going to begin where we always do with that very important US Dollar Index. Now when we look at the dollar here, another tough week for the dollar, but this black line, you can see that I’ve got drawn across here is the yearly opening price coming in at about 89.80. That area continues to hold. We have absolutely no sellers at the current time at this particular level.
Now with the VantagePoint AI Outlook, it is just that. It’s an outlook based solely for the most part on the VantagePoint indicators. I do suggest you add in financials. You can add in your fundamentals. If you have other indicators you’re using or you’ve used over the years, by all means. But again, this is an outlook that’s based around the VantagePoint software with a couple of thrown in indicators that I usually use, like the yearly opening price. And this again, solidifies how strong using this tool actually is.
Now we’ve been down and we’ve had a substantial bounce off of that yearly opening price on February the 25th. So again, right now, this coming week and the week after, in my respectful opinion only, it will be a make or break time for the dollar. Now I’ve also discussed cycles of institutional buying of the US dollar and when that often occurs, usually at the end of the month into basically just after the non-farm payroll number. At that particular time, looking at the month of June, statistically, looking back at it, I’ve been told by some of my own direct clients, it’s about 70% of the time over the last 20 years, the dollar has still strengthened at the beginning of June but at the end of June on July 1st, only 40%, so that suggests there’s still potentially some life left in the dollar.
But at the current time, we’ve got the Neural Index up. We’ve had a bit of a rally on Friday, but still well below that TCross Long at 90.47. So like I said, you can add in all the kind of additional. You can use wave theories, you can use Fibonacci. You can use a lot of different tools out there. Based around the inner markets right now, structurally the dollar is still weak. When we click on the F8 in our software, which I’ve worked on with a number of people in the live training room and so forth, is using that predicted moving average as a trigger. So right now, that key pivot area is 90.08. The dollar will remain bearish while we close below this particular level.
What I’ve also talked about is a two-day rule. I look for it to close above that two days in a row to tell me that I’ve got a reversal coming. Now, again, we need to hold above this 89.80 level. Now if we get below it, down a little bit lower, that’s fine. But if we close below 89.80 for two days in a row, which is the yearly opening price, that would likely be the trigger that would be sending some of the other markets higher.
Gold
Now the first market that that would likely affect would be gold. So when we look at gold right now, we can see we’ve got a new verified resistance zone that’s formed off of the 89 91 30 area. I do believe that gold could go higher, but once again, here, guys, what I do is I will bring in here and I will put on the yearly opening price on gold also at 1904.
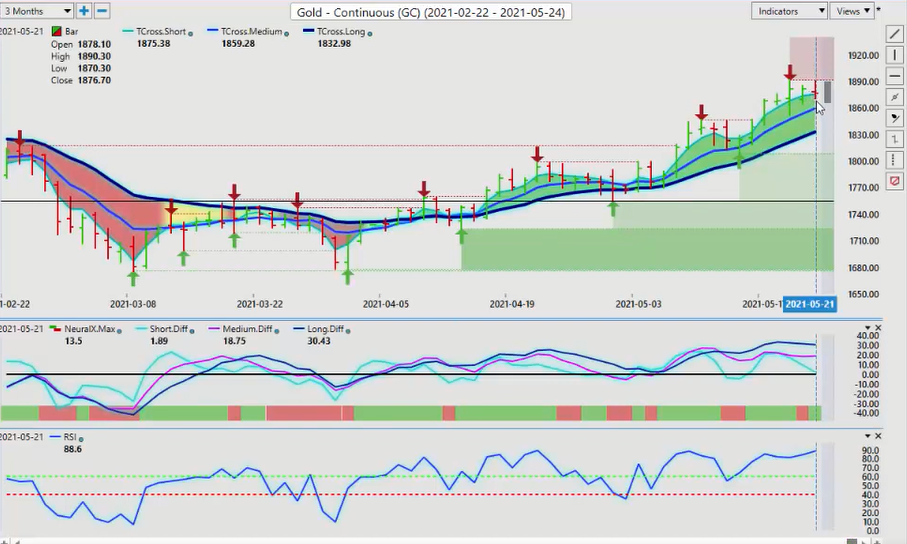
I need this thing above that level for gold to turn positive on the year before I look at any further aggressive longs. As I’ve stated in some of the previous weekly outlooks, usually gold, its yearly ranges are anywhere from 150 to $300 an ounce, approximately. So we’re in that $300 an ounce mark right now at about 1675 to 1960. But the first obstacle is we would have to clear this. So if the dollar loses ground at 89.80, and it sells off below there, that would be the trigger that would indirectly likely send gold higher. So when we look closer at gold going into the next week, we’ve had a pretty decent run up from the 1740 mark. It appears to be getting a little tired up here, but you’ll notice that this same situation happened on the 10th. Now, this is where I’ve talked about where the dollar usually turns around on the 10th of the month. That’s the week after the non-farm payroll number.
You can see the verified resistance zones can be used in two different ways. Number one, to show us where resistance or support is, but also when that breaks, you can see we have a big move. So for the start of next week, that high is 1891. We would look for a close above that particular level, and then that would probably trigger at least three, four, five days of buying prior to the end of the month. But in my respectful opinion, again, only I’ve seen this movie before many, many times, and there’s often bull traps that are set up prior. Now, if I was doing this presentation at the end of the first week of June, I would give one clear signal and that’s that this thing is going higher. Right now, with that yearly opening price up at that level. We’re not quite there yet, in my opinion.
So we look right now where to buy on dips. 1865 is still a solid area of support with the VantagePoint predicted moving averages. A little bit of a concern that that MA diff cross is still pointing down, and they’re actually moving sideways. The predicted RSI is sitting at about 88.6. I’m not too overly concerned about an overbought signal there at this particular time. If there’s any kind of catalyst from the Fed, and a couple of Fed members are speaking next week, and that could trigger either dollar strength or significant dollar weakness.
Now with stocks, stocks had a big sell off this week, but easily recovered back again from this. I’m just going to go to the cash contracts here, guys. Sorry. I prefer to use that particular chart.
So once again, a rather large sell off, but as you can see, the VantagePoint again, the verified zones, we have a low here from May the 12th, we’ve come down, basically hit that number, hit it almost to the number, and then we bounced out of there yet again. So these are the things we’re looking for in our trading, is areas in which the market has previously failed, and for that level to form support. Now, I wouldn’t call that overly strong support by the light olive color. This darker color green is much stronger support. So right now, we can see that the S&P has recovered yet again, but now we’re getting a little tangled up in this verified resistance high at 4183. So I’d like to see us breakthrough there and get moving.
Right now, the predicted differences are looking pretty good. The Neural Index is up. The predicted RSI is a little conflicted here, but once again, if we click on our F8, then again, you can see that we’ve got basically a two day rule here where we’ve closed, back up over here, over the blue line. We’ve closed above that on Friday. That would tell me that we’ve got decent support at the low of 4151. So we would look for that to continue to advance off of that particular level.
Crude Oil
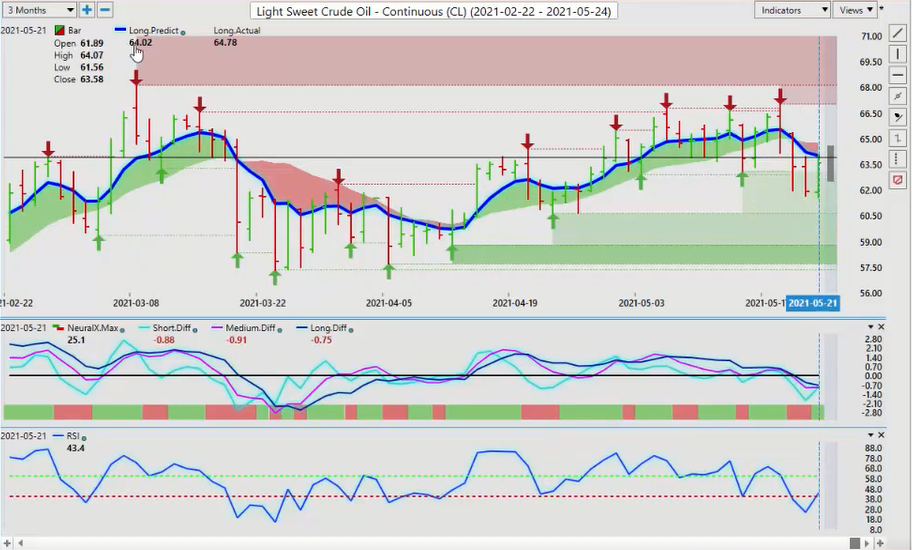
Now, once again, when we look at the main correlation, and one of the main correlations that we have to the S&P 500 of course, would be light sweet crude oil. Now, crude oil getting very choppy in here as they didn’t like it one bit when those stocks turned around and went lower. But as the stocks recovered, oil tried to recover on Friday also. Our RSI were starting to rise back up. Our Neural Index is positive. But we’ve got to get over this TCross Long, this hump at 64.25. When we click on our F8, we’ve come up on Friday, right up to the predicted moving average, that area at 64.02 only to pause, and we were unable to close above it.
Now again, I have these two bars that have closed below this predicted moving average. I’ve got a retracement back to the moving average. That is concerning in my respectful opinion, that we could see a bigger move down. Now that would, of course be triggered by dollar strength. It would be triggered by a weakness in the equity markets. So we’ll continue to monitor this, but right now, we need to get above that particular area.
Bitcoin
Now, another wild week in Bitcoin. We’re going to have a quick peek at that. And I’m going to give you guys a little bit more information on that one, that hopefully you’ll find useful. Now, when they’re talking about regulation here, I’m not opposed to more regulation, I quite frankly, couldn’t care less what Elon Musk has to say about Bitcoin, or China for that matter. They’ve been saying the same things since 2017. But here’s what I will say, where regulation, I think will help Bitcoin a bit. Now the yearly opening price in a standard futures contract… I’ll just put it on here for you. I believe it’s around the 3,300 mark, but you’ll see, I have a secondary line here.
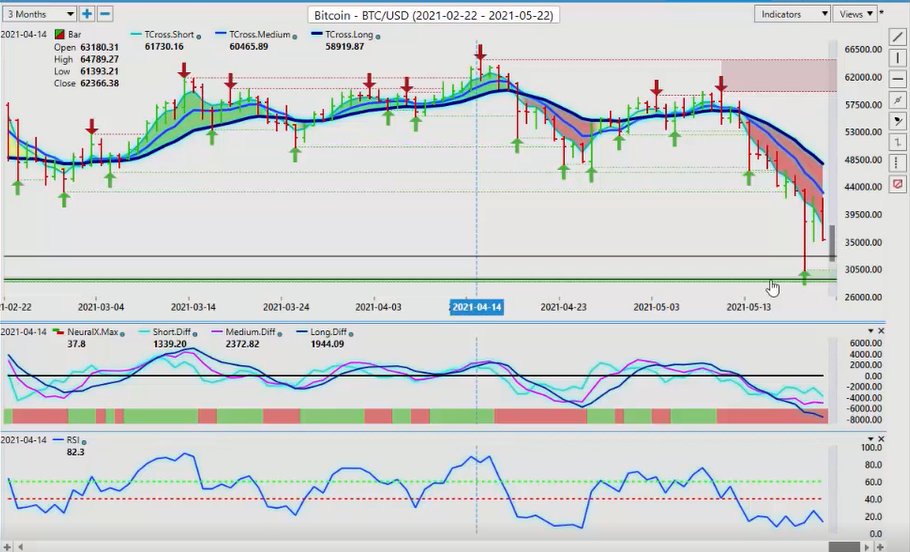
Now, this is the issue that, that I’ve had. I sent a message off to some of the regulators questioning this. The Bitcoin exchanges are running over the course of the weekend, and I don’t think that that should be allowed because the futures aren’t. So you’re getting these wild gaps in prices, but this directly has an effect on the yearly opening price. So when we look at it through the futures side, you would be more around the 3300 mark, but as you can see with VantagePoint, VantagePoint, rightfully so, is actually taking price from those exchanges.
So if we look back here, you can see that obviously the futures markets were closed on December 31st, and they were closed on January the first, January the second, January the third, but VantagePoint was still forecasting because technically it was still open. This is something that I think they should regulate and say, “No. You can’t have that because the Forex market is not open over the weekend either.” There’s mild exchanges going on, but no gaps like this. But long story short, we can see that we’ve had a massive move down. And actually in the VantagePoint live training room this past week, we were looking at this and I had stated that, “Well, I’m actually a buyer down here. I didn’t think we’d get down here, but we did.” And the yearly opening price is again, very powerful because this would be a premium place to try and get back in this.
It ended up bouncing, I think, 10 or $11,000 off of this mark, but here’s the thing. There was several people interviewed about this over the weekend. They had the main group of four on the power lunch there on CNBC. And the one gentlemen was dead against Bitcoin, “It’s a scam. It’ll never be anything.” But the other gentlemen, in my opinion, he’s got it more, right. He would take more the position that I would. He goes, “We’re taking 2% of the fund and we’re buying this thing. If Bitcoin goes to zero, we lose 2%.” And he goes, “If you can’t afford to lose 2%, then you’re in the wrong business.” That resonated with me because that’s basically exactly how I’ve often told people to trade certain instruments, because of that volatility. That’s how you take the volatility out of it.
So I have no issue buying this thing. I don’t think I would let it go to zero, but I’m saying that if you pre-manage this, going into this, knowing what you’re dealing with, then like anything else, that yearly opening price would be again, and I’ve shown the statistics, the 230% annualized returns on Bitcoin over the last 10 years. It’s not a question of why would I buy it? The question is, why wouldn’t I? It’s just controlling the risk and understanding the volatile instrument that you’re dealing with. So when we look closer at Bitcoin and the two that I would recommend, if we’re going into the cryptos, Ethereum and Bitcoin, these are your blue chips, as far as I’m concerned. In the crypto side of things I’m not looking at Dogecoin more specifically right now. It’s volatile enough. Let’s just say that.
So these two, and you can see, Ethereum, this chart matches Bitcoin. So the correlation is there. It came all the way down to its low at 1937 and shot right back out of there. But again, at least for now, we’re still not getting a firm buy signal on either of these two at the current time, but there is still opportunity there, in my respectful opinion. It’s just both are very susceptible to any market announcements. But again, if you pre-manage this, then I think, based around its trading history, its rate of returns over the last 10 years, again, I’ll bite. Sorry. I spent too many years not trading it, to miss out on some of these types of moves.
Euro versus U.S. Dollar
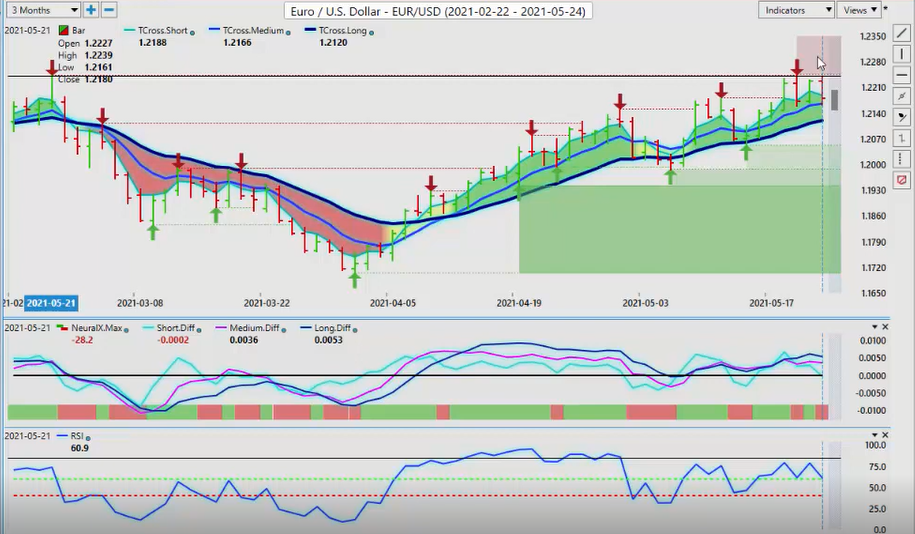
Now, as we go into the Forex arena for next week, once again, the Euro has got its work cut out for it. In my respectful opinion, it’s going to be tough to get over this mark. Here is my concern, that we break firmly above the yearly opening price only by the end of next week for it to crash lower again. And people get caught in a bull trap. And the reason I’m saying that is because of that dollar cycle, and looking at the seasonality of that in the month of May, it’s gone up about 70% of the time. So I’m not taking that lightly. Once again, you’ve got a, a very mixed messaging coming from the Fed last week. Now they’re opening to discussing tapering. There’s still potentially some life there in the dollar. And again, if you’re looking for the currency, that’s really done well against the dollar this year, it’s not the Euro guys, it’s still negative on the year. The pound dollar has done fantastic, which I’ll show you in a minute.
But when we look at the Euro right now, it is still technically bullish, but there are some warning signs here. We’ve got four bars stacked up against this 1.2238 area, the yearly opening price. We do have an MA diff cross to the downside. Our Neural Index is down, and we’ve got a very funny pattern forming here in the predicted RSI where it’s got no momentum here. But this is what I’m saying. You can take what I’m saying about the yearly opening price and make a decision for yourself.
Another way you can do it is straddle and put an order at, say 1.2250. And as soon as it breaks free and clear of this thing, and it closes above it, then it’s going to take probably at least a hundred, 150 pip rally up towards the 1.23 area. But again, we’ve got to get past this obstacle. And this is when these big banks play games with us, right? So they’re banking on that. So if we click on our F8, we look at our key VantagePoint level, 1.2174, and our TCross Long is down to 1.2120. So if we stick with this primary move, we would be long while above 1.2120. I could easily see them running it down there on Monday or Tuesday only to run it right back up again by midweek. And then again, as we get into the end of the month, which is actually towards a weakness Monday or Tuesday, and we get back into the non-farm payroll number, that’s when you’re likely to see the dollar strengthen, statistically speaking, 70% of the time in the month of June.
British Pound versus U.S. Dollar
Now, when we go and look at the Pound Dollar a little bit closer here, the structure of the Pound Dollar looks quite different here guys, than what the Euro US does. The yearly opening here, it’s sitting all the way down at 1.3640. The Pound Dollar has had a very, very good year against the US dollar. I focused a lot of trading, and this is just as new for me as it is for you. I’ve spent many, many years in the futures and Forex market. And what I know is Pound US and Euro US go up and down together. That is not the case since Brexit. Clearly, this chart should evidence that for you, that there’s two completely different trades here now. And like I said, it’s a new thing to get used to, that if the Euro US is going down, chances are the Pound Dollar’s going up.
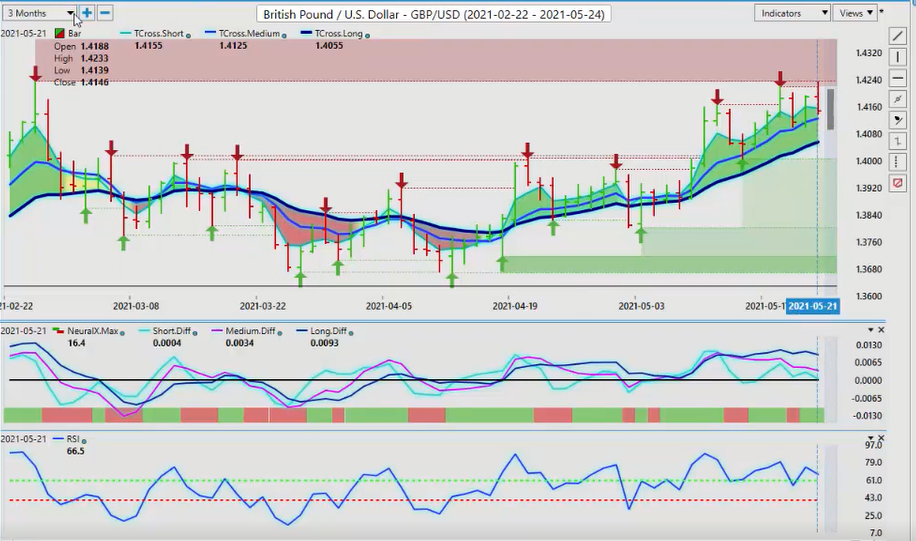
So right now we have very stiff resistance at this 1.4234 area. I anticipate that area will fall, and we will go higher. I am just not convinced it’s going to be this coming week. I believe we’re a few weeks away yet for that breaking, but again, there’s the flip side of that coin is we could get a very good non-farm payroll number in a week or two here, and that could change the whole dynamic of this, right? Or if the Fed starts making other comments. So we’ll look at this, but for now, the TCross Long is 1.4055. That’s the main support level where we would buy down to. Then when we click on our F8, we can see that from an intraday standpoint, using the predicted moving average as a pivot level at 1.4144, we’ve got good buying up there the entire week.
We slipped below there the one day, but then immediately recovered and back up, we go. So again, we just need to clear this 1.4234 area, and then potentially we can get going. But there are warning signs here also. The MA diff crossing, you can see this pink line, the angle of that line, starting to turn down. This is all a warning sign of pending institutional buying of dollars at the end of the month. This is what I’ve seen repeatedly. We do not see that cycle in July and August. And I usually don’t see it in December, but we still have one more month where the dollar has a chance to shine here. So that could be a good place of value to buy dollars potentially. But we have to fail at this level first and continue to monitor the indicators with the critical levels.
U.S. Dollar versus Japanese Yen
Now, with the Dollar Yen, still moving in this sideways chart, really doesn’t have any direction. Here is my respectful opinion only, is triggers. And what I mean by triggers is we want to keep a very close eye on gold prices and Euro US. If gold spikes and breaks above 1900, the Yen will love that. And that will kill the Dollar on this particular pair, and it will fall. The Yen, the Swiss Franc and the Euro are all highly correlated to gold prices. But if gold fails, just remember, and it can’t get above 1,904, then the support level at 1.0834 is likely to hold. We actually have a new verified support level forming at 1.0857. But if we break down below here guys, at the 1.0834, we should see a rather quick move all the way down to 1.0748. And if we lose that, you can see, I don’t have another verified support zone until the 1.05 area.
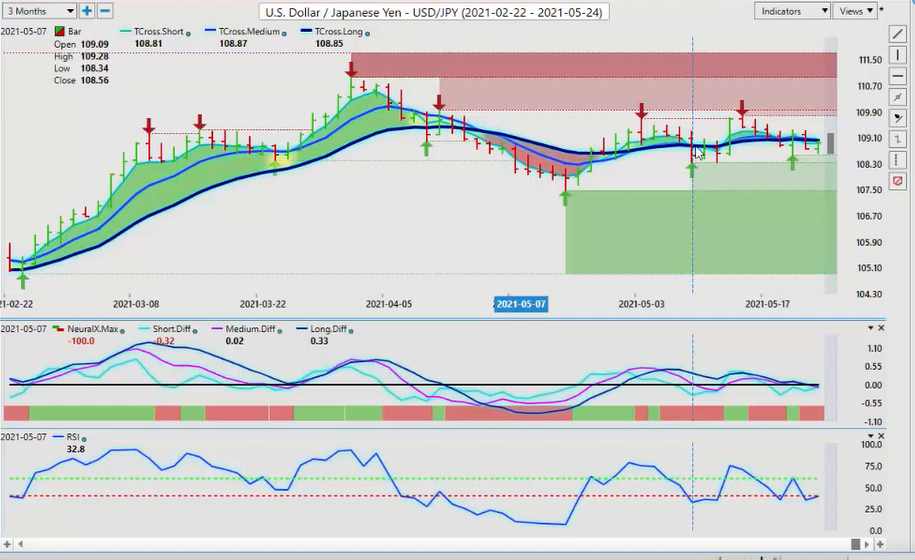
Here is how I would predict that that would play out, if it plays out, is that gold would have to blow through 1900 and move aggressively to the 2000 mark. That would easily push Dollar Yen down into the 1.06 Area. Maybe even the 1.05. So keep an eye on your gold prices. Keep an eye on the 1,904 mark on gold contracts. And if it continues to hold, then you actually may be safe for longs here, at least in the short term for the next week or two. But again, these key levels, the VantagePoint indicators, they’re still not giving us a solid buy signal here. We’ve slipped and closed below this twice, right here, there, and there, we retraced back to the predicted moving average, and then it got slammed lower again. Friday is mixed price. So again, when we look at this by Tuesday, we’ll have a good idea of the further direction with this pair.
U.S. Dollar versus Canadian Dollar
Now, as we move into the US Canadian pair, the US Canadian pair’s coming into some very, very heavy verified support. And this is the benefit of using those zones in the VantagePoint software is that we can come out multiple years to find these levels. Now, if we come all the way back four or five years, this is where you’re going to start to see these levels. And they’re coming in around 1.2082. And if I go back, I think another year, you’re going to see an even bigger level around the 1.19. I believe that’s it right there. Where are we here, at the low on that 1.2157. I’m going to have to go back even further to find that. I believe it’s around 1.1918 if I keep going on this. Where are we here? So if we look at this, we start getting into some real congestion here with the indicators. But the area between 1.1918 and the 1.2050 mark is very, very heavy support.
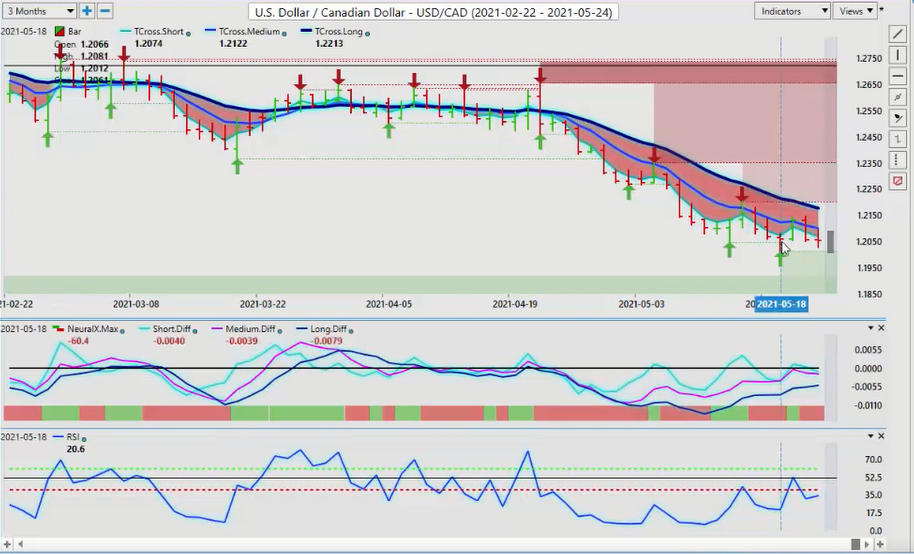
So if commodity prices like oil, equities start to soften up, there’s any talk about a change in direction of interest rates, then that’s going to hurt the Canadian Dollar and it’s going to hurt the S&P. So right now we have a newly formed support, verified support low at 1.2012. I’ll respectfully submit that longs would be reasonable between that level provided stops are below 1.119, 1.1890 something along that line. And a hundred pips guys is a small amount. It’s one penny. That’s all it is. So if you need to use a bigger stop loss, then you lower your position size to allow for that.
But this is getting very overdone here. Again, Canada’s starting to slowly come around, come out of the pandemic. Things are very modestly improving. I get to golf next week. I, I haven’t golfed in a month because we’ve been locked down and then we were locked down months before that. So again, the vaccination’s getting out there, things are improving a little bit. But for now, the further we move away from this TCross Long at 1.2176, the more likely it is we’re going to retrace to it. So keep an eye on that. But the trigger here will be when we close two days in a row above the long predicted, 1.2087. We need again, to close above that in my opinion, at least two days in a row. But you can see that we’ve just closed two days in a row below this blue line. So it tells me that we’ve got probably one more push to the downside, and then we’re going to reverse.
Australian Dollar versus U.S. Dollar
Now with the Aussie and the New Zealand, both of them are struggling with their yearly opening prices here. The Aussie rate around the 77 mark. This is a big level here. You can see that it’s desperately trying to get over this area and stay above it. It’s been doing relatively well in that regard since April the 14th, but we do again, still have, in my opinion, respectful opinion only, we have one more bout of dollar strength coming before summer. I believe it will be the first week of June. So when I’m looking at this right now, watch the 77 level very, very closely. The indicators are incredibly mixed on this particular pair. If we click on our F8, you can see that we’re all on both sides of this predicted moving average. Again, the market is very, very indecisive on this particular pair. They’re not willing to bite on it because the stocks are up one day, they’re down the next. So that’s showing up on pairs like Aussie US, New Zealand US.
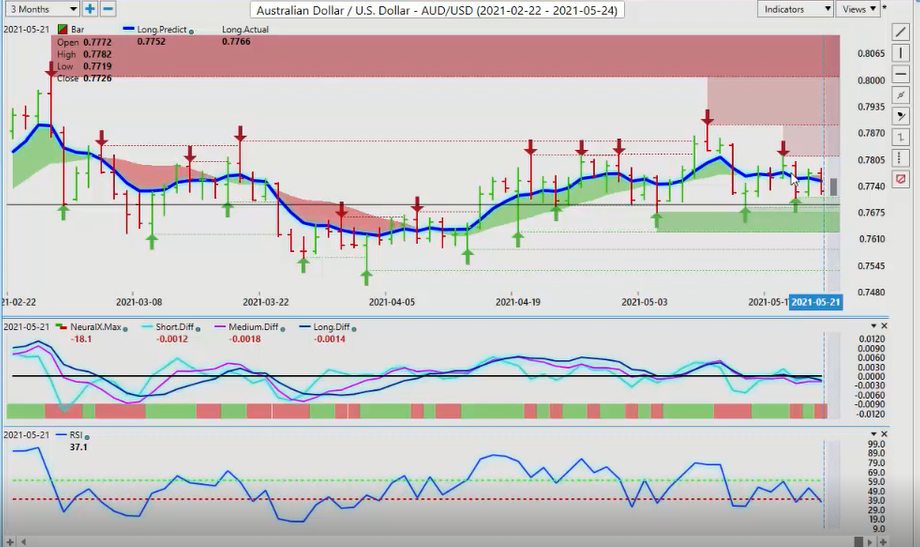
I’m shocked that US Canada has been selling off the way it has, but that was influenced heavily by the Bank of Canada, in my opinion, making those inappropriate remarks, that they’re going to hike before the Fed. I don’t believe that that will happen one bit. I believe that they will have to retract that statement actually.
So when we look at this right now to start the week, you’ve got this pivot area of 0.7552, and you’ve got the yearly opening price at 0.77. Play a break on either side of that guys, and you’re likely going to see your bigger move.
New Zealand Dollar versus U.S. Dollar
The same concept would apply to New Zealand. New Zealand continues to hold just above its yearly opening price. But again, it’s just moving sideways here. It needs a catalyst to get it moving. So once again, as long as stocks stay strong, then there’ll be demand for the Aussie, for the New Zealand for the Kiwi.
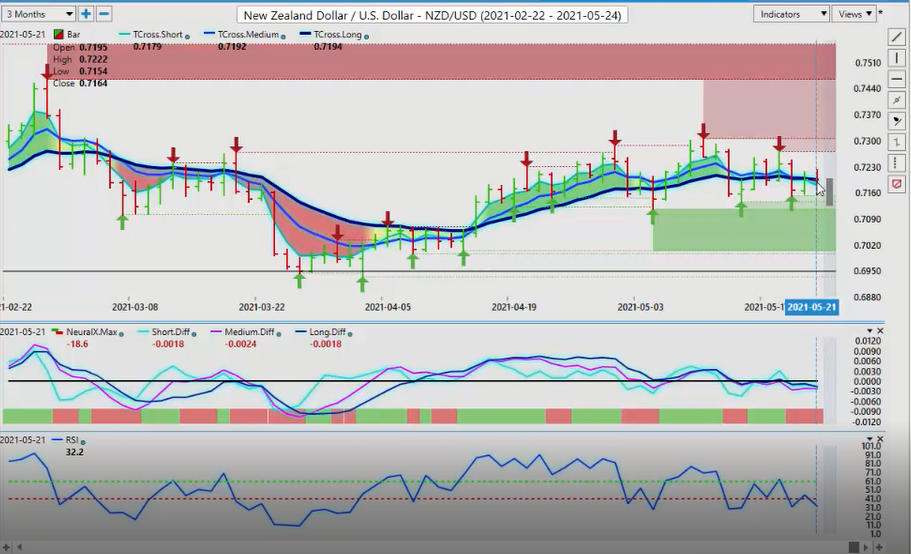
But if the stocks don’t hold their value, these pairs can come under significant pressure, these currencies, the Aussie, the New Zealand and the CAD. So we’ll continue to monitor things next week. As I think I already stated there’s a few Fed members speaking next week. Be careful around that because the market is just looking for a reason to say the Fed is wrong, including me. And if they get any sense that the Fed is going to flip-flop, a lot of these markets could turn around very quickly. So with that said, this is the VantagePoint AI market outlook for the week of May the 24th 2021