


Welcome to the Artificial Intelligence Outlook for Forex trading.
VIDEO TRANSCRIPT
Hello, everyone and welcome back. My name is Greg Firman, and this is the VantagePoint AI Market Outlook for the week of August the 9th, 2021. Now to get started this week, we’re going to begin where we always do with that very important US dollar index. Now, we’re coming off a very, very strong unemployment number. I didn’t really see anything bad in that report at all, but I’ve seen reports similar to that one in years past.
U.S. Dollar Index
Now, what we want to assess here with the dollar is that there is still an institutional cycle that takes place around the beginning of the month, the end of the month into the first week of the new month, and I have seen the US dollar sell off on a regular basis shortly after that payroll number, regardless how good or how bad it was. I’m not saying that’s going to happen. I’m simply making people aware of that, that there are institutional funds that need to buy US dollars. Once they’re done doing that, then the dollar is left to fend for itself.
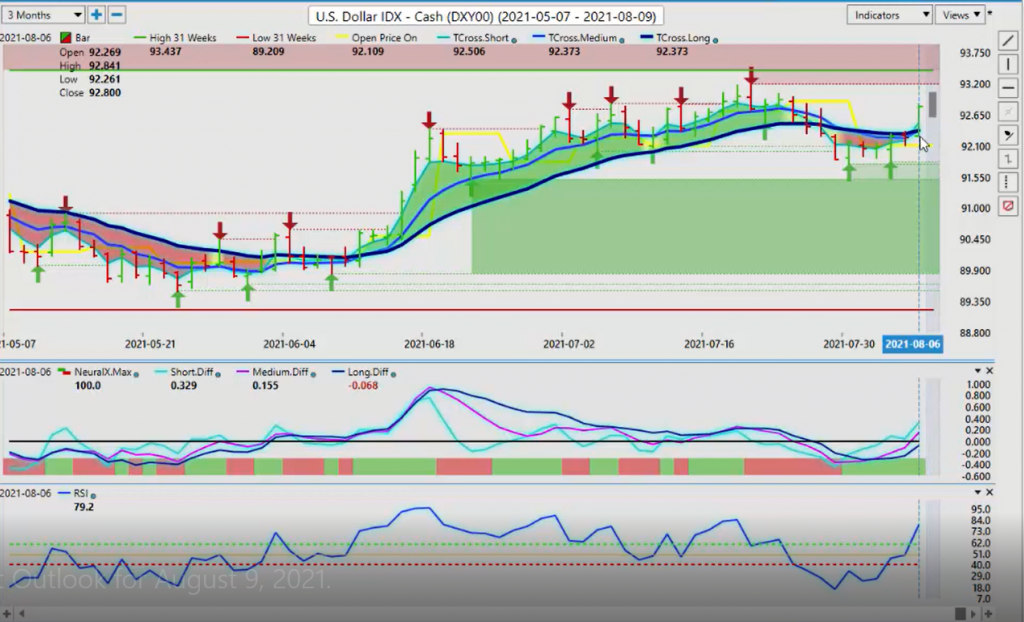
So at the current time, we can see the indicators we’re using this week. I will bring that up so everybody can see that. The 52 week look back, excuse me, has been modified to 31 weeks. For the case of this presentation, we’re just going to call that the yearly range. We’re using bars, not candles, the long-term predicted difference, the medium-term predicted difference, the neural index, point in time. The point in time is set to one week.
Every week, the point in time draws this yellow line across the screen to give me that weekly opening price, which all discussed further in a minute. We also have the predicted RSI, the short-term difference, the triple cross, and of course, one of my all-time favorites, the verified support and resistance zone. In this, we’re studying inner market correlations, key indicators in the VantagePoint software, and price action. Very, very important that we always look at price. When I’m looking at this previous week with the dollar, we can assess here the weekly opening price.
On Wednesday, the market moved above the weekly opening price and closed above it. However, it did not breach the T cross long at 92.31. After the Friday payroll number, of course, it had no problem blowing through that. The direct inner market correlations, again, I will simply put it out there, I’m not making an argument either way. I’m saying what I’m noticing with these inner market correlations is there is two main camps in play here, the dollar and Bitcoin going up and down together and the Euro and gold going up and down together.
That was verified yet again this past week. Any signal in dollar strength, Bitcoin immediately responded with it. When I look at the dollar index right now to begin the week, our key support level is 92.37. However, we can also assess here our yearly high is very close by at 93.40. Our yearly low 89.20. The open on price for the week is 92.10. That number will be adjusted automatically in the VantagePoint software. On Monday night’s update, we will get a weekly opening price. You can draw that right onto your live charts.
You can draw it onto the VantagePoint software by clicking on this right here and putting a horizontal line. They’re very, very easy to do. Now, what we will take notice here is this move in the dollar. Again, we have a triple EMA cross forming, but the MA diff cross, the medium-term trend was weakening against the longer-term trend to the downside. This pointed to a reversal.
The RSI starting to show momentum and breaking higher, but we can clearly see that the MA diff with the neural index was a very powerful contrarian indicator when we also combine that with the verified support low at 91.78. These are the levels we want to watch very closely. If we’re going into next week’s trading, where we have to be careful is, again, bringing in that yearly high at the 93.43.
If the dollar is going to go into a longer term trending move to the upside, which I am not at all convinced that that’s going to happen, we would need to break through this level, stay above it, close above it multiple days in a row to get that confirmation. But very often what happens is you have order flow traders sitting just above these resistance points and they’re waiting to sell. Now, just remember that we’ve had one very rock solid labor report, but only one. Is that enough to get people going into the dollar on a long-term basis?
That is left to be seen. Again, we watched to begin the week our key support level 92.37. If we click on our F8 in our VantagePoint software, this is the hot number we want to watch very closely, the long predicted 92.41. These are the levels that we need to hold above if the dollar is going to continue to advance towards the 93.48 level. Now, with that big move in the dollar and that very, very solid labor report, obviously gold did not really care. Gold really took it on the chin on Friday, but it really didn’t have a great week to begin with.
Gold
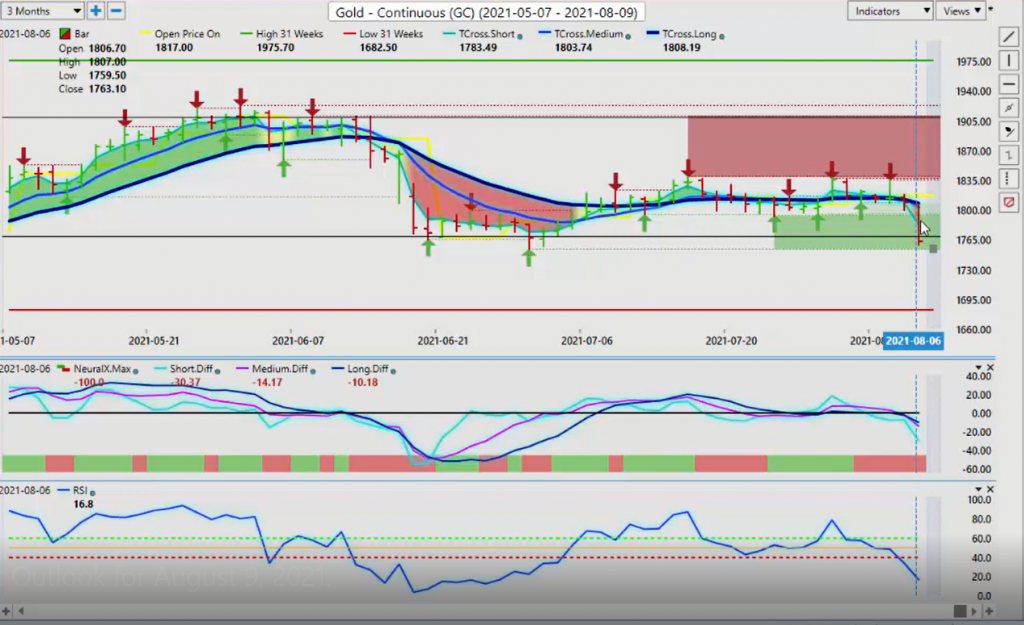
When we look closer at gold here, we can assess here that using that weekly opening price with the key VantagePoint levels, mainly the T cross long and the long predicted, we can see we’re struggling right along here. Then on Thursday, we started to break down, but I will point out that yet again, the MA diff cross, the pink line crossing the blue line with the neural index, told us that gold was getting ready to plummet.
Now, when we look at our 52 week, which, again, we’re just going to call that, it’s been modified to 31 weeks, it’s our yearly highs and lows, that low now potentially could be in play. You can see it’s right here, 1677.64, but we must break down under this level, this support level, the verified low at 1752. If we break through 1752, which I would probably say is inevitable at this particular point, at least at the beginning of the week.
But if we don’t break down below that and we still have buyers here, that will warn us that that dollar cycle could still be in play here, meaning that the dollar is not going to hold onto these gains by Wednesday or Thursday, maybe even Tuesday of this coming week. Watch that level very closely. But the VantagePoint indicators are pretty solid here with that MA diff cross break… The slope of them were breaking below the zero line. The neural index has been onboard for multiple days, and the predicted RSI is warning us that we have significant momentum.
Now, you’ll notice I’ve modified this RSI to a nine period, and I’ve also changed the overbought and oversold from 80 and 20 or 70 and 30 to 60 and 40. I’m not interested in any kind of overbought/oversold. I’m looking for momentum. Case in point, if we look at the last time gold had this significant sell-off, you can see that the RSI broke down below 40 and it stayed below this level for quite some time. And only when the slope change and we started to break above the 50 did gold recover.
Again, we’ll be watching this one very closely, but clearly there’s a bearish undertone to it to begin the week. Now, if we look at… Again, we do a comparative analysis to Bitcoin versus the US dollar. These are very similar looking charts here. We’ve had a retracement down. The weekly opening price here, you can see it if we count back here, one, two, three, four, five, we can see here that, again, with that weekly opening price, the way that that’s been set up is that we needed to get back up above this. We managed to do that.
Bitcoin
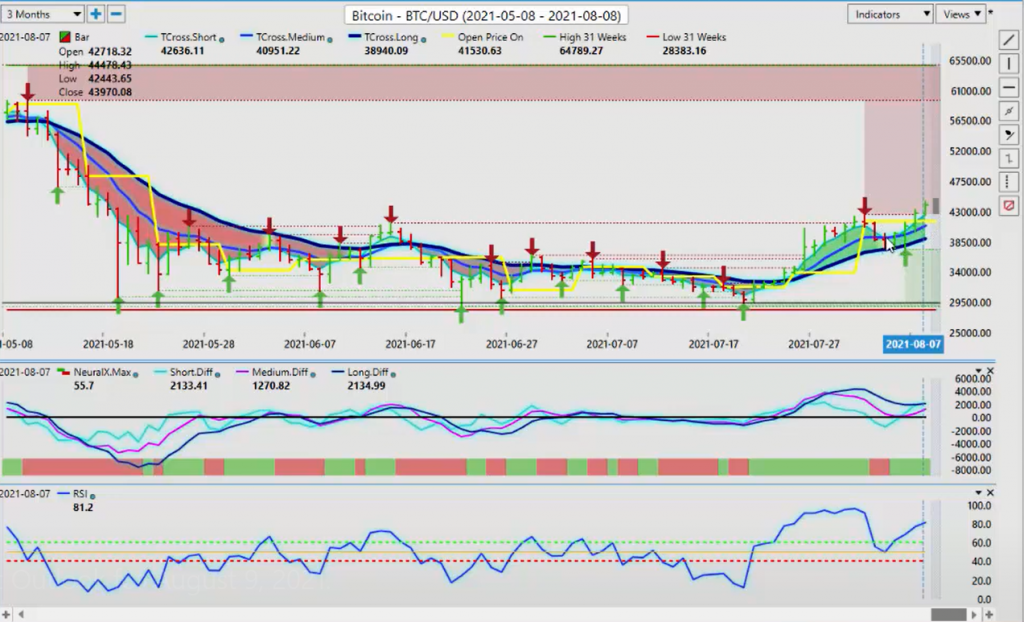
Actually on Thursday and on Friday, Bitcoin really made a move. Now, this is the level you want to watch, that break out point of 42,556. Once again, I think everybody knows my opinion on Bitcoin. Again, the annualized returns, I know it’s been volatile. I know it’s had big moves up and down, but how is that any different than some of the old stocks like Apple stock or the tech sector stock where they were all over the map for a little while until they settled into a groove?
I don’t know if Bitcoin is in that groove yet, but it certainly looks like it’s getting ready to make a move again. But we do need to hold above this 42,556. Like I just said with the US dollar index, you’re going to have order flow traders here that are going to try and short this thing. We’ve got to be a little bit cautious around that particular level, but that’s when we bring in the VP levels. The T cross long, we’re coming in at the T cross long at 38,940. If we click on our F8, this is where it gets very interesting.
Because if we look at the blue line, the predicted moving average by itself, 41,572, that’s the level that I’m looking to hold. I am not concerned with excessive dollar strength and pushing Bitcoin down because that’s not what’s been happening. It’s the Euro that’s been getting beat up by the dollar along with gold. So again, Bitcoin seems to be riding the wave with the dollar strength and the dollar weakness. If that US dollar does start to sell off, then it would be reasonable to suggest there’s a strong possibility that Bitcoin is going to follow.
But right now, we watch our main levels. We’ve got a nice bounce here on the MA diff cross off the zero line. The zero line being rejected. Now, the zero line on the predicted difference is the difference between bullish and bearish. Very similar to an RSI at the 50 level. We will watch that very closely. But for now, it appears to be a very firm buy signal. Now, the stocks will be questionable what we get next week with stocks, because again, the noise is going to surface again about the Fed raising rates. I don’t think that the Fed is going to change his view.
S&P 500 Index
I think he’s going to say exactly what I just said. It’s one report. It’s not a be all and end all of reports, and he’s going to probably stick to his guns. There’s a lot of talk that Powell may not get reaffirmed by the current administration in the US, so I’m watching that development very closely also. I believe that he will, but there is a lot of rumors that there’s problems between the central bank and the current administration. I’ll be monitoring that. But right now, when we look at the S&P 500, clearly shorts have been very, very difficult.
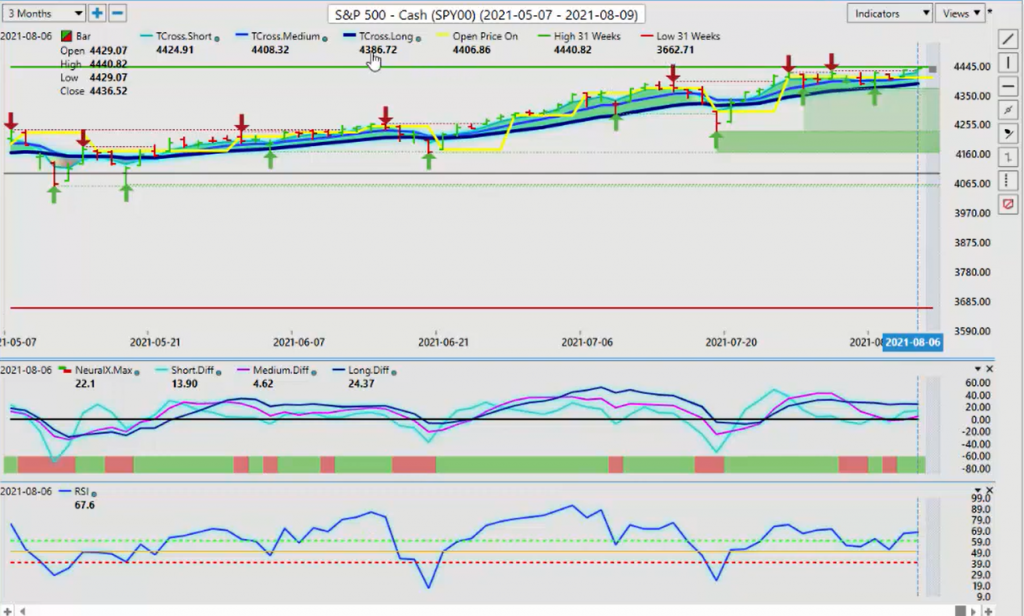
When we look at the VP level, we can assess from that VP level here that, again, that support low, the T cross long, 4386. That’s the level you want to keep a very close eye on. When we click again on our F8, we can see that that pivot level with the long predicted 4413.50, I would prefer that we stay above that. But again, we’ve made multiple new yearly highs, because our yearly high now is at 4440. Hard to believe we’re up this high, but we are. But the 31 week low is all the way down at 3662.
This makes me a little bit nervous that there’s a very large gap between the yearly high and the yearly low, which screams of a retracement. Not necessarily a trend reversal, but at least a retracement. I’ll be watching that closely next week. And if we get continued rhetoric from the Fed, or if the Fed even hints that he’s going to flip-flop, that could be a death blow for the S&P. But again, I don’t think so. Everything I’ve seen with that is it just keeps going higher. It has a big corrective move, and then it turns around.
Crude Oil
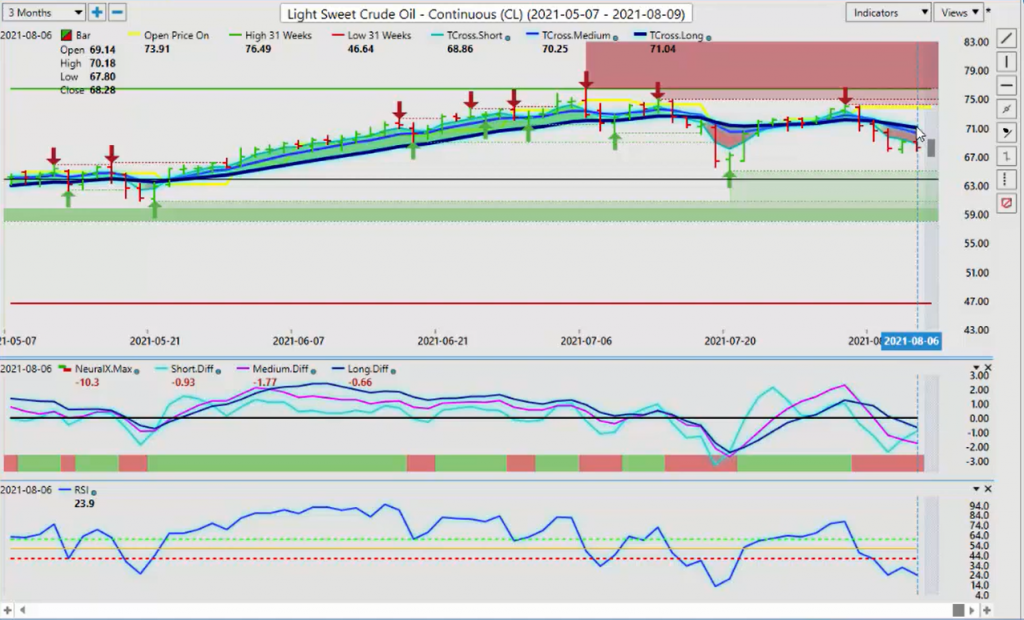
But I will make the argument here that when I look at this from the inner market correlation standpoint with oil, oil is still moving lower. We don’t have a buy signal forming here yet. Again, the 52 week range on that, or excuse me, the yearly opening high and low on that is 76.49, and then the lower side of that is 46.64. What could play a big part in this too is if the Delta variant COVID takes hold of the US and some of the other major economies and things shut down again, that could hurt oil and it could hurt equity. We’ll be watching it.
But again, right now, that key VantagePoint level 71.04, when we click on our F8, this is the key level where we get very close to price. That pivot to begin the week is 69.62. One of the ways that I’ve often discussed on here and and the VantagePoint live training room, that if we believe that equities are going to go higher and oil is going to follow, then we would use this predicted blue line and put our by limit orders just above that. As soon as it pushes above that VP level, we’re sitting there waiting for it. We’re not chasing price here, guys.
We know exactly where we want to go after this thing. And if it pops above that, it grabs the long trade and away we go. Now, that’s a strategy. There’s no recommendation being made there to clarify for longs are short. You know the regular disclaimers, but I’m just simply pointing that out as a very effective strategy when you know a critical level. Now, as we move into, again, some of our main currency pairs starting with the Euro-US, the inner market correlation that you always want to keep an eye on here is gold.
Euro
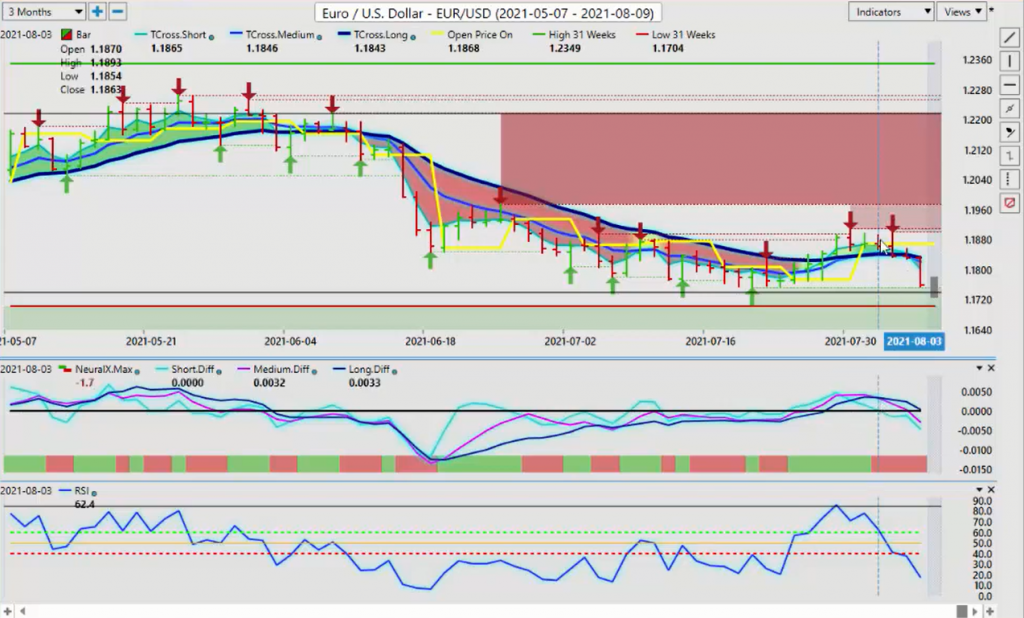
Gold and the Euro are positively correlated to one another. You can see this big down bar on the Euro and it matches the big down bar on gold. So again, you can see that they’re virtually identical, particularly if we look at Thursday’s price and Friday’s price. They are literally… It’s hard to even tell those two charts apart, right? Whenever I’m trading the Euro pair, I’m always keeping an eye on that. But to be clear, the signal to get short on this was way up here.
We actually did this in the VantagePoint live training room last week in real market conditions. You can see the pink line crosses over the blue line. The neural index turns red, bang, bang, bang, down she goes. The only negative that anybody could ever put on the MA different cross is that it’s usually early. It’s usually early to the party. That’s the worst thing I could say about it. Often when I have taken trades with this, they usually immediately go against me for maybe an hour, maybe a couple of days, but the outcome is also usually this.
When that signal starts to develop and that neural index stays red, there is a bigger short coming. The predicted RSI breaking down below the 60 level, not looking at overbought and oversold, guys. No, no, no, no, no. We’re looking for momentum from this indicator. We modify the indicator and speed it up from a 14 period to a nine period in the VantagePoint software, and then we modify the overbought and oversold conditions to 60/40. We’re looking for that break to see if we’ve gotten momentum, and we did.
Once again, my view is that advanced in our market technical analysis, the price is being worked in here. And as you can see, somebody was buying dollars, but it was way back here, almost at the beginning. I would argue Tuesday and Wednesday of last week is when this move actually started. The ADP report is basically… I think it’s a wash. I don’t even think as traders we should even be looking at it until it corrects itself. It’s been off at least 300,000 jobs every month for the last six months. My argument that I made in the VP room this week is just that.
If they’re forecasting 300,000 jobs and ADP report has been off 300,000 jobs every month for the last six months, then you’re telling me that the US is going to create zero jobs? No. That means right away it’s going to be probably closer to the 600,000 mark. But the U6 number was very good. The different areas of jobs being created was very good. The ADP was off a mile. And again, they were often the revisions too. The previous month was revised higher in jobs, not lower. The ADP report, again, suggested the opposite.
I warned everybody and said, “Look, if you knew something on a six month basis has about a 0% accuracy rating, why would we even look at it?” But in this week, it was kind of a freebie because they forecasted 300,000 jobs. And I said, “There’s no way. Arguably the biggest economy in the world is going to create more than five or 10,000 jobs,” assuming they’re going to be off by 300,000 again, right? The Euro, we are coming into some pretty heavy support here, guys. When we look at the yearly highs and lows using that look back, we’ve got 1.1704.
We’re closing the week at 1.1760. Once again, if we break down below the 31 week low, then the Euro could start to really run to the downside. But it’s still, in my respectful opinion, going to be determined by what the next move on gold is. I’m still not a strong gold seller here because of the aforementioned, what we’ve discussed here so far. But keep an eye on these levels to begin the week. T cross long is 1.1833. When we click on our long predicted and use that predicted moving average by itself is 1.1822, so we know exactly where to sell this thing from.
Right now the predicted high for Monday is only 1.1780. How you would use this with your software is you will identify, first of all, am I a buyer or seller? I think we’re sellers. I think we would agree. We identify the three levels that I just gave you, 1.1780 is the potential starting, 1.1822 and 1.1833. Easy peasy, right?
Swiss Franc
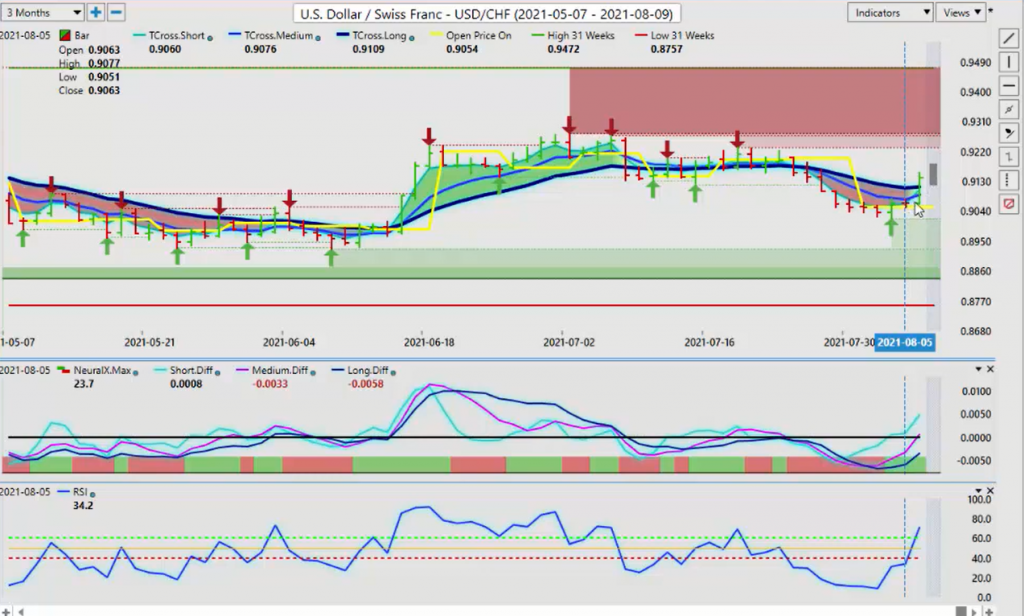
Now with US-Swiss Franc, it is making a move. There could be very good value in longs here off of that T cross long .9112. That’s the key level. Once again, you can see what happened here last week on that weekly opening.
It was Wednesday when it started to make its move above the weekly opening price, then it used the weekly opening price as a pivot area to bounce from on Thursday. And then on Friday, it took off and it cleared the VP level. So now that is an area of interest to us, which is .9112. Again, if I click on the F8, we come back, we get that additional support level of .9087.
The way we would look at this, again, long, we’ve made the decision based on the MA diff cross, the neural index, the predicted RSI, the additional indicators here, and we’re saying, “Okay. Now we just have to pinpoint a level of where we would target.” That level would be between .9087 and .9112. That’s the way we would look at this via our VantagePoint software. We don’t want to focus just on the predicted high and predicted low. We certainly don’t want to put stops around that either.
We want to make sure all stops are always down below the blue line, the long predicted, or the T cross long. And don’t forget about my favorite, the verified support. That verified support low is coming in at .9018. I think it’s very unlikely we go down that low. But again, additional support would tell us that we should have our stops below that particular level. Now, as we move into the pound-dollar, the pound-dollar took a hit here, guys, but nowhere near as much as the Euro did.
British Pound
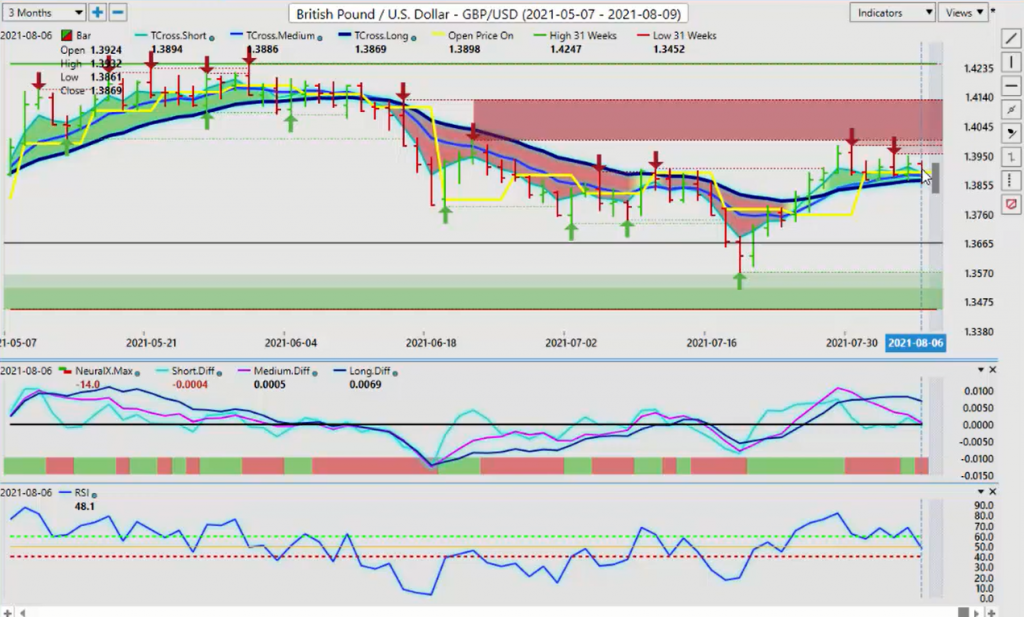
Remember with Brexit and everything, Great Britain-US, Euro-US, not really just an identical trade here anymore. It’s being affected by Euro-Great Britain. If the Euro continues to come under pressure, that may stabilize the British pound. But right now, we’re sitting on the VPs. We closed the week at 1.3869. Clearly it did better than what the Euro did against the US dollar. We would look to see if we’re going to break down below this. But once again, when you’re talking about a straddle type play, we know exactly where that level is, at 1.3869.
We’re simply putting a limit order just below that T cross long. And when it breaks down below there, we have a potential, just a potential to run down to that next verified support low, which is all the way down at 1.3572. I am not convinced that it’s got enough push to get down there, but it is definitely possible. Our first obstacle is, again, to get below that VP T cross long and close below it. Now, with the dollar-yen, again, we could be seeing some good value again on longs. We’ve come down.
We’ve hit these verified support low, made a new recent support low at the 108.72, only to recover. Again, the culprit here in how to get into a trade quicker and, in my respectful opinion, highly accurate is the MA diff cross, measuring the medium term trend against the longer term trend. When that pink line crossed up, the neural index turn green, that led to a reversal long before it took place. So now our T cross long to begin the week is going to be coming in at, again, 109.87. When we click on our F8 in our software, that pivot area, 109.79.
In this particular case, I like the set up. The predicted low is sitting at 109.85. This is exactly what you would like to look for in a trade setup. We know this on Sunday morning, right, when this presentation is being done. Sunday morning, you can see my clock there, and there is no snake oil here, 11:27 AM. We’ve already pre-identified our potential entry points, right? That’s the level you’re going to watch and we need these indicators to remain positive.
Canadian Dollar
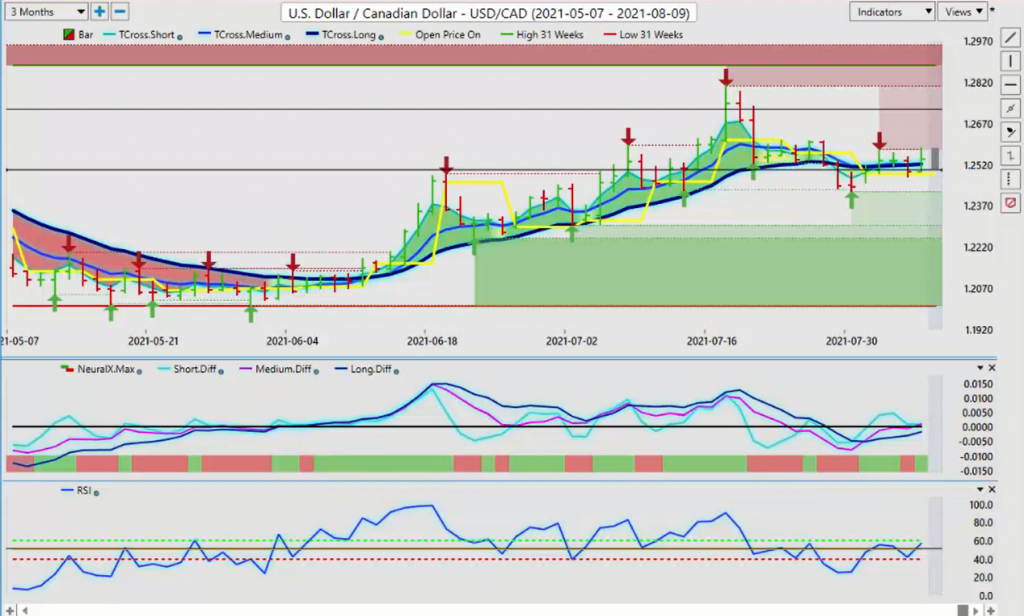
Now, with the US-Canadian pair, our main equity or support or equity/slash commodity currencies, the Aussie, the New Zealand, the CAD, right now the CAD report was not great on Friday. It was okay, but the market feels that the Bank of Canada is still ready to raise rates next July. I’m not sure about that. I’ll remain neutral on that until I get more data. But right now, just remember, if the US dollar gets very strong very often, so does the Canadian dollar, because they’re the two largest trading partners.
Anything that’s good that’s happening in the US usually is positive for Canada and vice versa. For now, we’ve got a verified resistance high at 1.2575. We must clear that if this pair has any chance of going higher. But again, this is going to be dictated by oil prices and by the S&P 500. If those two go up, this pair goes down either way. The inner market correlations will reign supreme.
I know people will argue with what I just said, but I’ve been in this game for a very long time and an inner market correlation can trump a standard indicator very, very easily and it’s real time. Right now we know where that is. Our support on the downside here is, again, that T cross long 1.2571. Be very careful with this pair. Whatever it does on Monday, 80% of the time, it does the exact opposite on Tuesday. I’m watching the predicted RSI. And as you can see, using that 60/40 split, we don’t have a lot of momentum here.
That’s what is concerning and the fact that we’re not getting above here. Now, what could… I’m going to give you a scenario here? What I think will likely happen is we’re going to pop above that on Monday. And then on Tuesday, it’s going to violently turn right back down again, and what will help it pop over that will be oil prices sliding and the S&P 500 correcting lower. That will put upward pressure on this particular pair. But again, watch for that reversal on Tuesday and know your levels. That VantagePoint long predicted, that number, 1.2531.
Australian Dollar
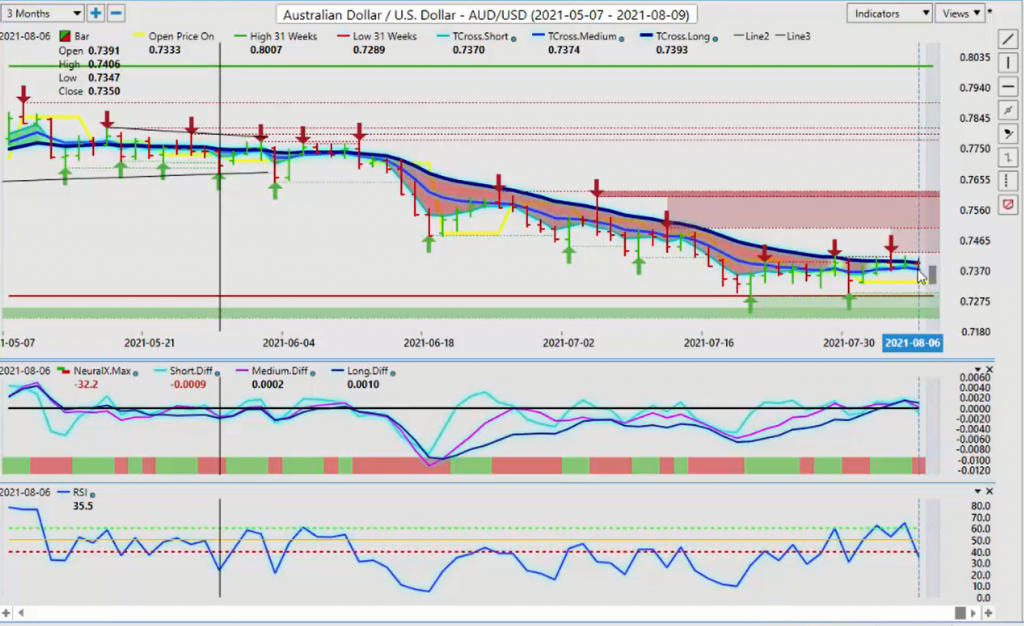
The other option you can do here is put limit orders just below that. So if it does go crashing lower, you’ve got a limit order there sitting there waiting for that to happen. Now, the Aussie and the New Zealand, both of these two pairs have the exact same signal to start the week, again, further suggesting that the equities could be in a little bit of trouble here because of that high correlation. But we can see that the Aussie is banging into this T cross long and it can’t get through it.
Now, our MA diff cross has crossed to the downside and the neural index has gone from green to red. This is a very fresh signal. That pivot level, the T cross long, is .7393. We’re closing at .7350 here. I will further point out, using that yearly high and low, you’ll notice that the Aussie has most more recently, as I discussed in last week’s weekly outlook, has made these new lows very recent. It is very, very bearish at the current time. We’re going to look to see if this signal is starting to develop, but you can see it’s already in play.
New Zealand Dollar
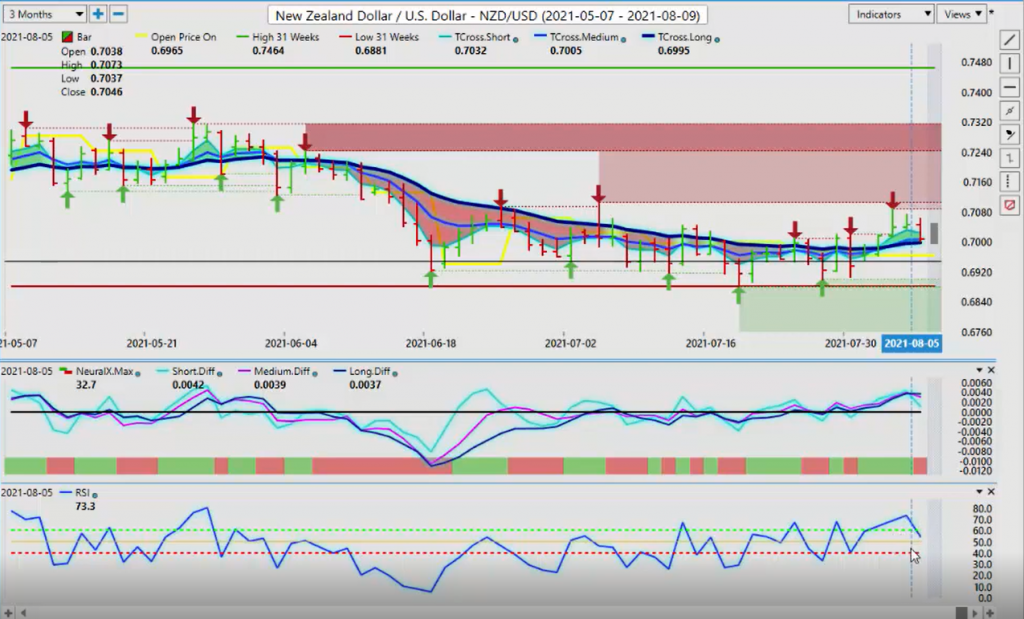
Again, this is Sunday morning at 11:30, we’ve already got a plan in place. We can tag limit orders right into that particular level. And again, if we use our long predicted at .7374, we know exactly where our resistance zones are. The same trade is there with New Zealand, but the thing is, New Zealand has been stronger than the Aussie all the way along. Maybe with the same exact signal, the crossing with the neural index, a sloping downward RSI that slipped back within the 60/40 channel, there may be better value shorting this one.
But the only thing is, we’ve got to get through that T cross long. That level is .6997. Again, you can tag limit orders just below .6997. The market plummets and breaks through the VP level, you’ve got to limit order sitting there waiting. That is just a suggested strategy. There is no recommendation of buying and selling currencies or anything else. This is an educational channel only. With that said, this is the VantagePoint AI Market Outlook for the week of August the 9th, 2021.