


Welcome to the Artificial Intelligence Outlook for Forex trading.
VIDEO TRANSCRIPT
Hello everyone and welcome back. My name is Greg Firman, and this is the VantagePoint AI Market Outlook for the week of April the 26, 2021.
U.S. Dollar Index
Now to get started this week, we’re going to begin where we always do with the US dollar index. Now, dollar continuing under pressure here mid-month. What we can assess here, what I’ve discussed in the VantagePoint live training room, and here on VantagePoint AI YouTube, is monthly cycles in the dollar. Where there’s actual real dollar demand, where people must buy dollars. That’s usually at the very end of the month, up until about eight days into the new month.
So what we can assess is that we have a new verified support level recently formed off this low at 90.84. This black line down here represents the yearly opening price. We’ve had a retest of that level already back in February, and then a nice rally off that area. So right now, without getting into a lot of debate about this, the dollar is bullish on the year, it’s positive on the year. It has not been below the yearly opening price. So until such time that it gets below that level of 89.90, then it still remains bullish as we come into a known period of dollar buying with institutional funds, pension funds, et cetera.
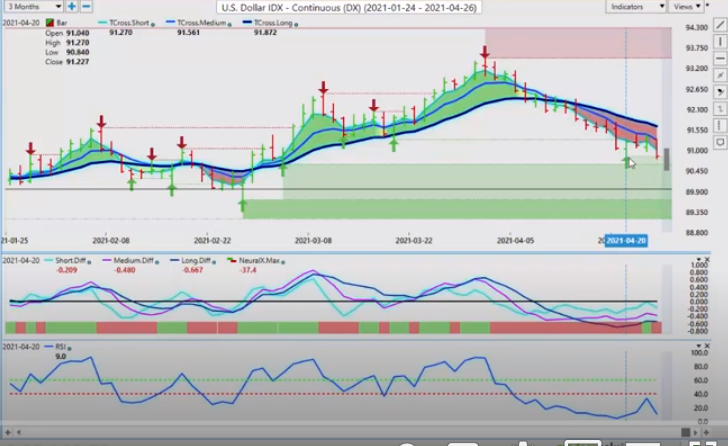
So when we look at this, our medium term crossing, our longterm predicted differences costs, has crossed several days ago warning us. One of the best ways to do this, again, we don’t like to rely on one indicator by itself. We like to combine the indicators together. So we will look for a solid green bar on the neural index with the medium term crossing the longterm predicted difference. I would suspect we will likely see dollar strength by the middle part to the latter part of next week.
The key resistance now in VantagePoint, again, an additional way that we identify the primary trend, is if we’re above or below, excuse me, the T-cross long, 91.64. That is our key level. When we click on our F8, you can see that we’ve had multiple challenges for the last three trading sessions banging directly into this long predicted at 91.35. So to begin the week, this is the level you want to watch, currently 91.19. If we close above this level two days in a row, but I would argue even one day is pretty good. If we close above that level, that will tell us that we’re going to correct back higher, or the primary trend in the dollar will at that time continue. When we look at the S&P 500, we like to do that the exact same way.
So we’re going to scroll down here. I prefer personally to… I go back and forth between the futures and the cash price. I like the cash. But we can see that the last time the medium term crossed the longterm predicted difference cross to the downside. Then we continued to move higher for about seven trading sessions, not ten, seven. So when we look at this, we can then assess that during this entire period, the neural index has been green this entire time. When neural index turns red and it matches the medium term crossing the longterm predicted difference, that warns us that we’re going to move in the opposite direction of the primary trend. It doesn’t mean the trend is going to change here, guys. What it means is that we’re going to move, we’re going to correct, in this case lower.
Now the predicted differences also have come down, kiss the zero line here, and they’re now bouncing back off of it.
S&P 500 Index
Remember also with the S&P 500, it is being heavily manipulated by the FED. We have the fed coming up next week. They’re going to try and, again, continue to force people into the equity markets. That’s by saying that they’re not raising interest rates. I’m in the camp with a number of other economists that do not agree with the FED’s position by ignoring this inflation. But again, that’s a whole nother debate.
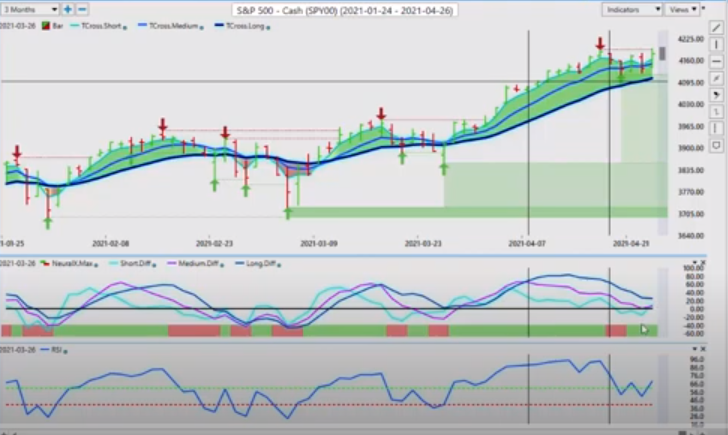
So we’ll see what the FED has to say on Wednesday of this coming week, but it’s likely going to boost stocks higher again. Now just remember, to identify the primary trend, 41.07, we’re were long while above that particular level. If we click on our F8, you can see that we’re getting all tangled up in this VantagePoint long predicted. 41.58, that’s the level you want to watch to start the week, but it’s very unlikely that stocks are going to take much of a tumble here, knowing that the FED is going to basically try and push the US dollar down and talk up the economy, while at the same time contradicting themselves and saying that they’re not going to be raising rates. So it should be an interesting press conference to say the least.
Gold
Now when we cross-reference these to gold, gold continues to advance here. But once again, when we look at the verified support or resistance zones in VantagePoint, in this case, you can see we’ve got a light pink color, then a slightly darker color, then a hard red up here. Very, very heavy resistance. So right now, gold mysteriously sold off on Friday, pretty heavy into this newly formed VantagePoint verified resistance zone. So the high of that level is 17.98, but I would anticipate before, we would still come up and at least try and test the 18.17 mark, this additional verified resistance up here. Now, my view again is that with stocks advancing, the dollar’s doing relatively well, Bitcoin’s still holding in there despite it’s bit of a sell off last week. Still not an awful lot of buyers in gold up here, is all I can say.
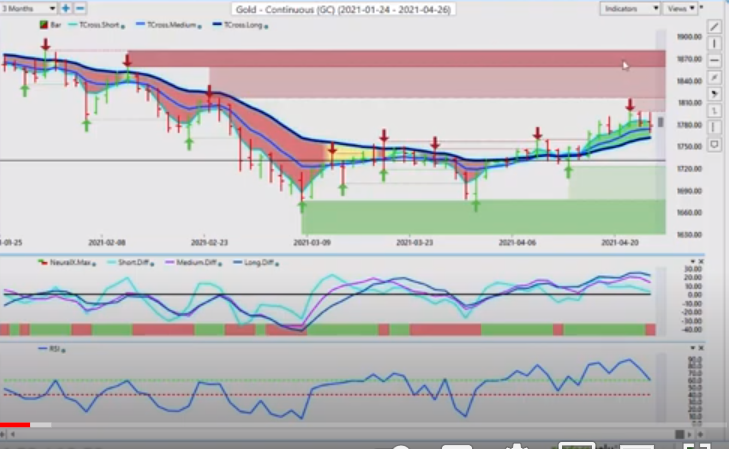
Now, very similar to what we looked at with the S&P 500. We can see the medium term crossing the longterm predicted difference. But during this entire period, as it’s rising, the neural index has been a solid green. So combining these two indicators is very powerful. Now the neural index has switched back to red here, and we’ve got a falling RSI, so the support level that we’re likely going to be tested. Now, just remember if you cross-referenced this to your inner market correlations, we know what that is. That’s an easy one, the dollar up, gold down. So if the dollar getting ready to move higher, my view is that those institutional funds know this, and they were bailing out of gold on Friday. Because for at least a week or two, until after the non-firm payroll number, the dollar is likely to recover somewhat, even if it’s only a corrective move higher.
So we will continue to monitor gold. Right now, we can see that that level is 1762. If we click on our F8, get a little bit closer to the fire here, we can see again on Thursday and Friday, I would argue on Thursday, the long predicted at 17… And I know we didn’t, we closed at 1782. So we’ve closed one day below the key VantagePoint level, but that is the first time for the entire week. And once again, you can see the trading week as the market is in constant contact, almost on a daily basis, with the VantagePoint predicted moving average. So when we close below it, that’s usually a warning sign, and the additional indicators are also telling us that if nothing else, gold is likely heading back to 1762.
Crude Oil
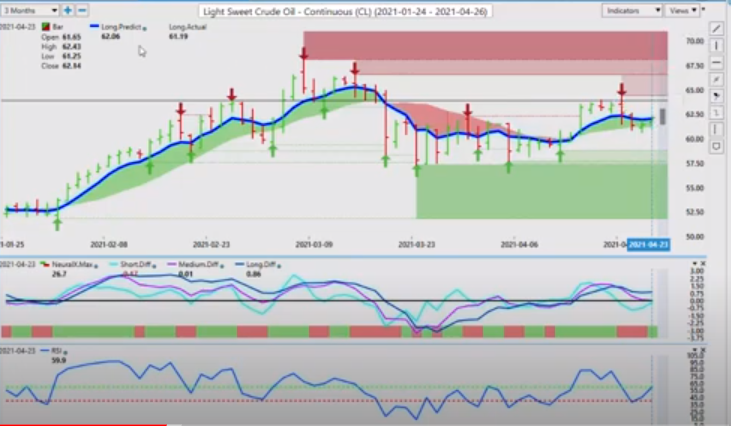
Now with oil prices still on the rise here, correcting backup here, we’re still seeing, again, a very mixed signal between the neural index and the MA diff cross. But what I can assess here is that the RSI, using the 60, 40 split, we’ve come down here, we’ve kissed the 40 level, but we’ve got that reverse check mark and bouncing off of it. So that’s telling me that oil is ramping up for potentially another move back to the upside. And just because the dollar goes up, doesn’t mean that oil can’t go up here also. So what we’ll do is we’ll watch this level, our key pivot areas, 61.60. When we click again on our F8 doing that additional check, you can see that oil is struggling a little bit to get above this level. 62.06, so we didn’t quite close above that. Or actually, excuse me, we closed just above that. So we could see oil spike in early Monday trading.
Bitcoin
Now, once again here, all talk is on Bitcoin. Again, you’ve got the Bitcoin analysts coming out of the woodwork saying that Bitcoin’s going to crash, and Bitcoin is a scam. Well guys, just remember, Bitcoin has doubled every year for the last 10 years in December. In early January I had already made the forecast that Bitcoin would double again this year because it’s done it every other year. So it’s far surpassed my expectations for 2021. So it’s perfectly normal for it to correct lower.
Now, we’re still making new highs here. The most recent high has come as early as, again, April the 14th. So with pending dollar strength with those monthly cycles, it would be perfectly normal for Bitcoin to take a little bit of a hit here. But we’ve got very good support all the way down to the low of 46.37. We’ve already got the same people that told us not to buy Bitcoin, bitcoin’s a scam, it’s not going higher. They’re now calling for Bitcoin down to 20,000. Very, very unlikely guys. 40,000 I could see. 20,000., I don’t see it at this current time, my view may change,
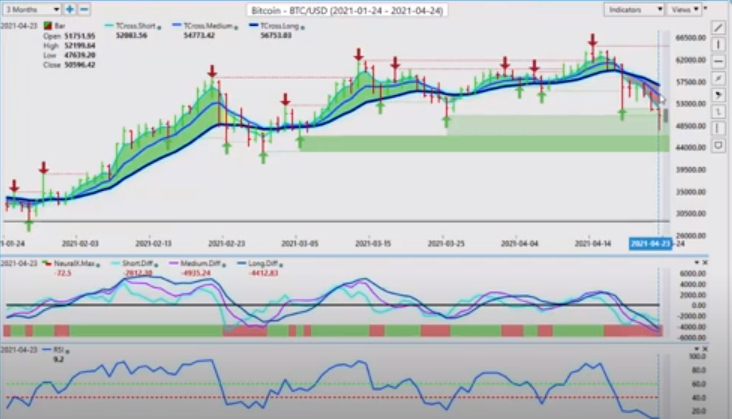
But for now we’ve moved a considerable distance away from the T-cross long at 56,753. Very likely we’re going to retrace to it. So now when we look at an additional retracement point, we would see 53,915. If we can get back up above 53,915, then Bitcoin will resume its uptrend. The RSI heavily oversold at 9.2, as are the VantagePoint predicted differences. So a reversal is very, very likely. Another good example of the aforementioned trade setup, the medium term crossing the longterm predicted difference, while at the same time crossing the long predicted with the neural index. This is a very, very powerful setup regardless of what market you’re trading.
Euro versus U.S. Dollar
Now, as we move into our additional Forex pairs for this week, it’s going to be a choppy week. They’re still going to try and push this Euro higher so the banks can get a very good price on dollar longs. Meaning shorting Euro US. So we’re coming into a very, very strong resistance level, 121.12, and we’ve got additional resistance up to here. But this is the key one that I will point out here guys. You can see this black line that I’ve drawn along here. That’s the yearly opening price. The Euro is indisputably bearish in 2021. We can’t argue that it’s bullish. If you bought Euro US on January one, you’ve been losing money this entire year. So to say it’s bullish, it’s correcting higher right now. It would officially be bullish if we can clear the 122.31, 122.40 areas. So right now I believe that the Euro will potentially have a tough week.
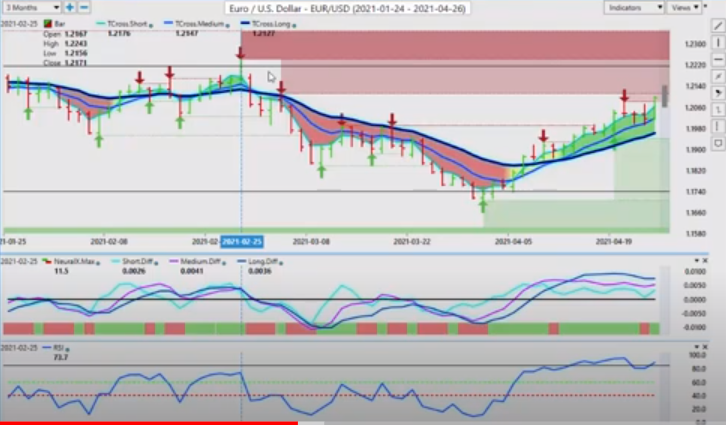
The only positive the Euro has is the FED is a dollar killer, and the FED is on Wednesday. But I still say a lot of the market participants are not on board with the FED’s game plan here. You’ve got some very intelligent people out there that are basically biting at the FED’s heels, wanting more answers as to what supports what they’re doing here. And quite frankly, I agree with them. So we’ll see. But to begin the week, just be aware that even though we have these crossovers on VantagePoint, these verified resistance zones also are based around order flow traders. Be very, very cautious between this level of this high of 121.12, and the additional verified resistance with the yearly opening price in this one 12240 area. Shorts are heavily favored towards the end of the week.
British Pound versus U.S. Dollar
Now, as we continue on with our additional Forex pairs, we’ve seen some good action, good two-way action on the pound dollar. Another excellent way to use the verified resistance zones with the key VantagePoint pivot areas. Two days in a row, we’ve taken a pretty strong bounce off of this T-cross long, 138.41. The pound is likely to come under some pressure mid to late part of the week, under normal dollar, under a period of known dollar strength. So we’ll watch this level at 138.41. Additionally, bringing in that blue line that predicted moving average by itself, you can see that we pushed down below that on a pretty big sell off on Thursday, but we recovered. We didn’t quite close. Well, that could be argued. We closed 138.79, the long predicted 138.76. You got a two or three PIP spread on that pair between the bid and the ask. I would argue a closed rate on it. So it’s not overly bullish.
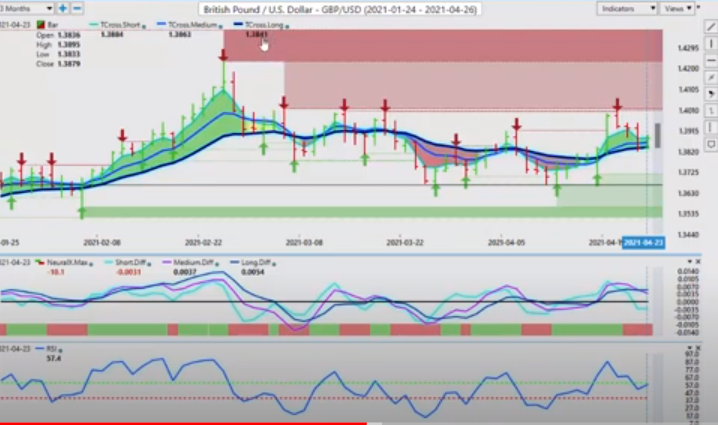
Once again, we’ve got the medium term crossing the longterm predicted difference with the neural index. If we can get this RSI below 50, and more specifically below 40, there’s very, very likely you’re going to see the pound have a deeper corrected move. But once again, just remember here guys, the pound is bullish on the year. This line down here, this black line, the yearly opening price around 136.40, it’s still technically bullish while above this particular level. Now, as we look at the dollar yen next week, the dollar yen, again, if the dollar is getting ready to turn, and gold is going to have a sell off. Just remember, there are three main pairs that are affected by gold.
U.S. Dollar versus Japanese Yen
The US Japan, US Swiss Franc, and Euro US. Euro US would go lower with gold, US-Japan and US-Swiss Franc, they would both extend higher. So there could be some very good buying opportunity next week.
So once again, we’ve got our medium term crossing our longterm predicted difference. We would like to get the neural index in agreement on this. The RSI is just dead in the water here, isn’t it, at 7.1 and it’s not moving. Dollar yen getting very… you’re seeing support starting to stack up down here. So once again, our key level T-cross long, 108.69. But if we click on our F8, and use that predicted moving by itself, indisputably, this is the easiest trading you’ll get guys. Just selling off that blue line. This here, you don’t even have to be in front of the computer guys. VantagePoint updates every night at 6:00 PM. You put your limit orders rate by that blue line.
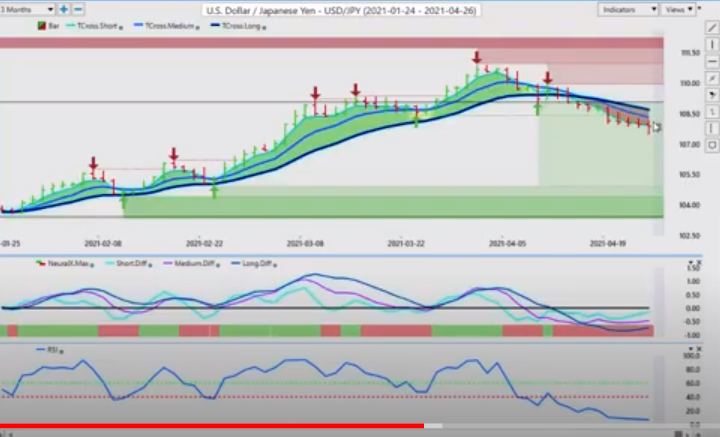
But here’s what I will respectfully submit. Maybe a better play for next week is to have your limit orders not at 108.15, but have your limit orders at about 108.25. So once we clear and get above this blue line, dollar yen is likely to move higher with stocks. But again, we’re expecting that dollar strength. So keep an eye on those particular levels. But again, if we know our main pivot area, a very simple process is just putting limit orders right above that blue line. Soon as it actually makes its way above it, you’re sitting there waiting for it. Okay?
U.S. Dollar versus Canadian Dollar
Now with the US Canadian pair, we’re going to go into our main equity-based currencies here. Now, what I will say, the issue that I’m hearing with the US Canadian pair is this. The bank of Canada this week, in a quite frankly bizarre statement, saying that they the bank of Canada plans on raising rates before the US.
Now that’s one comment that most economists found extremely bizarre. But the other one was that the Canadian economy is doing better. Everything is much better here. Guys, that’s not factual. Ontario, where I’m domiciled, we are in complete lockdown here. Ontario is the most populous province in Canada, highest population. I think something like 38% of the population of Canada is Ontario. So a number of economists have come out in questioning what the bank of Canada is talking about. Again, most businesses are closed in Canada. These numbers that the current government is showing, we’re all very, very confused by this. Now, once again, a full blown lockdown here in Ontario until may the 20th, it’s been just recently extended two weeks. So very confusing statement from the bank of Canada.
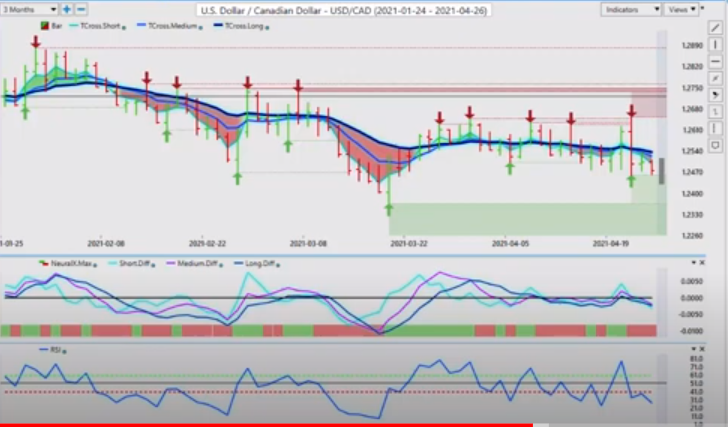
So now what we’re looking at, we’ve got heavy support here. We have to let the market actually digest this. And again, numerous economists have come out scratching their head with these central bankers, saying, “What in the heck is this guy talking about? How could things be improving if they’re in full blown lockdown?” 4,000 COVID cases a day here in Canada. So yes, maybe some things are improving a little bit, but COVID is getting much worse here, guys. So we have to see where we go with this right now. Very, I think, strong support. We may find this to be strong support at 124.75. But the range bottom remains down at 123.65. This is the level we want to watch in my respectful opinion, picking up longs, picking some of the low-hanging fruit I would even call it, down in this between 124.75 and 123.65. I believe that’s a reasonable play as we move into a period of known dollar strength.
Australian Dollar versus U.S. Dollar
Now with the Aussie and New Zealand for next week. Once again, they’re trying to recover. Another good example of using that, the VantagePoint T-cross long, to identify the primary trend. Primary trend is up while the market’s above it, it’s down while it’s below it. So we’re banging into this. And once again, my concern is you’ve got that medium term crossing the longterm predicted difference, and it’s telling us just to be very cautious about buying up here. Okay? We’ve got a newly formed, verified resistance. And you can see, you can almost argue that these verified resistance zones are like a set of steps, and these steps are moving down, not up, right? So keep an eye on this particular level up here at 78.16. I don’t think shorts are unreasonable at this time, but the RSI is still warning us that we have momentum because we’re above 50 and we’re above 60.
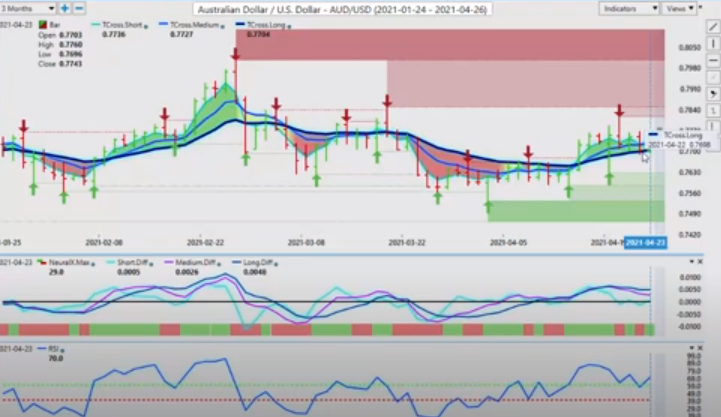
But again, when we click on our F8 to help fine tune that level, you can see we’re very choppy on other side of this blue line. But if we can’t get back up above 77.36 and stay above that, then that will confirm shorts would be the better play. The exact same thing would apply to New Zealand here, guys. A lot of times you hear people say, “Well, I’m long New Zealand US, and I’m short Aussie US.” Guys, it’s virtually the same trade. You don’t want to be long one and short the other. And I would recommend not trading them both at the same time. So right now you can see with New Zealand, we have the same newly formed, verified resistance. The same step pattern that I just discussed with Aussie US. So keep an eye on this high at 72.29.
New Zealand Dollar versus U.S. Dollar
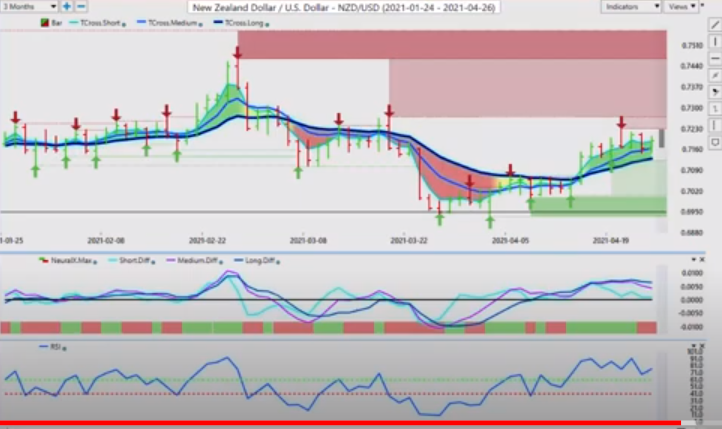
If it doesn’t get above this level, then shorts clearly are the better play. But again, that RSI is still showing some momentum. When we click on our F8 with New Zealand, you can see it’s almost identical to the Aussie. So if you look at this for a minute, take a quick mental snapshot of that. Then I go over to Aussie US, it’s virtually identical. So it’s wandering around, but they both look like they’re getting ready to sell off here. Which would be, again, consistent with that period of known dollar strength. So with that said, this is the VantagePoint AI Market Outlook for the week of April, the 26th, 2021